Abstract
Moving cells can sense and respond to physical features of the microenvironment, however in vivo the significance of tissue topography is mostly unknown. Here we use the Drosophila border cells, an established model for in vivo cell migration, to study how chemical and physical information influence path selection. Although chemical cues were thought to be sufficient, live imaging, genetics, modeling, and simulations show that microtopography is also important. Chemoattractants promote predominantly posterior movement, whereas tissue architecture presents orthogonal information, a path of least resistance concentrated near the center of the egg chamber. E-cadherin supplies a permissive haptotactic cue. Our results provide insight into how cells integrate and prioritize topographical, adhesive, and chemoattractant cues to choose one path among many.
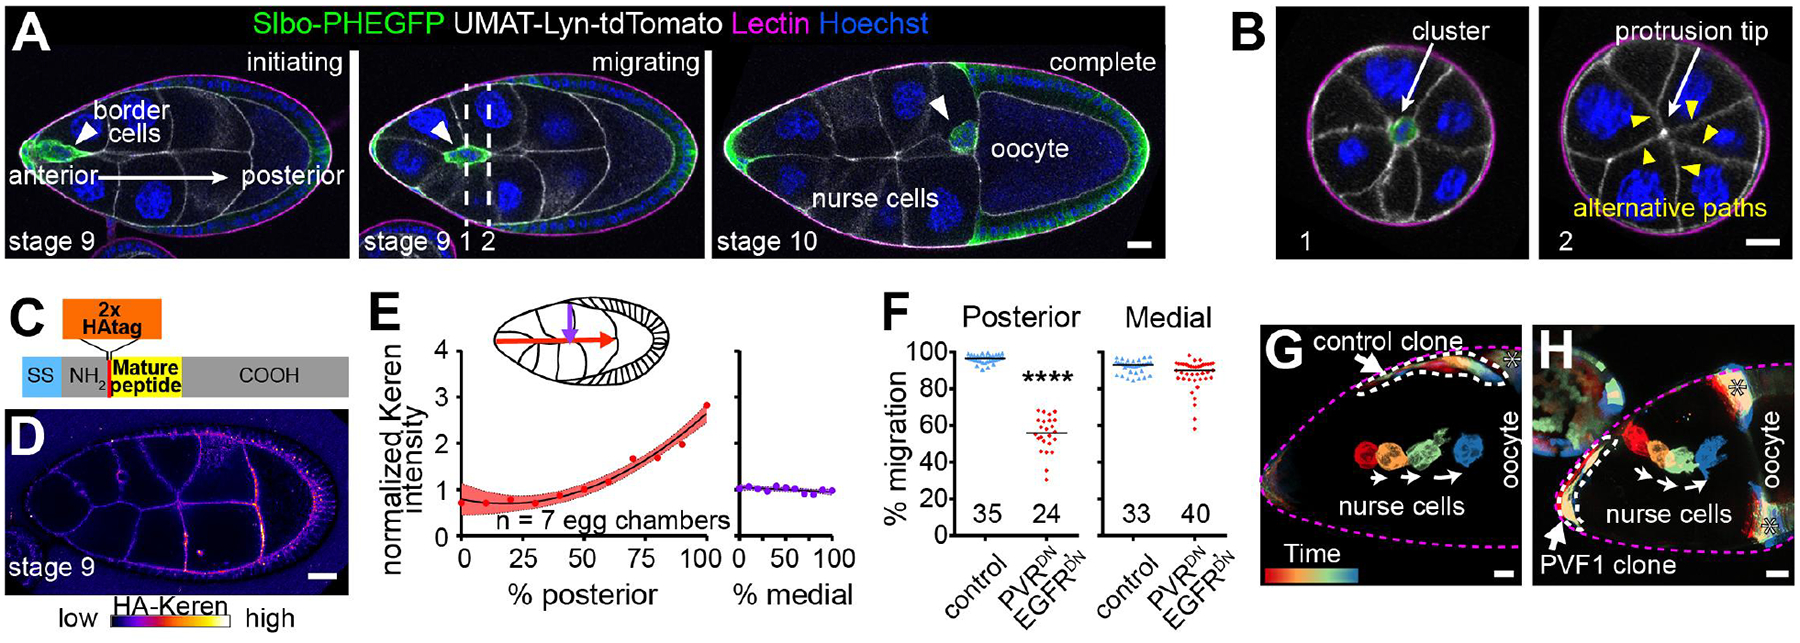
Cell migrations are essential in development, homeostasis, and disease. Although chemoattractants and repellents have been extensively studied (1–3), physical features of the microenvironment may be equally important. Here, we used Drosophila border cells as a model and uncovered a role for tissue topography in directional cell migration in vivo. Border cells are 6 to 10 follicle cells that migrate ~150 mm over 3 to 6 hours within ovarian egg chambers, which are composed of 15 nurse cells and one oocyte encased within ~850 follicle cells (4–6) (Fig. 1A and movie SI).
Fig. 1. Medial migration not primarily controlled by chemoattraction.

(A) Lateral views of egg chambers showing border cell migration between nurse cells to the oocyte. Dashed lines in (A) indicate cross sections shown in (B). (C) HA-tagged endogenous Keren schematic. (D) Anti-HA-stained living egg chamber. (E) HA-Keren quantification. Dots, locations on path. (F) Quantification of border cell position. Each dot indicates one cluster. ****, P < 0.0001 (Mann-Whitney test). (G and H) Rainbow views of border cell migration in control or with ectopic UAS-PVF1. Scale bars, 20 μm.
The oocyte secretes chemoattractants that activate receptor tyrosine kinases (RTKs) (7–10). The platelet-derived growth factor/vascular endothelial growth factor (PDGF/VEGF)- related factor 1 (PVF1) activates its receptor, PVR (8). The ligands Spitz (Spi), Keren (Krn), and Gurken (Grk) activate the Drosophila epidermal growth factor receptor (EGFR) (7). Border cells lacking expression or activity of both RTKs fail to reach the oocyte (8), and ectopic PVF1, Spi, or Krn is sufficient to reroute them (9,10). Similarly, lymphocyte homing, axon pathfinding, and migration of the zebrafish lateral line (11), neural crest (12), and primordial germ cells (13) have been attributed primarily to chemoattraction and/or repulsion. Although substrate stiffness has been studied (14–17), other physical features such as tissue topography remain relatively unexplored.
By reconstructing egg chambers in three dimensions (3D), we noticed two orthogonal components to border cell pathway selection. Border cells migrate from anterior to posterior, the obvious path in a typical lateral view (Fig. 1A and fig. S1A). In addition, they follow a central path (Fig. 1B; fig. S1, B and C; and movie S1) despite encountering ~40 lateral alternatives (Fig. 1B and movie S2).
To address whether the extracellular RTK ligands are present in gradients that might explain both posterior and medial guidance, we used CRISPR to epitope-tag endogenous PVF1, Spi, and Krn (see the materials and methods) [Grk directs dorsal movement only as the cells near the oocyte (4)]. Extracellular hemagglutinin (HA)-tagged Krn (Fig. 1C) accumulated in an anterior (low) to posterior (high) gradient; however, its concentration was not higher medially than laterally (Fig. 1, D and E, and fig. S2, A and B). Intracellular, but not extracellular, HA-tagged PVF1 was detectable (fig. S2, C and D). Tagged Spi was undetectable.
Because we could not detect all ligands, we addressed their contributions by expressing dominant-negative receptors (PVRDN and EGFRDN), which impedes posterior migration (8) (Fig. 1F and fig. S3, A and B). Mediolateral defects were rare, occurring in <10% of egg chambers (Fig. 1F). RNA interference (RNAi) caused similar effects (fig. S3C). Therefore, some other factor(s) must guide the cells medially.
Live imaging of egg chambers with ectopic PVF1 provided further evidence for independent attraction to the egg chamber center (Fig. 1, G and H, and fig. S4). Border cells frequently protruded toward the ligand-expressing cells but remained on the central path (fig. S4, B and C). In other cases (Fig. 1H), border cells migrated along a patch of PVF1-expressing follicle cells, lingered, and then left the clone and returned to the egg chamber center, ignoring more direct routes to the oocyte. PVF1 expression in all anterior follicle cells produced similar results (fig. S4D). Thus, even in the presence of ectopic chemoattractant, border cells preferred the egg chamber center, again suggesting that another signal steers them medially.
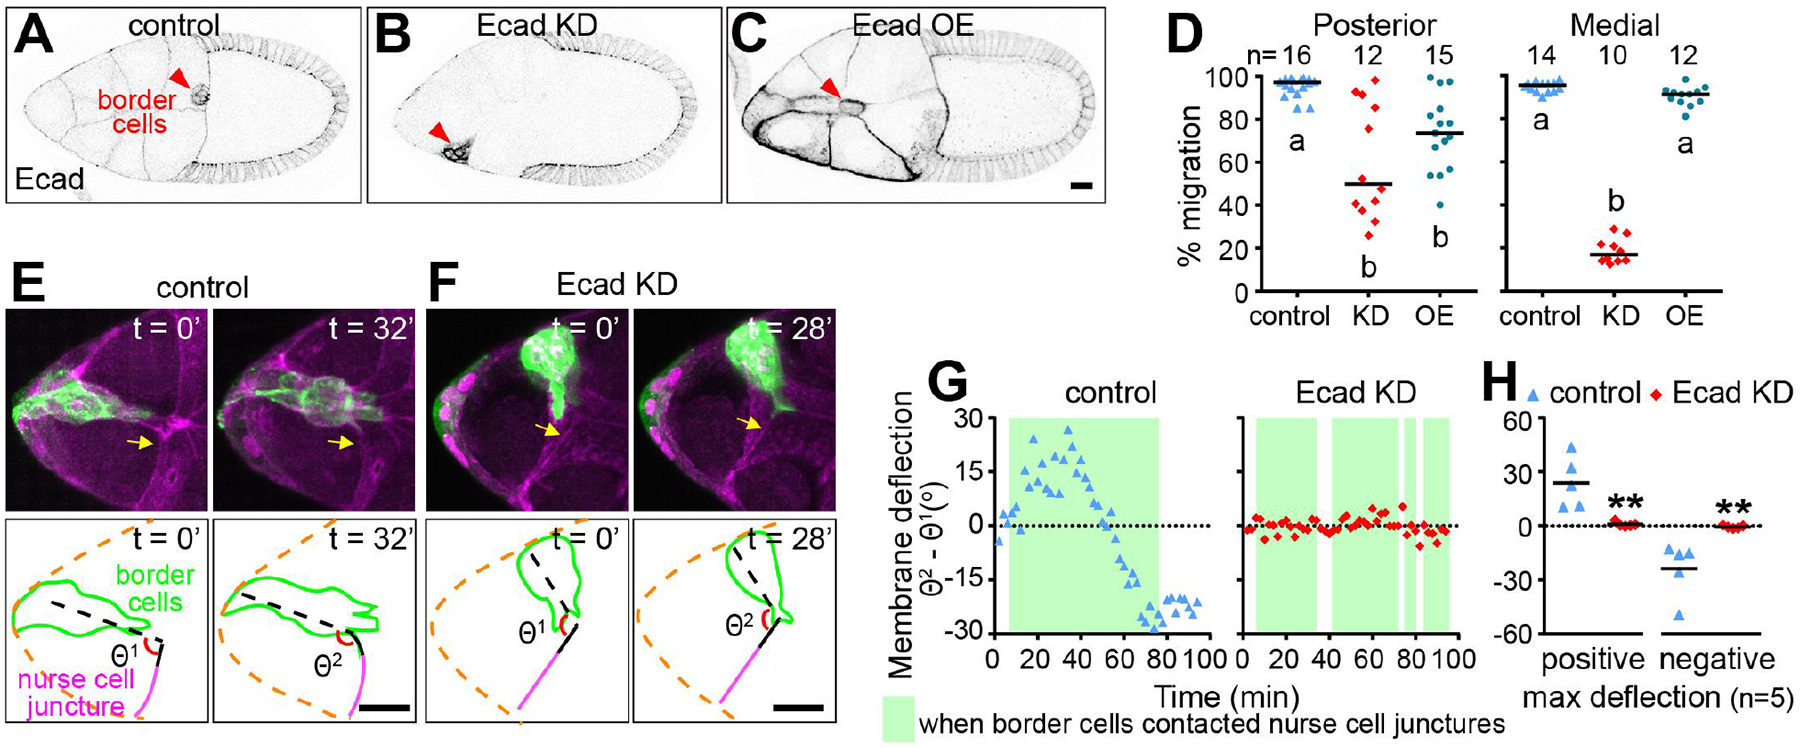
Of all the migration-defective mutants analyzed, only nurse cell knockdown of E-cadherin exhibited marked mediolateral defects (18) (Fig. 2, A and B), causing border cells to move between follicle cells and nurse cells (fig. S5 and movie S3).
Fig. 2. E-cadherin, a permissive medial traction cue.

(A to C)Images of control, nurse-cell E-cadherin knockdown (KD), or mosaic nurse-cell overexpression (OE). (D) Quantification of migration. Letters a and b designate significantly different groups (P < 0.01, Kruskal-Wallist test). (E and F) Still images from movies showing border cells pull on nurse-cell junctures in a control egg chamber (E) and the absence of deflection in an E-cadherin knockdown egg chamber (F). (G) Traces of nurse-cell membrane deflections. (H) Quantification of maximum deflections. (**, P < 0.01 Mann-Whitney test). Scale bars, 20 μm.
How does nurse cell E-cadherin contribute to central path selection? We detected no significant difference in E-cadherin concentration (fig. S6) or dynamics (fig. S7) on central versus side paths, and E-cadherin knockdown did not significantly alter the HA-Krn distribution (fig. S8). Additionally, follicle cells normally express more E-cadherin than nurse cells do (fig. S9A). However, follicle cell RNAi caused no defect (fig. S9B), and E-cadherin overexpression in follicle cells did not affect pathfinding (fig. S9, C to E). Moreover, asymmetric E-cadherin overexpression on nurse cells caused no medial guidance defect (Fig. 2, C and D). Therefore, although the presence of E-cadherin is required, E-cadherin concentration differences are insufficient to steer border cells.
We observed that border cells pulled on wild-type nurse cell membranes as they migrated (Fig. 2E, movie S4, and fig. S10). By contrast, border cells protruding between E-cadherin-negative cells did not deflect their membranes (Fig. 2, F to H, and movie S4), suggesting that border cells could not get traction. This likely accounts for their inability to take the central path. We conclude that E-cadherin supplies a permissive traction cue. This mechanical function amplifies RTK signaling and shapes forward protrusions, as previously described (18); however, something other than differential adhesion must normally steer border cells to the central path.
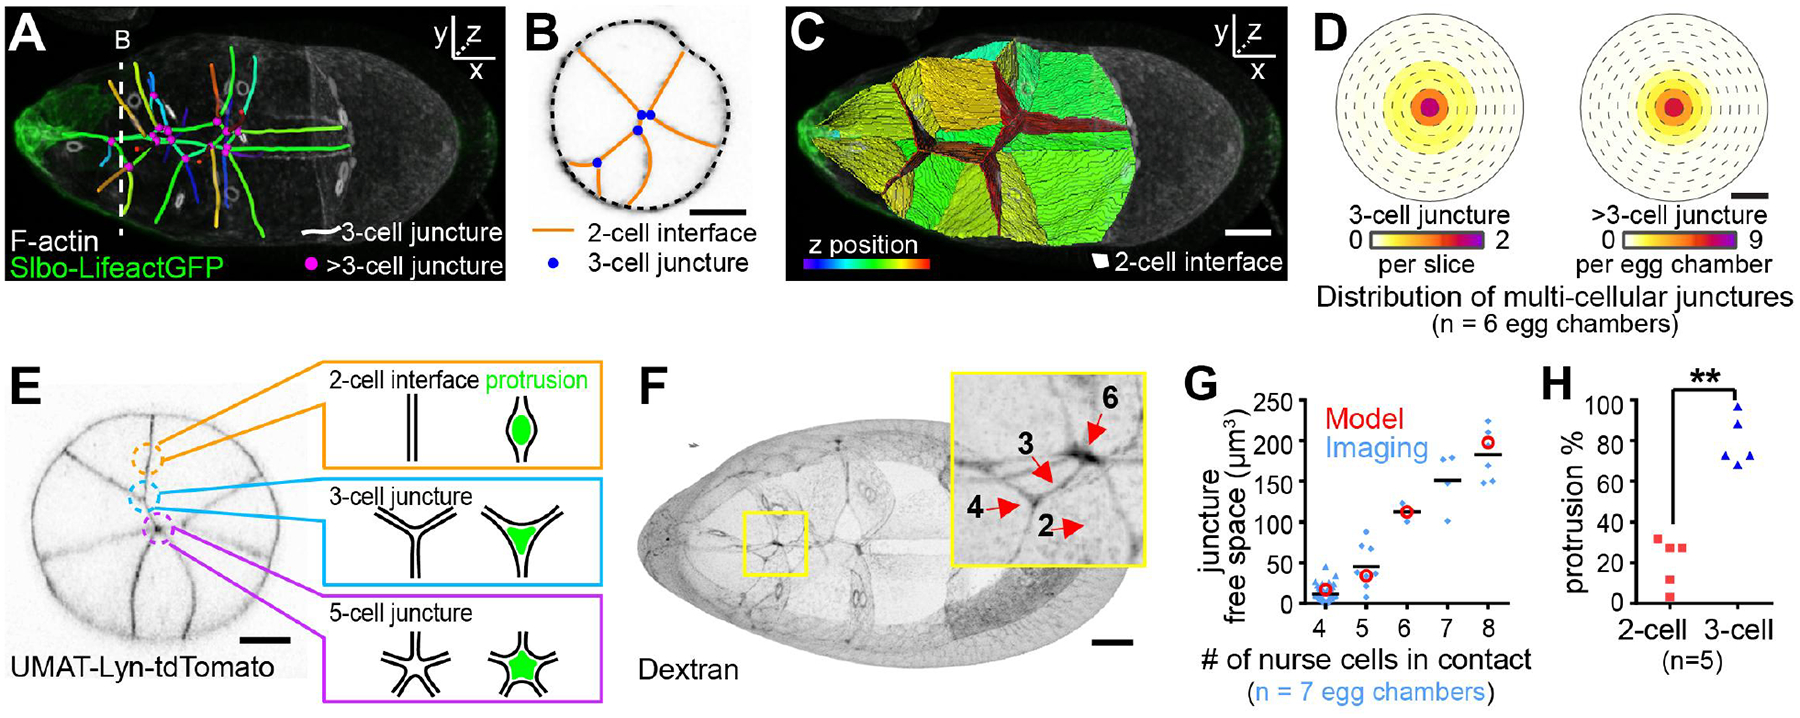
Because neither chemoattractant nor adhesive cues fully accounted for medial pathfinding, we reconstructed egg chambers in 3D and characterized central versus side migration paths. The nurse cell-oocyte complex is a syncytium packed within the follicular epithelium (fig. S11 and movie S5) (19). A feature of the central path is that it is where three or more nurse cells come together (lines in Fig. 3A and fig. S12). Side paths are largely composed of two nurse cell interfaces (lines in Fig. 3B, planes in Fig. 3C, and movie S6). The junctures with three or more nurse cells are enriched near the center (Fig. 3D).
Fig. 3. Centrally enriched multiple-nurse-cell junctures.

(A to C) 3D reconstructions of nurse-cell contacts. Dashed lines in (A) indicate cross sections in (B). (D) Heat map showing distributions of three- (left) or more-than-three- (right) cell junctures as a function of mediolateral position. (E) Schematic representation of protrusion into nurse-cell junctures. (F) Extracellular spaces filled with fluorescent dextran in wild-type. (G) Quantification of the extracellular juncture volume. Values from the 3D model (red) (see the supplementary text, section ST1) and the experimental data (blue). (H) Percentage side protrusions extending to two-cell or three-cell junctures as a fraction of total side protrusions. **, P <0.01 (paired t test). Scale bars, 20 μm.
We considered the influences that this geometry would likely have on border cells squeezing between nurse cells (see the supplementary text, sections ST1 and ST2). Because of the energy cost of unzipping nurse cell-to-nurse cell adhesions, protrusion into regions where multiple nurse cells meet should be more favorable (Fig. 3E). This geometry argument predicts larger spaces where more nurse cells meet (fig. S13, A to D), which we confirmed by measuring extracellular spaces using fluorescent dextran (Fig. 3, F and G). As predicted, germline E-cadherin knockdown opened larger spaces (fig. S13, E to G), confirming that E-cadherin normally seals nurse cells together. The free space should be most relevant at the scale of protrusions, which then steer the cluster. In vitro, migrating cells have been shown to choose channels that accommodate the nucleus (20); here, we show that in vivo, even smaller spaces can guide cells.
To test the prediction that crevices where more cells meet present a lower energy barrier for protrusion, we examined 3D movies. Junctures with three or more nurse cells lined the center path, and forward-directed protrusions always extended between multiple nurse cells. Moreover, when cells encountered two paths each composed of junctures of three or more nurse cells, the cluster extended two protrusions (fig. S14A). Eventually, the protrusion between the greater number of nurse cells always won.
When cells probed side paths, protrusions into three-nurse-cell junctures were more frequent (Fig. 3H and fig. S14B), even though two-nurse-cell interfaces offer vastly greater surface area (Fig. 3, A and C). We conclude that crevices where multiple nurse cells meet create an energetically favorable path, and tissue topography, specifically junctures between three or more nurse cells, normally promotes central pathway selection.
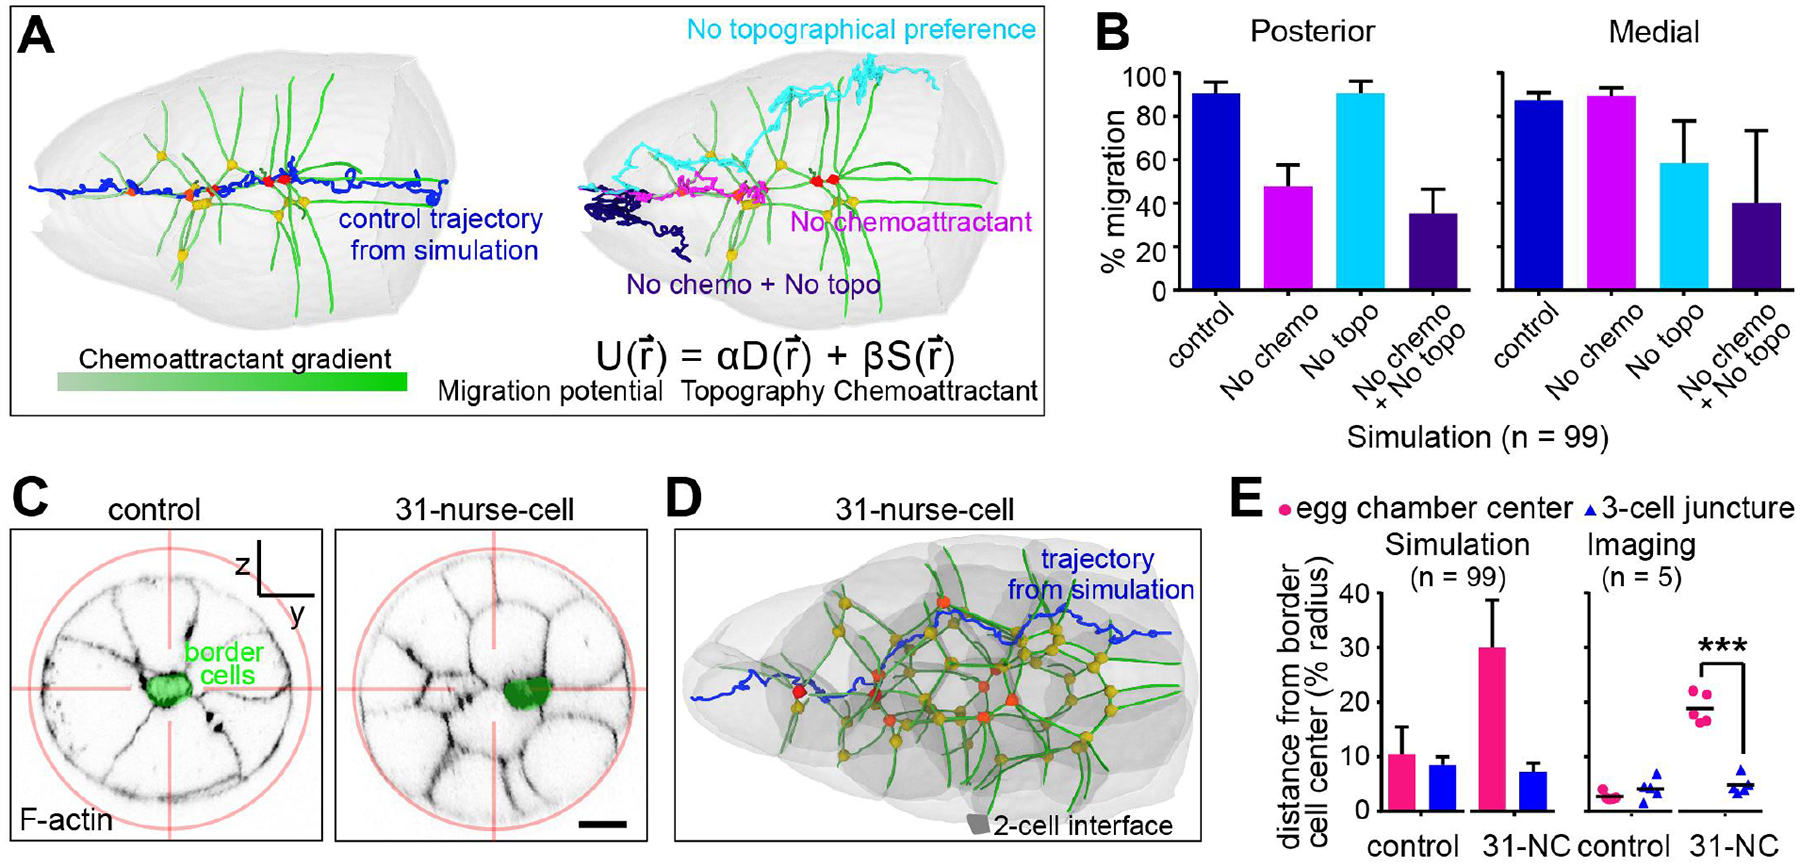
To test whether the combination of an anteroposterior chemoattractant gradient and a bias toward multiple cell junctures is in principle sufficient to explain border cell behavior, we developed a dynamic model that describes the trajectory of border cells moving within a realistic egg chamber (Fig. 4A). We modeled the border cell cluster as a particle that moves stochastically in an effective potential (ST3) that incorporates two independent guidance terms: , the energy cost for the cluster to move between N nurse cells, and β , the anteroposterior chemoattractant gradient. Simulating normal border cell migration conditions replicated normal trajectories (Fig. 4A, and movie S7). Eliminating the chemoattractant caused significant posterior migration defects but little deviation from the central path (Fig. 4A and B), consistent with experimental results (Fig. 1F). By contrast, eliminating the preference for junctures with three or more nurse cells randomized mediolateral path selection without posterior migration defects. Eliminating both terms produced dramatic mediolateral and anterioposterior defects (Fig. 4A and B, fig. S15).
Fig. 4. Multiple-cell junctures steer cells.

(A) Representative simulated trajectories through the wild-type geometry shown in Fig. 3A. (B) Quantification of 99 simulations. (C) Cross-sections showing border cell and nurse-cell positions relative to the egg-chamber center. (D) Representative simulated trajectory. (E) Comparison of the distance from the border cell centroid to the egg-chamber center versus the nearest three-cell juncture. ***, P < 0.001 (paired t-test). Scale bars, 20 μm.
To further test the influence of geometry on guidance, we analyzed egg chambers with atypical geometries. In mutants that disrupt early germ cell divisions (21), we found some 31-nurse-cell egg chambers (fig. S16) with a central two-nurse-cell interface (Fig. 4C). In each instance, the border cells selected the junctures with three or more nurse cells even when off-center (Fig. 4C). Simulating migration using the 31-nurse-cell geometry and the same parameters as for wild-type produced the same result (Fig. 4, D and E).
We also simulated migration in egg chambers lacking nurse cell E-cadherin. The model predicted and experiments confirmed that border cells zigzag along grooves between two nurse cells and the follicular epithelium (fig. S17 and movie S8), where there is more free space (fig. S13, F and G).
We then reexamined the 10% of PVRDN, EGFRDN egg chambers in which border cells were off-center (Fig. 1F). The border cells again moved to sites where multiple nurse cells met (fig. S18), supporting the finding that multiple-cell junctures are energetically favorable even when off-center. Simulations recapitulated the result (figs. S18C and S15B). Many other features of the central path proved inconsequential (figs. S19 to S21).
We measured and manipulated chemical, adhesive, and topographical cues and elucidated their relative contributions to the selection of one migration path among many. RTK signaling normally attracts border cells posteriorly toward the highest ligand concentration. We previously showed that E-cadherin amplifies small differences in chemoattractant concentration between the front and back of the cluster to ensure robust posterior migration (18). Here, we show that nurse cell E-cadherin provides traction, but differential adhesion does not steer the cells medially.
For medial path selection, the organization of the nurse cells is an instructive cue, though we cannot exclude that additional factors such as unknown attractants or repellents might also contribute. At the junctures where multiple nurse cells meet, they do not quite touch because of geometry, leaving tiny openings where protrusions need not break as many adhesion bonds between nurse cells. The concentration of multiple-cell junctures near the egg chamber center provides an energetically favorable medial path.
We gained further insight into how the cells integrate and prioritize the chemical and geometric cues. Normally, the chemoattractants primarily guide the cells posteriorly and multicellular junctures steer them centrally. Near the end of migration, as border cells approach the oocyte, junctures with more than three nurse cells are absent (Fig. 3 A), weakening the central bias of topographical information. Moreover, chemoattractant levels are highest, and the dorsally enriched ligand Gurken is present (10). The border cells typically squeeze between two nurse cells to move dorsally (fig. S22, A and B, and movie S9). Adding Grk into the model and simulation accurately predicted this dorsal turn (fig. S22, C and D, and movie S10). Like the effect of ectopic PVF1, this result shows that when the ligand concentration is high enough, the chemical cue can dominate, allowing cells to move through suboptimal physical space. Similarly, when E-cadherin-mediated traction is unavailable on nurse cells, border cells migrate on follicle cells, choosing grooves where multiple cells meet. This work thus elucidates how border cells integrate and prioritize chemical, adhesive, and physical features of their in vivo microenvironment to choose a path.
Supplementary Material
Acknowledgments
We thank B. Cheng, S. Dhar, Y. Li, M. A. Pastor and R. Wu for technical assistance.
Funding:
This work was supported by NIH grant GM46425 to D.J.M, NSF grant PHY-1707637 to W.-J.R. and ACS grant PF-17–024-01-CSM to J.P.C. We thank the Developmental Studies Hybridoma Bank for providing antibodies and H. Sung, H. Jean Rene, the Bloomington Drosophila Stock Center, and the Vienna Drosophila Resource Center for providing fly stocks. We acknowledge the use of the NRI-MCDB Microscopy Facility and the Imaris computer workstation supported by the Office of The Director, National Institutes of Health of the NIH under Award # S10OD010610. N.S.G. is the incumbent of the Lee and William Abramowitz Professorial Chair of Biophysics and this research was supported by the Israel Science Foundation (grant no. 1459/17).
Footnotes
Competing Interests: The authors declare no competing interests.
Data and materials availability: all data are available in the manuscript or the supplementary materials. Materials available upon request.
Supplementary Materials
Materials and Methods
Supplementary Text
Fig. S1 to S23
Tables S1 to S11
References (22–28)
Movies S1 to S10
References and Notes
- 1.Cai D, Montell DJ, Curr. Opin. Cell Biol 30, 91–98 (2014). [DOI] [PMC free article] [PubMed] [Google Scholar]
- 2.Artemenko Y, Lampert TJ, Devreotes PN, Cell. Mol. Life Sci 71, 3711–3747 (2014). [DOI] [PMC free article] [PubMed] [Google Scholar]
- 3.Swaney KF, Huang C-H, Devreotes PN, Annu. Rev. Biophys 39, 265–289 (2010). [DOI] [PMC free article] [PubMed] [Google Scholar]
- 4.Montell DJ, Yoon WH, Starz-Gaiano M, Nat. Rev. Mol. Cell Biol 13, 631–645 (2012). [DOI] [PMC free article] [PubMed] [Google Scholar]
- 5.Scarpa E, Mayor R, J. CellBiol 212, 143–155 (2016). [DOI] [PMC free article] [PubMed] [Google Scholar]
- 6.Friedl P, Gilmour D, Nat. Rev. Mol. Cell Biol 10, 445–457 (2009). [DOI] [PubMed] [Google Scholar]
- 7.Duchek P, Rørth P, Science. 291, 131–133 (2001). [DOI] [PubMed] [Google Scholar]
- 8.Duchek P, Somogyi K, Jékely G, Beccari S, Rørth P, Cell. 107, 17–26 (2001). [DOI] [PubMed] [Google Scholar]
- 9.McDonald JA, Pinheiro EM, Montell DJ, Development. 130, 3469–3478 (2003). [DOI] [PubMed] [Google Scholar]
- 10.McDonald JA, Pinheiro EM, Kadlec L, Schupbach T, Montell DJ, Dev. Biol 296, 94–103 (2006). [DOI] [PubMed] [Google Scholar]
- 11.Bussmann J, Raz E, EMBOJ. 34, 1309–1318 (2015). [DOI] [PMC free article] [PubMed] [Google Scholar]
- 12.Mayor R, Theveneau E, Development. 140, 2247–2251 (2013). [DOI] [PubMed] [Google Scholar]
- 13.Richardson BE, Lehmann R, Nat. Rev. Mol. Cell Biol 11, 37–49 (2010). [DOI] [PMC free article] [PubMed] [Google Scholar]
- 14.Ng MR, Besser A, Danuser G, Brugge JS, J. Cell Biol 199, 545–563 (2012). [DOI] [PMC free article] [PubMed] [Google Scholar]
- 15.Aranjuez G, Burtscher A, Sawant K, Majumder P, McDonald JA, Mol. Biol. Cell 27, 1898–1910 (2016). [DOI] [PMC free article] [PubMed] [Google Scholar]
- 16.Barriga EH, Franze K, Charras G, Mayor R, Nature. 554, 523–527 (2018). [DOI] [PMC free article] [PubMed] [Google Scholar]
- 17.Zanotelli MR et al. , Nat. Commun 10, 4185 (2019). [DOI] [PMC free article] [PubMed] [Google Scholar]
- 18.Cai D et al. , Cell. 157, 1146–1159 (2014). [DOI] [PMC free article] [PubMed] [Google Scholar]
- 19.Alsous JI, Villoutreix P, Stoop N, Shvartsman SY, Dunkel J, Nat. Phys 14, 1016–1021 (2018). [DOI] [PMC free article] [PubMed] [Google Scholar]
- 20.Renkawitz J et al. , Nature. 568, 546–550 (2019). [DOI] [PMC free article] [PubMed] [Google Scholar]
- 21.Matias NR, Mathieu J, Huynh J-R, PLoS Genet. 11, el004653 (2015). [DOI] [PMC free article] [PubMed] [Google Scholar]
Associated Data
This section collects any data citations, data availability statements, or supplementary materials included in this article.


