

Abstract
Objective
This study aimed to assess the spatial distribution, individual and community-level factors associated with low birth weight in Ethiopia.
Method
Secondary data analysis was conducted using the 2016 Ethiopian Demographic and Health Survey data. A total of 2110 neonates were included in this study. Spatial autocorrelation analysis was conducted to assess the spatial clustering of LBW. Besides, the spatial scan statistics and ordinary kriging interpolation were done to detect the local level clusters and to assess predicted risk areas, respectively. Furthermore, a multilevel logistic regression model was fitted to determine individual and community-level factors associated with LBW. Finally, most likely clusters with log-likelihood ratio (LLR), relative risk and p value from spatial scan statistics and adjusted OR (AOR) with 95% CI for multilevel logistic regression model were reported.
Results
LBW was spatially clustered in Ethiopia. Primary (LLR=11.57; p=0.002) clusters were detected in the Amhara region. Neonates within this spatial window had a 2.66 times higher risk of being LBW babies as compared with those outside the window. Besides, secondary (LLR=11.4; p=0.003; LLR=10.14, p=0.0075) clusters were identified at southwest Oromia, north Oromia, south Afar and southeast Amhara regions. Neonates who were born from severely anaemic (AOR=1.40, 95% CI (1.03 to 2.15)), and uneducated (AOR=1.90, 95% CI (1.23 to 2.93)) mothers, those who were born before 37 weeks of gestation (AOR=5.97, 95% CI (3.26 to 10.95)) and women (AOR=1.41, 95% CI (1.05 to 1.89)), had significantly higher odds of being LBW babies.
Conclusion
The high-risk areas of LBW were detected in Afar, Amhara and Oromia regions. Therefore, targeting the policy interventions in those hotspot areas and focusing on the improvement of maternal education, strengthening anaemia control programmes and elimination of modifiable causes of prematurity could be vital for reducing the LBW disparity in Ethiopia.
Keywords: epidemiology, health services research, neonatology
What is known about the subject?
Socioeconomic inequalities, malnutrition and inadequate access to healthcare during pregnancy are all associated with low birth weight (LBW) babies. Both mortality and morbidity are higher in LBW babies. There are significant geographical variations in the prevalence of LBW babies in Ethiopia.
What this study adds?
Rural areas with an increased prevalence of LBW babies and hotspot clusters were identified. Besides, maternal risk factors were severe anaemia, lack of education and living in communities with high poverty.
Introduction
Globally, neonatal deaths accounted for 46% of all under-five deaths of which 38% occurred in sub-Saharan Africa. Ethiopia is one of five countries that account for about half of all global neonatal deaths.1 The 2016 Ethiopian Demographic and Health Survey (EDHS) report shows the neonatal mortality rate to be 29 per 1000 live births. This is far from the Sustainable Development Goal target of 12 deaths per 1000 live births.2
Low birth weight (LBW), defined as weight at birth less than 2500 g,3 is the leading cause of neonatal mortality. LBW babies are highly vulnerable to death than heavier ones.4 In Ethiopia, it accounts for about 4% of total deaths.5
The consequence of LBW is not limited to neonatal and infant mortality but it also results in physical and developmental health problems in subsequent childhood and adulthood life. It leads to poor childhood growth and a higher incidence of adulthood chronic diseases like type 2 diabetes, hypertension and cardiovascular disease.6 This indicates that LBW is a basement for the majority of adulthood chronic diseases. It also has long-term consequences like poor cognitive function, academic underachievement and impaired behaviour.7 8 Moreover, LBW is a summary measure of multifaceted public health problems such as maternal malnutrition, ill-health and poor pregnancy-related health service utilisation.6 9
Globally, more than 20 million LBW infants are born. Among these, nearly half (48%) of the births occur in southern Asia. In sub-Saharan Africa, the number of LBW live births is estimated to have increased from 4.4 million in 2000 to 5 million in 2015.10 These rates are high, even though the data on LBW remain limited as many deliveries occur at home or small health clinics and were not reported in official figures, which may result in an underestimation of the true prevalence. Therefore, WHO incorporated as a third target to achieve a 30% reduction in LBW incidence by 2025.11
Even though data on LBW was limited due to low institutional delivery in Ethiopia, the prevalence of LBW increased by 5% from 200012 to 2016.13 Furthermore, the evidence from a systematic review and meta-analysis shows the pooled prevalence of LBW to be 17.3%.14 The prevalence of LBW is different across different geopolitical regions in Ethiopia.15–17 This indicates that the variation in the prevalence of LBW across different administrative regions could provide an insight to identify risk (hotspot) areas by using spatial technology.
Research conducted in different countries on determinants of LBW showed various socio-demographic, socioeconomic, maternal health service-related and community-related factors to be predictors of LBW.15 18 19 In Ethiopia, prior studies have been done to identify sociodemographic, pregnancy and maternal health service-related factors.20–23 Even though the LBW was affected by factors operating at both individual and community levels, none of the studies have tried to look at the factors that affect LBW at community and individual levels simultaneously. Furthermore, there was limited evidence on the spatial distribution of LBW in Ethiopia.
Therefore, this study aimed at identifying both individual and community-level factors associated with LBW simultaneously by applying a multilevel analysis. Besides, it tried to identify high risk (hotspot) areas of LBW through spatial analysis. Thus, the implication of this study is to provide evidence for policymakers (nationwide data) to narrow the geographical disparity of LBW across regions in Ethiopia by strengthening maternal and child health intervention programmes.
Methods
Patient and public involvement
This study used a publicly available data set (EDHS 2016); therefore, there were no patients or members of the public directly involved.
Data source
Secondary data analysis was employed to identify spatial distribution and factors associated with LBW. An authorisation letter for the use of this data was obtained from Measure DHS and the data set was downloaded from the website; www.measuredhs.com. The survey covered all the nine regions and two administrative cities in Ethiopia (figure 1).
Figure 1.

The nine regional states and two adminstrative cities in Ethiopia.
The participants were selected using a stratified two-stage cluster sampling technique. The survey collected information from a nationally representative sample of 16 583 eligible women within 645 enumeration areas. The full method applied to the data collection procedure for EDHS 2016 was published elsewhere.13 A total of 2110 neonates nested within 542 communities (clusters) were included in this study. The sampling weight was applied during the analysis to produce reliable estimates.
Study variables
Dependent variable
The main outcome variable of this study was birth weight. Data on the birth weight of children were collected from mothers who gave birth within 5 years before the survey either by accessing birth weight through record review or by the mother’s report by recalling the measured weight of the child at birth. The births without recorded birth weight were excluded from the study. Finally, birth weight was categorised as a birth weight of ≥2.5 kg or <2.5 kg for further analysis.
Independent variables
The determinants of LBW were extracted after reviewing literature at a global level. Maternal age, maternal education, sex of neonate, wealth index, media exposure, number of antenatal care (ANC) visits, gestational age, maternal anaemia, maternal body mass index (BMI), iron supplementation, maternal height, birth order, birth interval and caesarean delivery were individual-level predictors.
Whereas, place of residence and variables which were constructed by aggregating individual-level characteristics at the community (cluster) level were considered as community-level variables. The proportion of the aggregated variables was dichotomised after checking the distribution by using the histogram. If the aggregate variable was normally distributed mean value and if not, normally distributed median value was used as a cut-off point for the categorisation. Therefore, the community poverty level was categorised as high if the proportion of women from the two lowest wealth quintiles in a given community was 70%–100% and low if the proportion was less than 70%. Community media exposure was categorised as low if the proportion of women exposed to media in the community was 0%–83.33% and categorised as high if the proportion was 83.33%–100%, Community women education was categorised as low if the proportion of women with no formal education in the community was 14.83%–100% and categorised as high if the proportion was 0%–14.83%.
Spatial analysis
Spatial autocorrelation analysis
The Global Moran’s I statistic test was used to measure whether the LBW patterns were randomly distributed, dispersed or clustered in Ethiopia. The calculated Moran’s I values close to −1 indicate disease dispersed, whereas I close to +1 indicate disease clustered, and if the I value is close to 0 the disease is distributed randomly.20 21 The Global Moran’s I was computed as follows22;
Where yi represents the vector of observations at n different locations, and wij are elements of a spatial weight matrix.
Spatial scan statistical analysis
The spatial scan statistical method; a powerful method in detecting local clusters as compared with available spatial statistical methods,23 was used to identify statistically significant spatial hotspots/clusters of LBW. This method uses a scanning window that moves across the study area.24 25 LBW newborns were considered to be cases and those who were not born being LBW were considered to be controls to fit the Bernoulli model. The default maximum spatial cluster size of <50% of the population was used. The primary and secondary clusters were detected and ranked according to the likelihood ratio test, based on 999 Monte Carlo replications.26 27
Spatial interpolation
The spatial interpolation technique was used to predict LBW on the unsampled areas in the country based on sampled enumeration areas. Therefore, the ordinary kriging interpolation method was employed to estimate the burden of LBW in unsampled areas since it incorporates the spatial autocorrelation and it statistically optimises the weight.
Multilevel logistic regression analysis
Because of the hierarchical nature of data and the dichotomous outcome variable, the multilevel logistic regression model was fitted after testing the significance of the community variance. The individual and community level variables associated with LBW were checked independently in the bivariable multilevel logistic regression model and variables that were statistically significant at p value 0.2 were considered for the multivariable logistic regression.
First null model (model without explanatory variables) was fitted to assess community variance and the applicability of multilevel analysis. The second and the third models were adjusted for individual and community level variables, respectively. In the fourth model both individual and community-level variables were included. The fifth model (final model) was used to estimate whether community factors moderated the association between individual factors and the dependent variable by introducing an interaction term.
The fixed effects were used to estimate the association between the likelihood of LBW and explanatory variables at both community and individual level and were reported as OR with 95% CI. To assess measures of variation intracluster correlation coefficient (ICC), proportional change in community variance (PCV) and median OR (MOR) were used.
Results
In this study, a total of 2110 neonates were included. Of these, nearly half (51%) were men and 28.84% were born from mothers with no formal education. The mean age of their mothers was 29 (SE=0.13) years. About two-thirds (67%) of neonates were born from mothers who were exposed to media. About 14% and 43% of neonates were born from severely anaemic and mothers who did not receive iron during pregnancy, respectively. Regarding the ANC visits more than half (56%) of neonates were born from mothers who have more than three ANC visits. The majority (97%) of neonates were born after 37 weeks of gestation. Looking at the wealth index, nearly two-thirds (68%) of neonates were from rich households (table 1).
Table 1.
Individual-level characteristics of participants, Ethiopian Demographic and Health Survey 2016 (N=2210)
| Low birth weight | P value | |||
| Variables | Yes N (%) |
No N (%) |
Total N (%) |
|
| Maternal age | 0.36 | |||
| 15–19 | 15 (28.81) | 72 (71.19) | 87 (3.92) | |
| 20–24 | 53 (9.3) | 427 (90.7) | 480 (21.50) | |
| 25–29 | 80 (14.36) | 596 (85.64) | 676 (35.68) | |
| 30–34 | 49 (13.62) | 413 (86.38) | 462 (21.50) | |
| 35–49 | 38 (23.30) | 365 (88.70) | 403 (12.38) | |
| Maternal educational level | 0.02 | |||
| No education | 78 (18.21) | 486 (81.79) | 565 (28.89 | |
| Primary | 90 (11.03) | 697 (88.97) | 787 (38.01) | |
| Secondary and above | 67 (11.27) | 692 (88.73) | 759 (33.08) | |
| Gestational age | <0.01 | |||
| <37 weeks | 23 (45.65) | 25 (54.35) | 40 (3.07) | |
| ≥37 weeks | 212 (12.16) | 1279 (87.84) | 1835 (96.93) | |
| Iron supplementation | ||||
| Yes | 119 (12.66) | 1049 (87.34) | 1168 (56.79) | 0.123 |
| No | 116 (13.86) | 826 (86.14) | 942 (43.21) | |
| Number of antenatal care visits | 0.08 | |||
| <4 visits | 112 (15.95) | 782 (84.05) | 894 (43.41) | |
| ≥4 visits | 123 (11.05) | 1082 (88.95) | 1216 (56.59) | |
| Media exposure | 0.10 | |||
| Yes | 151 (12.52) | 880 (87.48) | 1454 (66.98) | |
| No | 84 (14.51) | 424 (85.49) | 656 (33.02) | |
| Maternal body mass index | 0.46 | |||
| Underweight | 38 (19.02) | 274 (80.98) | 312 (13.65) | |
| Normal | 150 (13.09) | 1139 (86.91) | 1289 (67.64) | |
| Overweight/obese | 47 (9) | 442 (91) | 509 (13.32) | |
| Wealth index | 0.02 | |||
| Poor | 50 (15.83) | 332 (84.17) | 259 (17.24) | |
| Middle | 30 (17.22) | 158 (82.78) | 209 (13.91) | |
| Rich | 155 (11.70) | 1385 (88.30) | 1034 (68.84) | |
| Maternal anaemia | 0.01 | |||
| Not anaemic | 152 (14.78) | 1305 (87.12) | 1457 (75.96) | |
| Mild | 12 (8.54) | 159 (91.50) | 171 (5.46) | |
| Moderate | 13 (14.06) | 95 (85.94) | 108 (4.26) | |
| Severe | 58 (16.28) | 316 (83.72) | 374 (14.31) | |
| Sex of infant | 0.05 | |||
| Male | 106 (10.93) | 972 (89.06) | 1078 (51.13) | |
| Female | 129 (15.51) | 903 (84.49) | 1032 (48.97) | |
Community-level characteristics of participants
A total of 452 communities (clusters) were included in this study. About two-thirds (67.44%) of neonates were from a community with a low poverty level and nearly half (51.33%) of them were from rural communities. Regarding community women education, 42% of neonates were from communities with high women literacy (table 2).
Table 2.
Community-level characteristics of study subjects, Ethiopian Demographic and Health Survey 2016 (N=2210)
| Low birth weight | P value | |||
| Variables | Yes N (%) |
No N (%) |
Total (%) N (%) |
|
| Community poverty level | 0.12 | |||
| Low | 147 (12.64) | 1267 (87.36) | 1414 (67.44) | |
| High | 88 (14.32) | 608 (85.68) | 696 (32.56) | |
| Community media exposure | 0.01 | |||
| Low | 132 (15.09) | 890 (84.91) | 1022 (49.41) | |
| High | 103 (11.32) | 985 (88.68) | 1088 (50.59) | |
| Community women education | 0.03 | |||
| Low | 102 (10.92) | 953 (89.08) | 1055 (48.14) | |
| High | 133 (15.27) | 922 (84.73) | 1055 (51.86) | |
| Place of residence | 0.08 | |||
| Urban | 130 (10.94) | 1146 (89.06) | 1276 (48.67) | |
| Rural | 105 (15.31) | 729 (84.69) | 834 (51.33) | |
Spatial distribution of LBW in Ethiopia
As indicated in figure 2, the spatial variation of the proportion of LBW was mapped. Thus, the high prevalence of LBW was observed in Afar, northwest Amhara, northeast Southern Nations, Nationalities and Peoples (SNNP), the central part of the Oromia region and Somali regional states of Ethiopia (figure 2).
Figure 2.
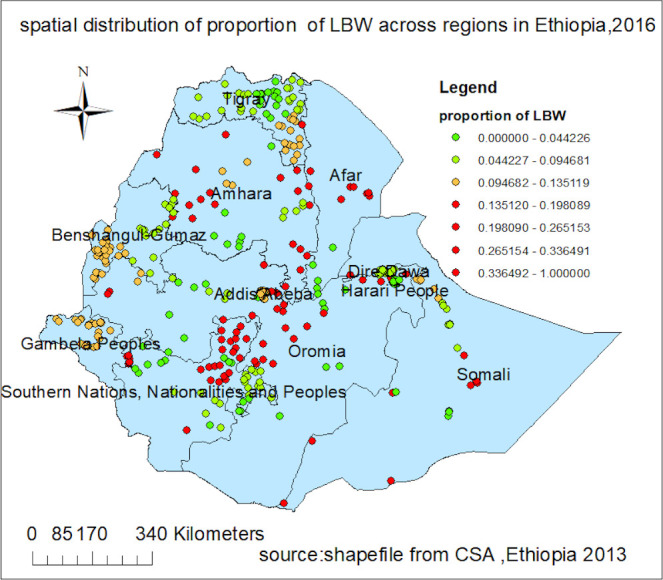
Spatial distribution of low birth weight (LBW) in Ethiopia.
Spatial autocorrelation of LBW in Ethiopia
LBW was spatially clustered in Ethiopia with Global Moran’s I=0.56 and p=0.001 (figure 3). The clustered patterns (on the right sides) show high rates of LBW occurred over the study area. The z-score of 45.57 indicated that there is less than 1% likelihood that this clustered pattern could be the result of random chance.
Figure 3.
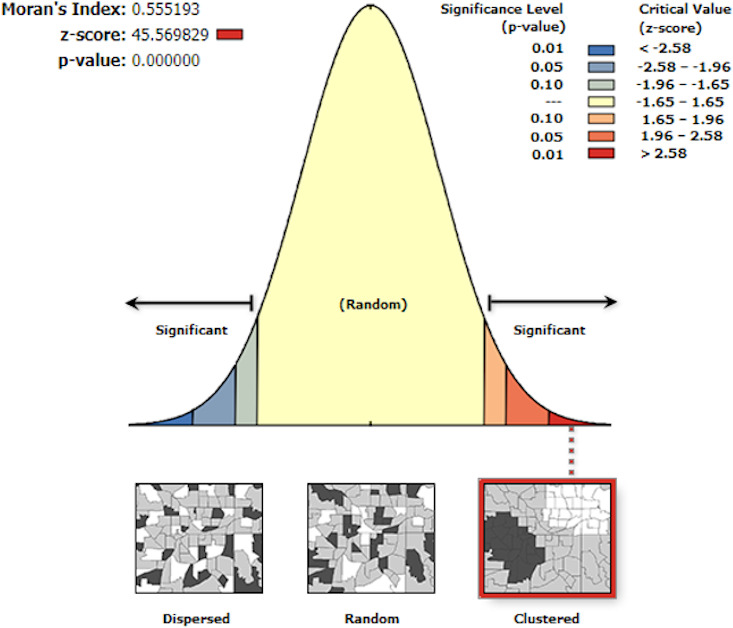
Spatial autocorrelation of low birth weight in Ethiopia, Ethiopian Demographic and Health Survey 2016.
Spatial scan statistics of LBW in Ethiopia
Spatial scan statistics identified 40 significant clusters of which 15 were primary clusters and 25 were secondary clusters. The primary clusters' spatial window was located in the northwest Amhara and northeast part of Benishangul-Gumuz, which was centred at 11.57418N, 36.498123E with 122.56 km radius, and log-likelihood ratio (LLR) of 11.82, at p<0.01. Neonates within this spatial window had 2.66 times higher risk of being LBW babies as compared with those outside the window.
Two other significant spatial windows were located in southwest Oromia and at the border of southeast Amhara, south Afar and the northern part of Oromia regions. The one located in the southwest Oromia region was centred at 7.192884N, 39.02565E with 30.83 radius, LLR of 11.43 and p value 0.003. Neonates within this scanning window had a 4.82 times higher risk of being LBW than those outside the scanning window. The third scanning window which was located at the border of three regions (Amhara, Afar and Oromia) was centred at 10.143320N, 39.718498E with a 158.43 km radius and LLR of 10.37 at p value 0.0075. Thus, the likelihood of being LBW among neonates inside this scanning window was 2.52 times higher as compared with those outside the window (figure 4, table 3).
Figure 4.

The spatial scanning statistics of low birth weight in Ethiopia, 2016.
Table 3.
Significant spatial clusters of low birth weight in Ethiopia, Ethiopian Demographic and Health Survey 2016
| Clusters | Enumeration areas detected | Population | Cases | Log-likelihood ratio | Relative risk |
Coordinate/radius | P value |
| 1* | 259, 602, 541, 386, 548, 361, 515, 498, 516, 109, 292, 533, 73, 167, 52 | 94 | 30 | 11.82 | 2.66 | 11.58N, 36.50E/122.56 km | <0.01 |
| 2† | 26 589 | 18 | 11 | 11.41 | 4.82 | 7.19N, 39.03E/30.83 km | <0.01 |
| 3† | 637, 310, 295, 484, 624, 135, 617, 230, 18, 423, 121, 616, 49, 345, 254, 611, 71, 40, 303, 90, 287, 402, 560 | 95 | 29 | 10.37 | 2.52 | 10.14N, 39.72E/158.43 km | <0.01 |
*Primary clusters.
†Secondary clusters.
Spatial interpolation of LBW in Ethiopia in 2016
In ordinary kriging spatial interpolation zone 1, zone 4 and zone 5 in Afar region; Wag Himra, north Gonder and Awi in Amhara region; west Welega and west Arsi in Oromia region; Gurage, Silti and Debub Omo in SNNP region were areas at high-risk of LBW (figure 5).
Figure 5.
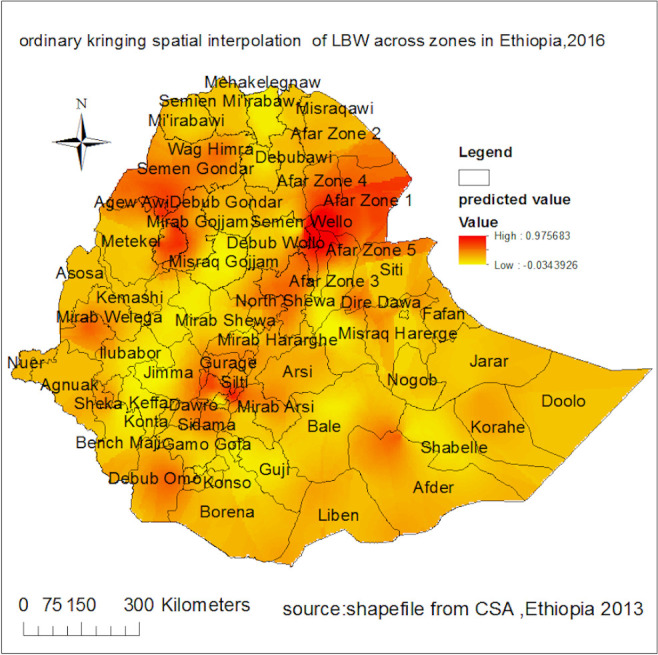
The ordinary kriging spatial interpolation of low birth weight (LBW) across regions in Ethiopia, Ethiopian Demographic and Health Survey 2016.
Multilevel logistic regression analysis
Random effect analysis results
In the null model, variance component analysis was performed to decompose the total variance of LBW. The applicability of the multilevel mixed-effects logistic regression model in the analysis was justified by the significance of the community-level variance (community variance=0.435; SE=0.19; p value=0.001), indicating the existence of significant differences between communities regarding LBW incidence. The community variance was expressed as the ICC and the MOR. The ICC was 0.117 which revealed that 11.7% of the total variance of LBW in Ethiopia can be attributed to the context of the communities where the mothers were dwelling. Since it was greater than 0.05 the nuisance of clustering was adjusted to produce reliable estimates.28 Moreover, the MOR was 1.88 with the 95% CI (1.27 to 2.34) which implied that the odds of having LBW was increased by 88% when mothers moved from low to high-risk communities.
In the final model the PCV was 35%. This showed that 35% of community variance observed in the null model was explained by both community and individual-level variables. For model comparison, the LLR and deviance were used. Consequently, model with the highest log likelihood or lowest deviance value (Model V) was the best-fitted model (table 4).
Table 4.
Random effects and model fitness
| Random effects | Model I | Model II | Model III | Model IV | Model V |
| Community variance (SE) | 0.44 (0.187) | 0.32 (0.177) | 0.40 (0.18) | 0.31 (0.17) | 0.30 (0.16) |
| Intracluster correlation coefficient (%) | 11.70 | 9 | 10 | 8 | 0.70 |
| Proportional change in community variance (%) | Reference | 25.30 | 8 | 29.20 | 35 |
| Median OR (95% CI) | 1.88 (1.27 to 2.34) | 1.72 (1.10 to 2.16) | 1.83 (1.23 to 2.28) | 1.70 (1.16 to 2.14) | 1.40 (1.22 to 2.01) |
| Model fitness | |||||
| Log-likelihood | −732.80 | −701 | −729.20 | −688.09 | −520.12 |
| Deviance (−2×log-likelihood ratio) | 1465.60 | 1402 | 1458.40 | 1376.18 | 1040.24 |
Fixed effects analysis results
In the bivariable mixed-effects logistic regression analysis wealth index, maternal age, number of ANC visits, gestational age, media exposure, mother’s education, maternal BMI, maternal anaemia, sex of infant, iron supplementation, region place of residence, community poverty level, community illiteracy level, community media exposure and community women education were significant at p value <0.2 and fitted for multivariable analysis.
Multivariable multilevel logistic regression analysis was fitted to identify factors associated with LBW. In the final model maternal education, maternal anaemia, gestational age and sex of the neonate were significantly associated with LBW. Therefore, the odds of being LBW baby for neonates who were born from women with no education was nearly two (adjusted OR (AOR)=1.90, 95% CI (1.23 to 2.93)) times higher as compared with those born from women who had secondary and above education. The neonates who were born from women who were severely anaemic had 1.40 (AOR=1.40, 95% CI (1.03 to 2.15)) times higher odds of being LBW babies as compared with those from non-anaemic mothers.
Regarding the duration of pregnancy, the likelihood of being a LBW baby among preterm neonates was nearly six (AOR=5.97, 95% CI (3.26 to 10.95)) times higher as compared with term or post-term neonates. Moreover, the female neonate had 41% (AOR=1.41, 95% CI (1.05 to 1.89)) increased odds of being a LBW baby as compared with male neonates.
Besides, community factors had a moderating effect on the association of individual factors with LBW. The cross-level interaction between community poverty and maternal anaemia was significant. The odds of being LBW baby among neonates born from severely anaemic women was significantly increased by residence in high poverty communities (AOR=2.07, 95% CI:(1.02 to 4.31)) (table 5).
Table 5.
Multilevel logistic regression analysis of factors associated with low birth weight in Ethiopia, Ethiopian Demographic and Health Survey 2016
| Variables | Model I | Model II AOR (95% CI) |
Model III AOR (95% CI) |
Model IV AOR (95% CI) |
Model V AOR (95% CI) |
| Maternal age | |||||
| 15–19 | – | 1.77 (0.82 to 4.74) | – | 1.90 (0.79 to 4.59) | 2.01 (0.83 to 4.86) |
| 20–24 | – | 1.05 (0.52 to 2.12) | – | 1.01 (0.50 to 2.06) | 0.98 (0.48 to 2.01) |
| 25–29 | – | 1.13 (0.57 to 2.21) | – | 1.09 (0.56 to 2.15) | 1.10 (0.56 to 2.17) |
| 30–34 | – | 0.91 (0.45 to 1.81) | – | 0.90 (0.45 to 1.79) | 0.87 (0.43 to 1.76) |
| 35–49 | – | 1 | – | 1 | 1 |
| Maternal educational level | |||||
| No education | 1.91 (1.23 to 2.93) | – | 1.82 (1.12 to 2.96)* | 1.90 (1.23 to 2.93)* | |
| Primary | – | 1.32 (0.91 to 1.92) | – | 1.33 (0.91 to 1.95) | 1.33 (0.91 to 1.93) |
| Secondary and above | – | 1 | – | 1 | 1 |
| Gestational age | |||||
| <37 weeks | – | 5.82 (3.18 to 10.60) | – | 5.91 (3.21 to 10.10)† | 5.97 (3.26 to 10.95)† |
| ≥37 weeks | – | 1 | – | 1 | 1 |
| Iron | |||||
| Yes | – | 1 | – | 1 | 1 |
| No | – | 1.15 (0.84 to 1.57) | – | 1.14 (0.83 to 1.57) | 1.15 (0.84 to 1.58) |
| Number of antenatal care visit | |||||
| <4 visits | – | 1.08 (0.79 to 1.51) | – | 1.11 (0.80 to 1.52) | 1.10 (0.79 to 1.52) |
| ≥4 visits | – | 1 | – | 1 | 1 |
| Media exposure | |||||
| Yes | – | 1 | – | 1 | 1 |
| No | – | 0.89 (0.61 to 1.30) | – | 0.84 (0.55 to 1.29) | 0.89 (0.60 to 1.32) |
| Maternal body mass index | |||||
| Underweight | – | 0.98 (0.62 to 1.42) | – | 0.96 (0.63 to 1.45) | 0.93 (0.61 to 1.42) |
| Normal | 1 | 1 | 1 | ||
| Overweight/obese | 0.88 (0.59 to 1.42) | 0.90 (0.59 to 1.42) | 0.91 (0.58 to 1.39) | ||
| Wealth index | |||||
| Poor | – | 1.16 (0.73 to 1.83) | – | 1.26 (0.674 to 1.438) | 1.30 (0.72 to 2.33) |
| Middle | – | 1.34 (0.80 to 2.25) | – | 1.28 (0.724 to 2.284) | 1.41 (0.81 to 2.45) |
| Rich | – | 1 | – | 1 | 1 |
| Maternal anaemia | |||||
| Not anaemic | – | 1 | – | 1 | 1 |
| Mild | – | 0.64 (0.33 to 1.22) | – | 0.63 (0.33 to 1.22) | 0.53 (0.24 to 1.18) |
| Moderate | – | 1.07 (0.56 to 2.05) | – | 1.09 (0.57 to 2.08) | 1.95 (0.87 to 4.37) |
| Severe | – | 1.48 (1.04 to 2.11) | – | 1.47 (1.04 to 2.01)* | 1.40 (1.03 to 2.15)* |
| Sex of neonate | |||||
| Male | – | 1 | – | 1 | |
| Female | – | 1.37 (1.04 to 1.84) | – | 1.38 (1.04 to 1.84)* | 1.41 (1.05 to 1.89)* |
| Community poverty level | |||||
| Low | – | – | 1 | 1 | 1 |
| High | – | – | 0.93 (0.59 to 1.47) | 0.79 (0.47 to 1.35) | 0.67 (0.37 to 1.23) |
| Community media exposure | |||||
| Low | – | – | 1.34 (0.81 to 2.02) | 1.20 (0.76 to 1.89) | 1.19 (0.75 to 1.89) |
| High | – | – | 1 | 1 | 1 |
| Community women education | |||||
| Low | – | – | 0.79 (0.52 to 1.20) | 0.83 (0.52 to 1.30) | 0.90 (0.59 to 1.35) |
| High | – | – | 1 | 1 | 1 |
| Place of residence | |||||
| Urban | – | – | 1 | 1 | 1 |
| Rural | – | – | 1.09 (0.71 to 1.68) | 1.01 (0.62 to 1.60) | 1.01 (0.63 to 1.63) |
| Community poverty × maternal anaemia |
|||||
| High × not anaemic | – | – | – | 1 | |
| High × mild | – | – | – | 1.70 (0.42 to 6.86) | |
| High × moderate | – | – | – | 0.29 (0.07 to 1.16) | |
| High × severe | – | – | – | 2.07 (1.02 to 4.31)* |
*P value <0.05.
†P value <=0.01.
1, reference category; AOR, adjusted OR.
Discussion
This study revealed that LBW was spatially clustered and affected by sociodemographic and pregnancy-related characteristics of mothers. The spatial scan statistics identified 15 most likely clusters at the eastern part of Amhara and northern border of Benishangul-Gumuz region and 25 secondary clusters in the south Afar, southwest Amhara and the northern part of Oromia region. The possible explanation could be the large disparity in health service access and affordability, especially in those remote areas. There is evidence that health service access is the major challenge in rural health in the countries where the majority of the population lives in rural areas like Ethiopia.29 In addition to coverage, improving the uptake of maternal healthcare services is vital to minimise the adverse outcome of pregnancy. Thus, the socioeconomic inequalities within the society might affect the accessibility of maternal health services as it happens in Ethiopia.30 This might be the possible reason for the clustering of LBW in peripheral areas of the country. Therefore, as Ethiopia moves forward with the sustainable development agenda, these spatial patterns and clusterings of LBW events, provide important information for the development and refinement of geographically based programmes for maternal and child health to reduce LBW occurrence.
Besides, this study found that neonates who were born from severely anaemic mothers had higher odds of being LBW babies as compared with those who were born from non-anaemic mothers. This finding is consistent with studies conducted in India31 32 and Ethiopia.33 34 This might be because anaemia during pregnancy, especially if severe, could affect oxygen supply to the fetus and thus interferes with normal intrauterine growth or pregnancy duration which possibly leads to LBW.35
Similarly, the likelihood of being LBW baby was higher among neonates who were born from women with no formal education as compared with those who were born from educated women. This finding was in agreement with studies conducted in Malawi,36 Bangladesh,19 India18 and northwest Ethiopia.15 This may be since uneducated mothers are relatively at low living standards and they might have poor maternal nutrition during pregnancy. In developing countries, it was found that poor gestational nutrition was found to be a major determinant of intrauterine growth restriction which might result in LBW delivery.35
Regarding the duration of pregnancy, this study revealed that odds of being LBW baby among neonates who were born before 37 weeks of gestation was nearly sixfolds higher as compared with those who were born after 37 weeks of gestation. This result was concordant with studies conducted in Pakistan,37 Kenya,38 northwest Ethiopia39 and southwest16 Ethiopia. The possible explanation might be babies who were delivered in earlier periods of gestation were less likely to have full fetal development. Furthermore, evidence from the systematic review showed that gestational duration was found to be the most proximal cause of LBW.35
Of particular interest of this study is the association of sex of the neonate with LBW. Thus, female neonates had higher odds of being LBW babies as compared with male neonates. This result is in line with the findings in Ghana40 and Nepal.41 The association could be explained by the pathophysiological mechanism in the uterus. The evidence shows that women had a higher risk of developing intrauterine growth restriction than men which probably results in LBW.35
This study was based on the most recent EDHS data with a nationally representative large sample size using a multilevel modelling approach. The sampling weight was applied to produce appropriate SEs and then population level estimate. Despite the above strengths, the study had the following limitations. For some participants, data on birth weight was collected by mothers’ reports by recalling the weight of their child at birth (recall bias) which may overestimate or underestimate the results. Second, since it is secondary data analysis, those behavioural factors such as eating habits, and use of nutritional supplements (vitamin B12 and folic acid) during gestation were not included.
Conclusion
LBW was spatially clustered in Ethiopia. High-risk areas were identified in Afar, Amhara, Oromia, Benishangul-Gumuz and the northern part of SNNP regions. Therefore, targeting the policy interventions in those geographically LBW risk areas and focusing on the improvement of maternal education, strengthening anaemia control programmes and elimination of modifiable causes of prematurity could be vital for reducing the LBW disparity in Ethiopia.
Supplementary Material
Acknowledgments
The authors would like to thank measure DHS for their permission to access the DHS data sets.
Footnotes
Contributors: AML: Wrote the research proposal, conducted the data analysis, interpreted the results and organised the manuscript. AAM and MMS: Involved in designing the study, revising the proposal, guiding the statistical analysis and write up of the manuscript. All authors read and approved the final manuscript.
Funding: The authors have not declared a specific grant for this research from any funding agency in the public, commercial or not-for-profit sectors.
Map disclaimer: The depiction of boundaries on the map(s) in this article does not imply the expression of any opinion whatsoever on the part of BMJ (or any member of its group) concerning the legal status of any country, territory, jurisdiction or area or of its authorities. The map(s) are provided without any warranty of any kind, either express or implied.
Competing interests: None declared.
Patient and public involvement: Patients and/or the public were not involved in the design, or conduct, or reporting, or dissemination plans of this research.
Provenance and peer review: Not commissioned; externally peer reviewed.
Data availability statement
Data are available in a public, open access repository. The data are publicly available upon reasonable request of the DHS MEASURE website through archive@measuredhs.com after being an authorised user.
Ethics statements
Patient consent for publication
Not required.
Ethics approval
Permission for data access was obtained from measure demographic and health survey through online request at http://www.dhsprogram.com. The authorisation letter was also gained from measure DHS. Finally, no information obtained was disclosed to the third body.
References
- 1.Hug L, Sharrow D, You D. Levels & trends in child mortality: report 2017. Estimates developed by the UN Inter-agency Group for Child Mortality Estimation; 2017.
- 2.World Health Organization . Health in 2015: from MDGs, millennium development goals to SDGs, sustainable development goals; 2015.
- 3.World Health Organization . International statistical classification of diseases and related health problems: World Health organization 2004.
- 4.Kramer MS, Barros FC, Demissie K, et al. Does reducing infant mortality depend on preventing low birthweight? An analysis of temporal trends in the Americas. Paediatr Perinat Epidemiol 2005;19:445–51. 10.1111/j.1365-3016.2005.00681.x [DOI] [PubMed] [Google Scholar]
- 5.world health organization . Low birth weight deaths in Ethiopia 2017. Available: https://www.worldlifeexpectancy.com/ethiopia-life-expectancy
- 6.Wardlaw TM. Low birthweight: country, regional and global estimates. UNICEF, 2004. [Google Scholar]
- 7.Jaekel J, Eryigit-Madzwamuse S, Wolke D. Preterm toddlers' inhibitory control abilities predict attention regulation and academic achievement at age 8 years. J Pediatr 2016;169:e1:87–92. 10.1016/j.jpeds.2015.10.029 [DOI] [PubMed] [Google Scholar]
- 8.Hack M, Breslau N, Weissman B, et al. Effect of very low birth weight and subnormal head size on cognitive abilities at school age. N Engl J Med 1991;325:231–7. 10.1056/NEJM199107253250403 [DOI] [PubMed] [Google Scholar]
- 9.Hack M, Flannery DJ, Schluchter M, et al. Outcomes in young adulthood for very-low-birth-weight infants. N Engl J Med Overseas Ed 2002;346:149–57. 10.1056/NEJMoa010856 [DOI] [PubMed] [Google Scholar]
- 10.Blencowe H, Krasevec J, de Onis M, et al. National, regional, and worldwide estimates of low birthweight in 2015, with trends from 2000: a systematic analysis. Lancet Glob Health 2019;7:e849–60. 10.1016/S2214-109X(18)30565-5 [DOI] [PMC free article] [PubMed] [Google Scholar]
- 11.World Health Organization . WHA global nutrition targets 2025: low birth weight policy brief; 2014.
- 12.CSAEaOM . Ethiopia demographic and health survey 2005. Addis Ababa, Ethiopia and Calverton, Maryland, USA: Central Statistical Agency and ORC Macro; 2006. [Google Scholar]
- 13.Central Statistical Agency (CSA) [Ethiopia] and ICF . Ethiopia demographic and health survey 2016: HIV report. Addis Ababa, Ethiopia, and Rockville, Maryland, USA: CSA and ICF; 2016. [Google Scholar]
- 14.Endalamaw A, Engeda EH, Ekubagewargies DT, et al. Low birth weight and its associated factors in Ethiopia: a systematic review and meta-analysis. Ital J Pediatr 2018;44:141. 10.1186/s13052-018-0586-6 [DOI] [PMC free article] [PubMed] [Google Scholar]
- 15.Tafere TE, Afework MF, Yalew AW. Providers adherence to essential contents of antenatal care services increases birth weight in Bahir Dar City administration, North West Ethiopia: a prospective follow up study. Reprod Health 2018;15:163. 10.1186/s12978-018-0610-8 [DOI] [PMC free article] [PubMed] [Google Scholar]
- 16.Tema T. Prevalence and determinants of low birth weight in Jimma zone, Southwest Ethiopia. East Afr Med J 2006;83:366. 10.4314/eamj.v83i7.9448 [DOI] [PubMed] [Google Scholar]
- 17.Gebregzabiherher Y, Haftu A, Weldemariam S, et al. The prevalence and risk factors for low birth weight among term newborns in Adwa General Hospital, Northern Ethiopia. Obstet Gynecol Int 2017;2017:1–7. 10.1155/2017/2149156 [DOI] [PMC free article] [PubMed] [Google Scholar]
- 18.Mandal A. Prevalence of low birth key words: Low-birth weight, prevalence, factors, Howrah 2018.
- 19.Khan JR, Islam MM, Awan N, et al. Analysis of low birth weight and its co-variants in Bangladesh based on a sub-sample from nationally representative survey. BMC Pediatr 2018;18:100. 10.1186/s12887-018-1068-0 [DOI] [PMC free article] [PubMed] [Google Scholar]
- 20.Pfeiffer D, Robinson TP, Stevenson M, et al. Spatial analysis in epidemiology. Oxford: University Press Oxford, 2008. [Google Scholar]
- 21.Zulu LC, Kalipeni E, Johannes E. Analyzing spatial clustering and the spatiotemporal nature and trends of HIV/AIDS prevalence using GIS: the case of Malawi, 1994-2010. BMC Infect Dis 2014;14:285. 10.1186/1471-2334-14-285 [DOI] [PMC free article] [PubMed] [Google Scholar]
- 22.Moran PAP. Notes on continuous stochastic phenomena. Biometrika 1950;37:17–23. 10.1093/biomet/37.1-2.17 [DOI] [PubMed] [Google Scholar]
- 23.Song C, Kulldorff M. Power evaluation of disease clustering tests. Int J Health Geogr 2003;2:9. 10.1186/1476-072X-2-9 [DOI] [PMC free article] [PubMed] [Google Scholar]
- 24.Tiwari N, Adhikari CMS, Tewari A, et al. Investigation of geo-spatial hotspots for the occurrence of tuberculosis in Almora district, India, using GIS and spatial scan statistic. Int J Health Geogr 2006;5:33. 10.1186/1476-072X-5-33 [DOI] [PMC free article] [PubMed] [Google Scholar]
- 25.Naish S, Tong S. Hot spot detection and spatio-temporal dynamics of dengue in Queensland, Australia. ISPRS Technical Commission VIII Symposium; International Society of Photogrammetry and Remote Sensing (ISPRS), 2014. [Google Scholar]
- 26.Kulldorff M. SaTScanTM user guide. Boston; 2006. [Google Scholar]
- 27.Alemu K, Worku A, Berhane Y, et al. Spatiotemporal clusters of malaria cases at village level, Northwest Ethiopia. Malar J 2014;13:223. 10.1186/1475-2875-13-223 [DOI] [PMC free article] [PubMed] [Google Scholar]
- 28.Huang FL. Alternatives to multilevel modeling for the analysis of clustered data. J Exp Educ 2016;84:175–96. 10.1080/00220973.2014.952397 [DOI] [Google Scholar]
- 29.Strasser R. Rural health around the world: challenges and solutions. Fam Pract 2003;20:457–63. 10.1093/fampra/cmg422 [DOI] [PubMed] [Google Scholar]
- 30.Mezmur M, Navaneetham K, Letamo G, et al. Socioeconomic inequalities in the uptake of maternal healthcare services in Ethiopia. BMC Health Serv Res 2017;17:1–11. 10.1186/s12913-017-2298-9 [DOI] [PMC free article] [PubMed] [Google Scholar]
- 31.Ganesh Kumar S, Harsha Kumar HN, Jayaram S, et al. Determinants of low birth weight: a case control study in a district hospital in Karnataka. Indian J Pediatr 2010;77:87–9. 10.1007/s12098-009-0269-9 [DOI] [PubMed] [Google Scholar]
- 32.Patel A, Prakash AA, Das PK, et al. Maternal anemia and underweight as determinants of pregnancy outcomes: cohort study in eastern rural Maharashtra, India. BMJ Open 2018;8:e021623. 10.1136/bmjopen-2018-021623 [DOI] [PMC free article] [PubMed] [Google Scholar]
- 33.Ahmed S, Hassen K, Wakayo T. A health facility based case-control study on determinants of low birth weight in Dassie town, Northeast Ethiopia: the role of nutritional factors. Nutr J 2018;17:103. 10.1186/s12937-018-0409-z [DOI] [PMC free article] [PubMed] [Google Scholar]
- 34.Alemu T, Umeta M. Prevalence and Predictors of "Small Size" Babies in Ethiopia: In-depth Analysis of the Ethiopian Demographic and Health Survey, 2011. Ethiop J Health Sci 2016;26:243–50. 10.4314/ejhs.v26i3.7 [DOI] [PMC free article] [PubMed] [Google Scholar]
- 35.Kramer MS. Determinants of low birth weight: methodological assessment and meta-analysis. Bull World Health Organ 1987;65:663. [PMC free article] [PubMed] [Google Scholar]
- 36.Muula AS, Siziya S, Rudatsikira E. Parity and maternal education are associated with low birth weight in Malawi. Afr Health Sci 2011;11:65–71. [PMC free article] [PubMed] [Google Scholar]
- 37.Badshah S, Mason L, McKelvie K, et al. Risk factors for low birthweight in the public-hospitals at Peshawar, NWFP-Pakistan. BMC Public Health 2008;8:197. 10.1186/1471-2458-8-197 [DOI] [PMC free article] [PubMed] [Google Scholar]
- 38.Nyamasege CK, Kimani-Murage EW, Wanjohi M, et al. Determinants of low birth weight in the context of maternal nutrition education in urban informal settlements, Kenya. J Dev Orig Health Dis 2019;10:1–9. 10.1017/S2040174418000715 [DOI] [PMC free article] [PubMed] [Google Scholar]
- 39.Asmare G, Berhan N, Berhanu M, et al. Determinants of low birth weight among neonates born in Amhara regional state referral hospitals of Ethiopia: unmatched case control study. BMC Res Notes 2018;11:447. 10.1186/s13104-018-3568-2 [DOI] [PMC free article] [PubMed] [Google Scholar]
- 40.Manyeh AK, Kukula V, Odonkor G, et al. Socioeconomic and demographic determinants of birth weight in southern rural Ghana: evidence from Dodowa health and demographic surveillance system. BMC Pregnancy Childbirth 2016;16:160. 10.1186/s12884-016-0956-2 [DOI] [PMC free article] [PubMed] [Google Scholar]
- 41.Acharya D, Singh JK, Kadel R, et al. Maternal factors and utilization of the antenatal care services during pregnancy associated with low birth weight in rural Nepal: analyses of the antenatal care and birth weight records of the MATRI-SUMAN trial. Int J Environ Res Public Health 2018;15. 10.3390/ijerph15112450. [Epub ahead of print: 03 11 2018]. [DOI] [PMC free article] [PubMed] [Google Scholar]
Associated Data
This section collects any data citations, data availability statements, or supplementary materials included in this article.
Supplementary Materials
Data Availability Statement
Data are available in a public, open access repository. The data are publicly available upon reasonable request of the DHS MEASURE website through archive@measuredhs.com after being an authorised user.