

Abstract
Background:
Vitamin D deficiency has been reported to be associated with diabetic microvascular complications, but previous studies have only focused on the relationship between vitamin D and specific complications. Therefore, we aimed to explore the relationship between vitamin D level and diabetic microvascular complications in general, including diabetic retinopathy (DR), diabetic nephropathy (DN), and diabetic peripheral neuropathy (DPN).
Methods:
This was a cross-sectional study of 815 patients with type 2 diabetes mellitus (T2DM). Clinical information and laboratory results were collected from the medical records. The relationship between vitamin D and the three diabetic microvascular complications was investigated.
Results:
The serum 25-hydroxyvitamin D (25 [OH] D) level of patients with DPN and/or DN was significantly lower than that of T2DM patients without any microvascular complications (P < 0.01). Univariate analysis showed that the 25 (OH) D level was related to DPN and DN, but not DR. After adjustment, the 25 (OH) D level was confirmed to be an independent protective factor for DPN (odds ratio [OR]: 0.968, P = 0.004]) and DN (OR: 0.962, P = 0.006). The prevalence of DPN and DN increased significantly as the serum 25 (OH) D levels decreased. Furthermore, patients with both DPN and DN had the lowest concentration of serum 25 (OH) D (P < 0.001), and the prevalence of macroalbuminuria increased more abruptly than that of microalbuminuria across the 25 (OH) D tertiles. Among the patients with vitamin D insufficiency, those with DPN presented more comorbid macroalbuminuria than those without DPN (15.32% vs. 4.91%; P = 0.001).
Conclusions:
Vitamin D deficiency is independently associated with higher risk of DPN and DN, but not DR, in T2DM patients. Further, it may be a potential predictor for both the occurrence and severity of DPN and DN.
Keywords: Type 2 diabetes mellitus, Diabetic retinopathy, Diabetic nephropathy, Diabetic peripheral neuropathy, Vitamin D
Introduction
Diabetes mellitus (DM) is a group of clinical syndromes characterized by glucose metabolism disorders, with the long-term hyperglycemia causing chronic complications in multiple organs. In type 2 diabetes mellitus (T2DM), the main microvascular complications include diabetic retinopathy (DR), diabetic nephropathy (DN), and diabetic peripheral neuropathy (DPN). DR, DN, and DPN all have profound adverse impact on the patients’ quality of life and lead to disability or mortality.[1–4]
Vitamin D, synthesized in the skin or derived from food, is transferred by vitamin D binding protein and activated after two steps: (1) vitamin D is transformed into 25-hydroxyvitamin D (25 [OH] D) with vitamin D-25-hydroxylase. Then, (2) 1,25 (OH)2D is formed by 25 (OH) D-1α-hydroxylase, an enzyme present not only in the tubules of kidney, but also in many cells such as macrophages, adipocytes, and pancreatic β-cells.[5–7] In addition to its role in regulating calcium and phosphorus metabolism, vitamin D was reported to inhibit inflammation and autoimmune response, alleviate insulin resistance, and promote insulin synthesis and secretion.[8] In relation to this, vitamin D deficiency was found to be associated with diabetic microvascular complications.[9–11] However, previous studies have only focused on the relationship between vitamin D and specific diabetic microvascular complications. Therefore, this study aimed to determine the relationship between vitamin D and the overall microvascular complications in T2DM patients.
Methods
Ethics approval
This study was approved by the Human Research and Ethics Committee of our hospital and was conducted according to the tenets of the 1964 Declaration of Helsinki and its later amendments. Written informed consent was obtained from all participants.
Patients
This cross-sectional study evaluated 815 patients with T2DM who were hospitalized in the Department of Endocrinology and Metabolism of our hospital from April 2015 to November 2019. DM was diagnosed according to the 2012 American Diabetes Association criteria.[12] The exclusion criteria were as follows: (1) type 1 DM or special types of diabetes, (2) acute complications of diabetes, (3) liver and renal dysfunction, (4) parathyroid diseases, (5) severe cardiovascular and cerebrovascular diseases, (6) malignant tumors, (7) pregnant or lactating women, (8) cataract, glaucoma, and other eye diseases interfered with fundus photography, and (9) treatment with drugs or nutrition supplements that affected vitamin D metabolism.
Anthropometric and laboratory measurement
Information of sex, age, duration of diabetes, and medication was collected from the medical records with standardized questionnaires. The body mass index (BMI) was calculated as body weight (kg) divided by the square of height (m2). Blood pressure was measured after at least a 10-min rest, with the patient in a sitting position.
Fasting plasma glucose (FPG) levels were measured using the glucose oxidase method (automatic Biochemistry Analyzer, Beckman Coulter, CA, USA). Glycated hemoglobin (HbA1c) was measured via high-pressure liquid chromatography using the Variant™ II machine (Bio-Rad, Hercules, CA, USA). Total cholesterol (TC), triglyceride (TG), high-density lipoprotein cholesterol (HDL-C), low-density lipoprotein-cholesterol, uric acid (UA), blood urea nitrogen (BUN), and serum creatinine (Scr) levels were measured via enzymatic methods using an automatic biochemical analyzer (7600-020, Hitachi Inc., Tokyo, Japan). Cystatin C (Cys C) levels were measured using a highly sensitive latex-enhanced immunoturbidimetric method with an automatic biochemical analyzer (7600-020; Hitachi Inc.). Serum 25 (OH) D concentration was measured using an electrochemiluminescence assay (Roche, Switzerland). Serum 25 (OH) D < 10 ng/mL was categorized as deficiency, 10 ng/mL ≤ 25 (OH) D < 20 ng/mL as insufficiency, and 20 ng/mL ≤ 25 (OH) D as sufficiency.[8]
Evaluation of microvascular complications
DPN was defined as at least two positive findings of sensory symptoms and signs, reflex abnormalities consistent with distal symmetrical polyneuropathy, or abnormal results on nerve conduction tests. An abnormal result was defined as the presence of at least one abnormal nerve attribute (amplitude, latency, F-wave, or nerve conduction velocity) in two or more nerves among the median, peroneal, and sural nerves.[13]
We collected 24-h urine samples three times to measure the albumin excretion rate (AER). DN was defined as an average urinary albumin of ≥30 mg/24 h. Urinary albumin <30 mg/24 h was categorized as normoalbuminuria, 30 mg/24 h ≤ urinary albumin < 300 mg/24 h as microalbuminuria, and urinary albumin ≥300 mg/24 h as macroalbuminuria.[14]
DR was diagnosed based on findings of fundoscopy operated by an ophthalmologist. Either non-proliferative retinopathy or proliferative retinopathy was defined as DR.
Statistical analyses
Data are represented as mean ± standard deviation or median (25th–75th percentiles) for continuous variables and percentages (%) for categorical variables. Between-group differences were analyzed using the Mann-Whitney U test. The Kruskal-Wallis test and analysis of variance were used for three or four groups, and the Chi-squared test was applied for categorical values. The association between microvascular complications and risk factors was evaluated using multiple logistic regression analysis. Figures were created using GraphPad Prism 8.0 (GraphPad Software, Inc., CA, USA). All statistical analyses were performed using SPSS version 25 (SPSS Inc., Chicago, IL, USA). All tests were two-tailed, and P < 0.05 was considered statistically significant.
Results
Patient characteristics
The mean age of the patients was 59.64 ± 13.06 years, and the mean T2DM duration was 11.27 ± 7.93 years. Among the 815 patients, 50 were excluded from the analyses because of missing values. Compared with T2DM patients without microvascular complications, patients with either of the three microvascular complications had significantly higher T2DM duration, systolic blood pressure, BMI, HbA1c, BUN, and Cys C. DN patients had higher diastolic blood pressure (DBP), FPG, fasting plasma C-peptide, TC, TG, UA, and Scr and lower HDL-C. Meanwhile, DR patients showed higher DBP, TG, and UA levels. Importantly, patients with DPN or DN exhibited lower 25 (OH) D levels (both P < 0.01) [Table 1]. However, the 25 (OH) D levels of DR group were similar to that of the group without microvascular complications (P = 0.329).
Table 1.
Characteristics of patients with T2DM complications in different groups.
| Characteristics | Control group(n = 314) | DPN group(n = 299) | DN group(n = 223) | DR group(n = 235) | P |
| Age (years) | 59 (53–67) | 63 (56–72)† | 60 (51–68) | 61 (55–68)∗ | <0.001 |
| Sex (M/F) | 189/111 | 137/133† | 124/85∗ | 120/89∗ | 0.029 |
| DM duration (years) | 7.00 (2.00–12.00) | 10.00 (6.00–17.00)† | 10.50 (6.00–15.00)† | 12.00 (6.75–17.00)† | <0.001 |
| SBP (mmHg) | 127.19 ± 15.24 | 133.07 ± 16.67† | 137.12 ± 17.54† | 134.84 ± 16.77† | <0.001 |
| DBP (mmHg) | 78.34 ± 9.19 | 78.71 ± 9.56 | 80.82 ± 9.94† | 79.85 ± 9.58∗ | 0.024 |
| BMI (kg/m2) | 24.39 ± 3.36 | 25.11 ± 3.55∗ | 26.43 ± 3.60† | 25.47 ± 3.37† | <0.001 |
| FPG (mmol/L) | 7.64 ± 2.39 | 8.01 ± 2.89 | 8.48 ± 3.11† | 8.01 ± 2.86 | 0.053 |
| HbA1c (%) | 8.52 ± 2.17 | 9.11 ± 2.31† | 9.22 ± 2.25† | 8.98 ± 2.19† | <0.001 |
| FCP (ng/mL) | 1.91 ± 1.09 | 1.91 ± 1.17 | 2.20 ± 1.24† | 1.93 ± 1.16 | 0.029 |
| TC (mmol/L) | 4.66 ± 1.15 | 4.81 ± 1.20 | 4.93 ± 1.28∗ | 4.85 ± 1.13 | 0.168 |
| TG (mmol/L) | 1.89 ± 2.12 | 1.95 ± 1.84 | 2.51 ± 2.11† | 2.08 ± 1.74∗ | <0.001 |
| HDL-C (mmol/L) | 1.07 ± 0.33 | 1.07 ± 0.29 | 0.99 ± 0.26† | 1.06 ± 0.26 | 0.003 |
| LDL-C (mmol/L) | 2.71 ± 0.91 | 2.74 ± 0.89 | 2.69 ± 0.86 | 2.71 ± 0.85 | 0.850 |
| UA (μmol/L) | 313.00 (266.50–365.50) | 317.00 (262.00–365.00) | 342.00 (274.00–426.00)† | 335.50 (273.50–389.25)∗ | 0.008 |
| BUN (mmol/L) | 5.31 ± 1.56 | 5.98 ± 2.09† | 6.65 ± 3.08† | 6.21 ± 2.71† | <0.001 |
| Scr (μmol/L) | 67.23 ± 18.01 | 71.24 ± 21.71 | 79.10 ± 42.24† | 73.14 ± 37.26 | 0.016 |
| Cys C (mg/L) | 1.10 ± 0.33 | 1.25 ± 0.38† | 1.38 ± 0.56† | 1.26 ± 0.48† | <0.001 |
| 25 (OH) D (ng/mL) | 16.23 ± 7.10 | 14.61 ± 7.36† | 13.78 ± 6.83† | 16.38 ± 9.16 | <0.001 |
Data are expressed as n, mean ± standard deviation or median (25th–75th percentiles). Compared with the control group, ∗P < 0.05, †P < 0.01. T2DM: Type 2 diabetes mellitus; DPN: Diabetic peripheral neuropathy; DN: Diabetic nephropathy; DR: Diabetic retinopathy; M: Male; F: Female; DM: Diabetes mellitus; SBP: Systolic blood pressure; DBP: Diastolic blood pressure; BMI: Body mass index; FPG: Fasting plasma glucose; HbA1c: Glycated hemoglobin; FCP: Fasting plasma C-peptide; TC: Total cholesterol; TG: Triglyceride; HDL-C: High-density lipoprotein cholesterol; LDL-C: Low-density lipoprotein cholesterol; UA: Uric acid; BUN: Blood urea nitrogen; Scr: Serum creatinine; Cys C: Cystatin C; 25 (OH) D: 25-hydroxyvitamin D.
Association between 25 (OH) D and the three diabetic microvascular complications
The patients were divided into vitamin D deficiency (n = 178), insufficiency (n = 392), and sufficiency (n = 195) groups according to their 25 (OH) D values. The prevalence of DPN and DN significantly increased as the vitamin D level decreased (P < 0.01). However, there was no significant difference in the prevalence of DR among the three groups (P = 0.173) [Table 2].
Table 2.
Characteristics of the three groups of patients according to 25 (OH) D levels.
| Characteristics | Deficiency(n = 178) | Insufficiency(n = 392) | Sufficiency(n = 195) | P |
| Age (years) | 60.66 ± 12.35 | 58.55 ± 13.18 | 59.22 ± 12.38 | 0.223 |
| Sex (M/F) | 85/93 | 224/168 | 144/51 | <0.010 |
| DM duration (years) | 10.18 ± 7.02 | 11.05 ± 8.26 | 12.37 ± 7.48† | 0.011 |
| SBP (mmHg) | 132.75 ± 17.81 | 131.45 ± 16.29 | 129.16 ± 15.11 | 0.212 |
| DBP (mmHg) | 78.69 ± 9.43 | 79.47 ± 9.38 | 78.32 ± 9.54 | 0.178 |
| BMI (kg/m2) | 25.65 ± 3.66 | 25.14 ± 3.64 | 24.25 ± 3.06† | <0.001 |
| FPG (mmol/L) | 7.93 ± 2.74 | 8.18 ± 2.82 | 7.20 ± 2.22∗ | <0.001 |
| HbA1c (%) | 8.76 ± 2.03 | 9.03 ± 2.33 | 8.26 ± 1.92† | <0.001 |
| FCP (ng/mL) | 2.11 ± 1.14 | 1.96 ± 1.20 | 1.92 ± 1.12 | 0.124 |
| TC (mmol/L) | 4.80 ± 1.30 | 4.81 ± 1.16 | 4.58 ± 1.02 | 0.064 |
| TG (mmol/L) | 1.98 ± 1.76 | 2.19 ± 2.32 | 1.70 ± 1.30 | 0.106 |
| HDL-C (mmol/L) | 1.07 ± 0.29 | 1.05 ± 0.32 | 1.06 ± 0.27 | 0.478 |
| LDL-C (mmol/L) | 2.72 ± 0.94 | 2.72 ± 0.87 | 2.65 ± 0.82 | 0.653 |
| UA (μmol/L) | 330.09 ± 94.47 | 318.97 ± 87.93 | 327.93 ± 87.89 | 0.290 |
| BUN (mmol/L) | 5.72 ± 2.36 | 5.80 ± 2.36 | 5.73 ± 1.50 | 0.227 |
| Scr (μmol/L) | 71.63 ± 29.99 | 69.68 ± 29.03 | 70.40 ± 19.05 | 0.504 |
| Cys C (mg/L) | 1.21 ± 0.46 | 1.18 ± 0.39 | 1.16 ± 0.33 | 0.972 |
| 25 (OH) D (ng/mL) | 7.30 ± 1.95 | 14.34 ± 2.83† | 26.38 ± 6.08† | <0.001 |
| DPN (%) | 83 (46.63) | 125 (31.89) | 62 (31.80) | <0.010 |
| DN (%) | 68 (38.20) | 111 (28.32) | 30 (15.39) | <0.010 |
| DR (%) | 57 (32.02) | 102 (26.02) | 63 (32.31) | 0.173 |
Continuous variables are expressed as the mean ± standard deviation, whereas categorical variables are expressed as n or n (%). Compared with the deficiency group, ∗P < 0.05, †P < 0.01. Deficiency: 25 (OH) D <10 ng/mL; Insufficiency: 10 ≤ 25 (OH) D <20 ng/mL; Sufficiency: 25 (OH) D ≥20 ng/mL. 25 (OH) D: 25-hydroxyvitamin; Male; F: Female; DM: Diabetes mellitus; SBP: Systolic blood pressure; DBP: Diastolic blood pressure; BMI: Body mass index; FPG: Fasting plasma glucose; HbA1c: Glycated hemoglobin; FCP: Fasting plasma C-peptide; TC: Total cholesterol; TG: Triglyceride; HDL-C: High-density lipoprotein cholesterol; LDL-C: Low-density lipoprotein-cholesterol; UA: Uric acid; BUN: Blood urea nitrogen; Scr: Serum creatinine; Cys C: Cystatin C; DPN: Diabetic peripheral neuropathy; DN: Diabetic nephropathy; DR: Diabetic retinopathy.
Multiple logistic regression was applied to analyze the relationship between clinical variables. Univariate analysis showed that the 25 (OH) D was significantly correlated with DPN (odds ratio [OR]: 0.969, 95% confidence interval [CI]: 0.950–0.989, P = 0.003) and DN (OR: 0.950, 95% CI: 0.928–0.973, P < 0.001), but not with DR (OR: 1.014, 95% CI: 0.994–1.034, P = 0.165). Multiple logistic regression analysis after adjustment showed that the 25 (OH) D level was an independent protective factor for DPN and DN [Table 3].
Table 3.
Multiple logistic regression of variables associated with different diabetic microvascular complications.
| Risk factors | Odds ratio | 95% CI | P |
| DPN | |||
| Age | 1.028 | 1.013–1.043 | <0.001 |
| HbA1c | 1.122 | 1.043–1.207 | 0.002 |
| DM duration | 1.037 | 1.013–1.061 | 0.036 |
| 25 (OH) D | 0.968 | 0.947–0.990 | 0.004 |
| DN | |||
| BMI | 1.170 | 1.101–1.243 | <0.001 |
| BUN | 1.384 | 1.147–1.671 | 0.001 |
| 25 (OH) D | 0.962 | 0.936–0.989 | 0.006 |
| DM duration | 1.049 | 1.022–1.077 | <0.001 |
| SBP | 1.025 | 1.011–1.040 | 0.001 |
| HbA1c | 1.177 | 1.057–1.311 | 0.003 |
| HDL-C | 0.368 | 0.160–0.846 | 0.019 |
| DR | |||
| SBP | 1.018 | 1.004–1.031 | 0.010 |
| DM duration | 1.062 | 1.029–1.096 | <0.001 |
Variables with P < 0.05 in multiple model are shown in the table. Significant variables (P < 0.05) in the univariate analysis were included in the multivariate model. DPN: sex, age, DM duration, SBP, HbA1c, and 25 (OH) D; DN: BMI, SBP, DBP, DM duration, FPG, HbA1c, FCP, TC, TG, HDL-C, BUN, Scr, and 25 (OH) D; DR: BMI, DM duration, SBP, BUN, Cys C, and UA. CI: Confidence interval; DPN: Diabetic peripheral neuropathy; HbA1c: Glycated hemoglobin; DM: Diabetes mellitus; 25 (OH) D: 25-Hydroxyvitamin D; DN: Diabetic nephropathy; BMI: Body mass index; BUN: Blood urea nitrogen; SBP: Systolic blood pressure; HDL-C: High-density lipoprotein cholesterol; DR: Diabetic retinopathy; DBP: Diastolic blood pressure; FPG: Fasting plasma glucose; FCP: Fasting plasma C-peptide; TC: Total cholesterol; TG: Triglyceride; UA: Uric acid; Scr: Serum creatinine; Cys C: Cystatin C.
Association between 25 (OH) D and DPN complicating DN
Compared with T2DM patients without DPN or DN, patients with DN in the absence or presence of DPN had significantly lower 25 (OH) D levels [Figure 1A]. In the vitamin D sufficiency group, 10.26% of patients had DN alone, but this markedly increased to 17.53% in the vitamin D insufficiency group. For DPN complicating DN, the prevalence of 5.13% in the vitamin D sufficiency markedly increased to 20.22% in the vitamin D deficiency group [Figure 1B].
Figure 1.
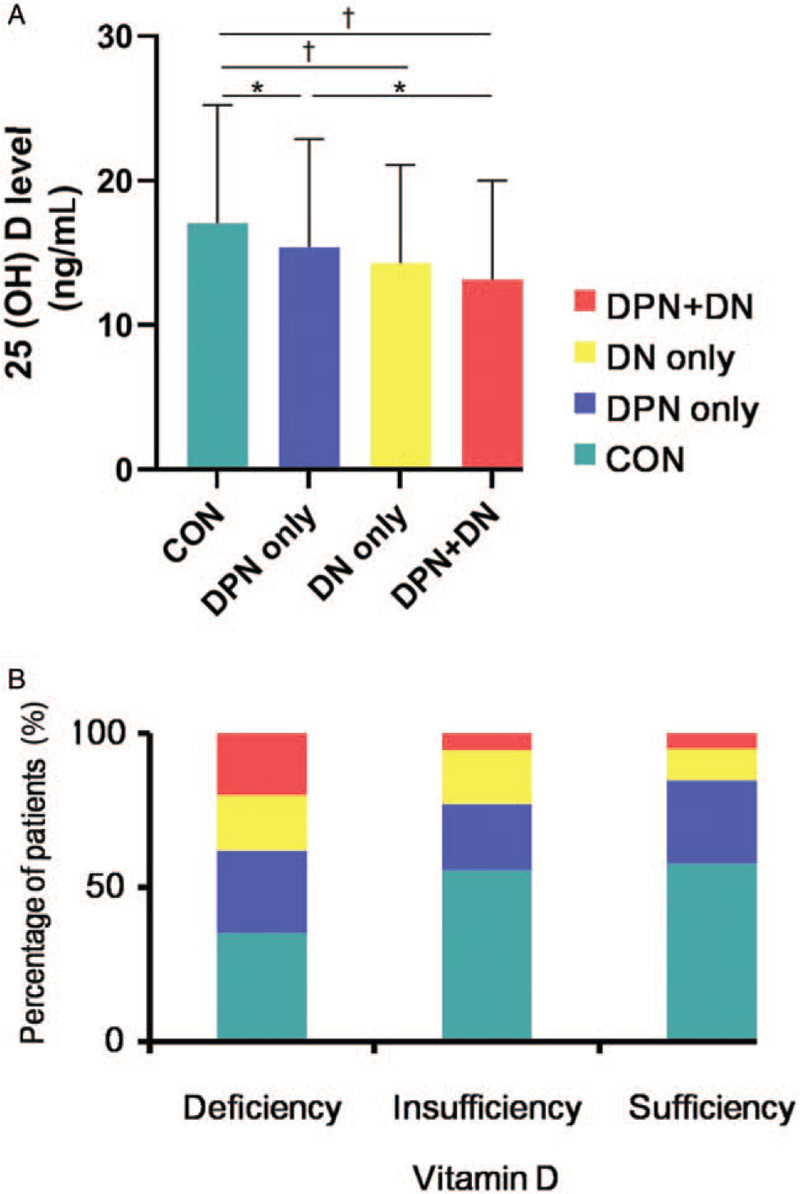
(A) Serum 25 (OH) D concentrations of patients in the control, DPN only, DN only, and DPN complicating DN groups. (B) The percentage of patients with DPN only, DN only, and DPN complicating DN among different 25 (OH) D levels. ∗P < 0.05, †P < 0.01. 25 (OH) D: 25-Hydroxyvitamin D; DPN: Diabetic peripheral neuropathy; DN: Diabetic nephropathy.
Patients with normoalbuminuria had higher 25 (OH) D levels than those with microalbuminuria and macroalbuminuria [Figure 2]. The prevalence of macroalbuminuria increased rapidly as the vitamin D level decreased: 1.54%, 8.23%, and 15.73% in the vitamin D sufficiency, insufficiency, and deficiency groups, respectively. The prevalence of microalbuminuria also gradually increased in the above three groups (13.92%, 20.31%, and 22.47%, respectively). In addition, in the vitamin D insufficiency and deficiency groups, although the 25 (OH) D levels were similar in patients with and without DPN, the albumin excretion rate level of DPN patients was markedly higher. In the vitamin D insufficiency group, the prevalence of macroalbuminuria in patients with DPN was significantly higher than those without DPN [Table 4].
Figure 2.
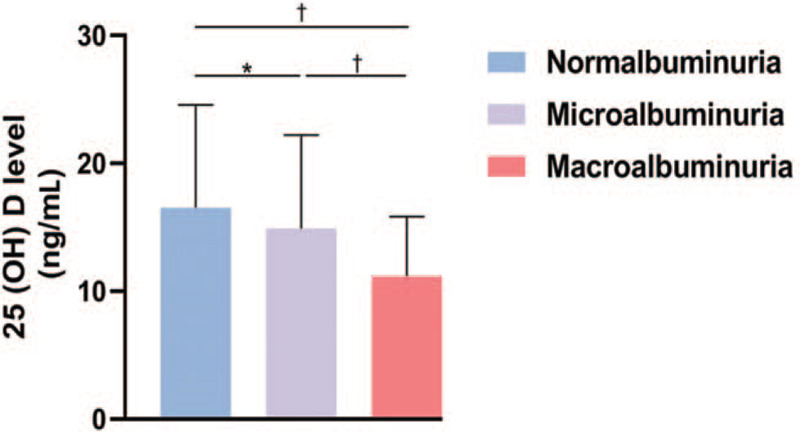
Serum 25-hydroxyvitamin D concentrations of patients with different albuminuria levels. ∗P < 0.05, †P < 0.01.
Table 4.
Comparison of patients in the different 25 (OH) D levels with/without DPN.
| Deficiency | Insufficiency | Sufficiency | |||||||
| Characteristics | w/o DPN (n = 95) | w/ DPN (n = 83) | P | w/o DPN (n = 265) | w/ DPN (n = 127) | P | w/o DPN (n = 132) | w/ DPN (n = 62) | P |
| 25 (OH) D (ng/mL) | 7.47 ± 1.88 | 7.11 ± 2.02 | 0.252 | 14.38 ± 2.81 | 26.84 ± 6.60 | 0.562 | 14.24 ± 2.90 | 25.39 ± 4.66 | 0.208 |
| AER (mg/24 h) | 12.41 (6.17–54.36) | 19.50 (8.37–190.84) | 0.037 | 10.80 (6.68–27.05) | 19.675 (7.98–96.15) | 0.002 | 10.50 (6.89–17.61) | 10.5 (6.41–20.48) | 0.981 |
| Normalbuminuria | 63 (66.32) | 47 (56.63) | 0.413 | 201 (75.85) | 80 (62.90) | 0.001 | 112 (84.85) | 52 (83.87) | 0.269 |
| Microalbuminuria | 19 (20.00) | 21 (25.30) | 51 (19.25) | 28 (21.78) | 17 (12.88) | 10 (16.13) | |||
| Macroalbuminuria | 13 (13.68) | 15 (18.07) | 13 (4.90) | 19 (15.32) | 3 (2.27) | 0 | |||
Continuous variables are expressed as the mean ± standard deviation or median (25th–75th percentiles), whereas categorical variables are expressed as n (%). 25 (OH) D: 25-Hydroxyvitamin D; DPN: Diabetic peripheral neuropathy; AER: Albumin excretion rate; w/o: Without; w/: With.
Discussion
Previous studies on the association between diabetic microvascular complications and vitamin D levels have only focused on specific diabetic microvascular complications. In this study, we explored the relationship between vitamin D and microvascular complications in general including DPN, DN, and DR in the Chinese population. The results showed that the prevalence and severity of DN and DPN were associated with vitamin D levels. However, there was no association between vitamin D level and DR, despite the strong relationship between vitamin D and DN or DPN.
The relationship between vitamin D and DR has been controversial in previous studies. The current study showed that there was no significant difference in 25 (OH) D levels between T2DM patients without microvascular complications and those with DR. Further, there was no significant difference in the prevalence of DR according to the different vitamin D levels. Moreover, univariate analysis indicated that vitamin D was not correlated with DR. A meta-analysis of 15 observational studies found that vitamin D deficiency was associated with a higher risk of DR.[15] However, other studies reported contrasting findings.[16–18]
It is noteworthy that the above studies only focused on DR. In this study, we simultaneously observed the relationship between three diabetic microvascular complications and vitamin D. The results showed that although DPN and DN were significantly correlated to the vitamin D level, there was no association for DR. Because the vitamin D levels were relatively low in all patient groups in the current study, we speculated that although the vitamin D receptor is expressed in retinal vascular endothelial cells,[19] it had little effect on retinopathy at low levels of 25 (OH) D. Further studies on higher 25 (OH) D levels are necessary to explore the relationship between vitamin D and DR.
In this study, the 25 (OH) D levels were lower in patients with DPN, and multiple logistic regression confirmed that vitamin D was an independent protective factor for DPN. Previous studies have found that vitamin D plays an important role in the development of DPN, and vitamin D deficiency can be used as a predictor of DPN.[20–22]In vitro experiments also indicated the role of vitamin D in DPN. Zhou et al found that 1,25 (OH)2D3 stimulated the secretion of nerve growth factor (NGF) in rat RSC96 cells. When 1,25 (OH)2D3 was converted into an inactive product, NGF secretion decreased.[23] Another animal experiment also showed that the vitamin D derivative CB1093 effectively induced endogenous NGF expression.[24] However, previous studies have paid little attention to the dose-effect relationship between vitamin D and DPN. We found that the prevalence of DPN was similar between the vitamin D insufficiency and sufficiency groups (31.89% vs. 31.80%). However, the prevalence of DPN increased to 46.63% in the vitamin D deficiency group. Collectively, these findings indicated that the risk of DPN did not increase when the 25 (OH) D level was higher than 10 ng/mL, even if the vitamin D level was insufficient. Vitamin D had a more significant effect on DPN in patients with vitamin D deficiency. In the clinical setting, T2DM patients with vitamin D deficiency should be informed of the possibility of DPN.
We observed that the vitamin D level of patients with DN was lower than that of patients without microvascular complications. The prevalence of DN increased when vitamin D levels decreased. Multiple logistic regression revealed that vitamin D was an independent protective factor for DN, consistent with previous studies that reported that vitamin D was correlated with DN.[25–27] Vitamin D and its analogs may have potential as an adjuvant therapy for reducing albuminuria and slowing DN progression.[28] We found that low vitamin D levels directly indicated a higher risk of DN. The patterns of relationship between vitamin D level and macroalbuminuria differed from those between vitamin D level and microalbuminuria.
We also explored the influence of vitamin D on the comorbidity of DPN and DN, and to our best knowledge, this is a rare study to evaluate such influence. We found that patients with DPN complicating DN had lower 25 (OH) D levels than patients with DPN or DN alone. In the vitamin D deficiency group, 20.22% of patients had both complications, and this prevalence was four times higher than that in the vitamin D insufficiency or sufficiency group. Vitamin D deficiency was closely associated with the occurrence of multiple complications. In the absence of DPN, the morbidity rate of macroalbuminuria increased 1.16-fold in the vitamin D insufficiency group and 5.03-fold in the vitamin D deficiency group compared to that in the vitamin D sufficiency group. However, in the presence of DPN, the peak of macroalbuminuria increased, with the prevalence increased to 15% in the insufficiency group, whereas there was no further increase in the deficiency group. This indicated that decreased vitamin D levels increased the risk of multiple complications. Nevertheless, the relationship between vitamin D, DN, and DPN as well as the pathogenesis involved needs further investigation.
The present study had some limitations. This was a cross-sectional study, and thus prospective studies are needed to confirm whether vitamin D levels in T2DM patients can predict the occurrence of DN and DPN. In addition, large-scale randomized double-blind clinical trials are needed to clarify whether vitamin D supplementation can prevent DN and DPN in patients with T2DM.
In conclusion, vitamin D was an independent protective factor for DN and DPN, but not for DR. The prevalence of macroalbuminuria increased sharply as the level of vitamin D decreased, while that of microalbuminuria increased gradually. Decreased vitamin D levels increased the risk of multiple complications.
Acknowledgements
The authors would like to thank all of the involved clinicians, nurses, and technicians for dedicating their time and skills to this study.
Funding
This work was supported by grants from the Shanghai Municipal Education Commission, Gaofeng Clinical Medicine Grant Support (No. 20172025), the National Natural Science Foundation of China (No. 81670790), Peak Discipline Project of Xuhui District, Shanghai (No. SHXH201712), and Shanghai Municipal Key Clinical Specialty. The funders had no role in study design, data collection and analysis, decision to publish, or preparation of the manuscript.
Conflicts of interest
None.
Footnotes
How to cite this article: Zhao WJ, Xia XY, Yin J. Relationship of serum vitamin D levels with diabetic microvascular complications in patients with type 2 diabetes mellitus. Chin Med J 2021;134:814–820. doi: 10.1097/CM9.0000000000001364
Wei-Jing Zhao and Xin-Yi Xia contributed equally to this work.
References
- 1.Li JC, Tian J, Wu SL, Wang ZJ, Zhang XF, Jia D, et al. Effect of long-term systolic blood pressure trajectory on kidney damage in the diabetic population: a prospective study in a community-based Chinese cohort. Chin Med J 2018; 131:1199–1205. doi: 10.4103/0366-6999.231528. [DOI] [PMC free article] [PubMed] [Google Scholar]
- 2.Song P, Yu J, Chan KY, Theodoratou E, Rudan I. Prevalence, risk factors and burden of diabetic retinopathy in China: a systematic review and meta-analysis. J Glob Health 2018; 8:010803.doi: 10.7189/jogh.08.010803. [DOI] [PMC free article] [PubMed] [Google Scholar]
- 3.Machingura PI, Chikwasha V, Okwanga PN, Gomo E. Prevalence of and factors associated with nephropathy in diabetic patients attending an outpatient clinic in Harare, Zimbabwe. Am J Trop Med Hyg 2017; 96:477–482. doi: 10.4269/ajtmh.15-0827. [DOI] [PMC free article] [PubMed] [Google Scholar]
- 4.Liu XM, Wang Q, Dong ZY, Zhang WG, Cai GY, Zhang L, et al. Clinicopathological features of nondiabetic renal diseases from different age groups: an observational cross-sectional study. Chin Med J 2018; 131:2953–2959. doi: 10.4103/0366-6999.247197. [DOI] [PMC free article] [PubMed] [Google Scholar]
- 5.Gil Á, Plaza-Diaz J, Mesa MD. Vitamin D: classic and novel actions. Ann Nutr Metab 2018; 72:87–95. doi: 10.1159/000486536. [DOI] [PubMed] [Google Scholar]
- 6.Wang HY, She GT, Sun LZ, Lu H, Wang YP, Miao J, et al. Correlation of serum vitamin D, adipose tissue vitamin D receptor, and peroxisome proliferator-activated receptor γ in women with gestational diabetes mellitus. Chin Med J 2019; 132:2612–2620. doi: 10.1097/CM9.0000000000000480. [DOI] [PMC free article] [PubMed] [Google Scholar]
- 7.Szymczak-Pajor I, Śliwińska A. Analysis of association between vitamin D deficiency and insulin resistance. Nutrients 2019; 11:794.doi: 10.3390/nu11040794. [DOI] [PMC free article] [PubMed] [Google Scholar]
- 8.Rasheed MA, Kantoush N, Abd El-Ghaffar N, Farouk H, Kamel S, Ibrahim AA, et al. Expression of JAZF1, ABCC8, KCNJ11and Notch2 genes and vitamin D receptor polymorphisms in type 2 diabetes, and their association with microvascular complications. Ther Adv Endocrinol Metab 2017; 8:97–108. doi: 10.1177/2042018817708910. [DOI] [PMC free article] [PubMed] [Google Scholar]
- 9.Xiao X, Wang Y, Hou Y, Han F, Ren J, Hu Z. Vitamin D deficiency and related risk factors in patients with diabetic nephropathy. J Int Med Res 2016; 44:673–684. doi: 10.1177/0300060515593765. [DOI] [PMC free article] [PubMed] [Google Scholar]
- 10.Zhang J, Upala S, Sanguankeo A. Relationship between vitamin D deficiency and diabetic retinopathy: a meta-analysis. Can J Ophthalmol 2017; 52: Suppl 1: S39–S44. doi: 10.1016/j.jcjo.2017.09.026. [DOI] [PubMed] [Google Scholar]
- 11.Soderstrom LH, Johnson SP, Diaz VA, Mainous AG, 3rd. Association between vitamin D and diabetic neuropathy in a nationally representative sample: results from 2001-2004 NHANES. Diabet Med 2012; 29:50–55. doi: 10.1111/j.1464-5491.2011.03379.x. [DOI] [PMC free article] [PubMed] [Google Scholar]
- 12.American Diabetes Association. Standards of medical care in diabetes--2012. Diabetes Care 2012; 35: Suppl 1: S11–S63. doi: 10.2337/dc12-s011. [DOI] [PMC free article] [PubMed] [Google Scholar]
- 13.Zhao W, Zeng H, Zhang X, Liu F, Pan J, Zhao J, et al. A high thyroid stimulating hormone level is associated with diabetic peripheral neuropathy in type 2 diabetes patients. Diabetes Res Clin Pract 2016; 115:122–129. doi: 10.1016/j.diabres.2016.01.018. [DOI] [PubMed] [Google Scholar]
- 14.Diabetic Kidney Disease Cooperative Group of Peking University Health Science Center. Expert consensus on the diagnosis and management of diabetic kidney disease. Chin Med J 2020; 133:2333–2334. doi: 10.1097/CM9.0000000000001049. [DOI] [PMC free article] [PubMed] [Google Scholar]
- 15.Luo BA, Gao F, Qin LL. The association between vitamin D deficiency and diabetic retinopathy in type 2 diabetes: a meta-analysis of observational studies. Nutrients 2017; 9:307.doi: 10.3390/nu9030307. [DOI] [PMC free article] [PubMed] [Google Scholar]
- 16.Alam U, Amjad Y, Chan AW, Asghar O, Petropoulos IN, Malik RA. Vitamin D deficiency is not associated with diabetic retinopathy or maculopathy. J Diabetes Res 2016; 2016:6156217.doi: 10.1155/2016/6156217. [DOI] [PMC free article] [PubMed] [Google Scholar]
- 17.Engelen L, Schalkwijk CG, Eussen SJ, Scheijen JL, Soedamah-Muthu SS, Chaturvedi N, et al. Low 25-hydroxyvitamin D2 and 25-hydroxyvitamin D3 levels are independently associated with macroalbuminuria, but not with retinopathy and macrovascular disease in type 1 diabetes: the EURODIAB prospective complications study. Cardiovasc Diabetol 2015; 14:67.doi: 10.1186/s12933-015-0231-2. [DOI] [PMC free article] [PubMed] [Google Scholar]
- 18.Patrick PA, Visintainer PF, Shi Q, Weiss IA, Brand DA. Vitamin D and retinopathy in adults with diabetes mellitus. Arch Ophthalmol 2012; 130:756–760. doi: 10.1001/archophthalmol.2011.2749. [DOI] [PubMed] [Google Scholar]
- 19.Swamy N, Chen TC, Peleg S, Dhawan P, Christakos S, Stewart LV, et al. Inhibition of proliferation and induction of apoptosis by 25-hydroxyvitamin D3-3beta-(2)-bromoacetate, a nontoxic and vitamin D receptor-alkylating analog of 25-hydroxyvitamin D3 in prostate cancer cells. Clin Cancer Res 2004; 10:8018–8027. doi: 10.1158/1078-0432.CCR-04-0881. [DOI] [PubMed] [Google Scholar]
- 20.Lv WS, Zhao WJ, Gong SL, Fang DD, Wang B, Fu ZJ, et al. Serum 25-hydroxyvitamin D levels and peripheral neuropathy in patients with type 2 diabetes: a systematic review and meta-analysis. J Endocrinol Invest 2015; 38:513–518. doi: 10.1007/s40618-014-0210-6. [DOI] [PubMed] [Google Scholar]
- 21.He R, Hu Y, Zeng H, Zhao J, Zhao J, Chai Y, et al. Vitamin D deficiency increases the risk of peripheral neuropathy in Chinese patients with type 2 diabetes. Diabetes Metab Res Rev 2017; 33:e2820.doi: 10.1002/dmrr.2820. [DOI] [PubMed] [Google Scholar]
- 22.Niu Y, Li J, Peng R, Zhao X, Wu J, Tang Q. Low vitamin D is associated with diabetes peripheral neuropathy in older but not in young and middle-aged patients. Diabetes Metab Res Rev 2019; 35:e3162.doi: 10.1002/dmrr.3162. [DOI] [PubMed] [Google Scholar]
- 23.Zhou YK, Liang Z, Guo Y, Zhang HT, Wang KH. High glucose upregulates CYP24A1 expression which attenuates the ability of 1,25 (OH)2D3 to increase NGF secretion in a rat Schwann cell line RSC96. Mol Cell Endocrinol 2015; 404:75–81. doi: 10.1016/j.mce.2015.01.005. [DOI] [PubMed] [Google Scholar]
- 24.Tiaka EK, Papanas N, Manolakis AC, Maltezos E. The role of nerve growth factor in the prophylaxis and treatment of diabetic foot ulcers. Int J Burns Trauma 2011; 1:68–76. [PMC free article] [PubMed] [Google Scholar]
- 25.Senyigit A. The association between 25-hydroxy vitamin D deficiency and diabetic complications in patients with type 2 diabetes mellitus. Diabetes Metab Syndr 2019; 13:1381–1386. doi: 10.1016/j.dsx.2019.01.043. [DOI] [PubMed] [Google Scholar]
- 26.Ucak S, Sevim E, Ersoy D, Sivritepe R, Basat O, Atay S. Evaluation of the relationship between microalbuminuria and 25-(OH) vitamin D levels in patients with type 2 diabetes mellitus. Aging Male 2019; 22:116–120. doi: 10.1080/13685538.2018.1479385. [DOI] [PubMed] [Google Scholar]
- 27.Derakhshanian H, Shab-Bidar S, Speakman JR, Nadimi H, Djafarian K. Vitamin D and diabetic nephropathy: a systematic review and meta-analysis. Nutrition 2015; 31:1189–1194. doi: 10.1016/j.nut.2015.04.009. [DOI] [PubMed] [Google Scholar]
- 28.Gupta S, Goyal P, Feinn RS, Mattana J. Role of vitamin D and its analogues in diabetic nephropathy: a meta-analysis. Am J Med Sci 2019; 357:223–229. doi: 10.1016/j.amjms.2018.12.005. [DOI] [PubMed] [Google Scholar]