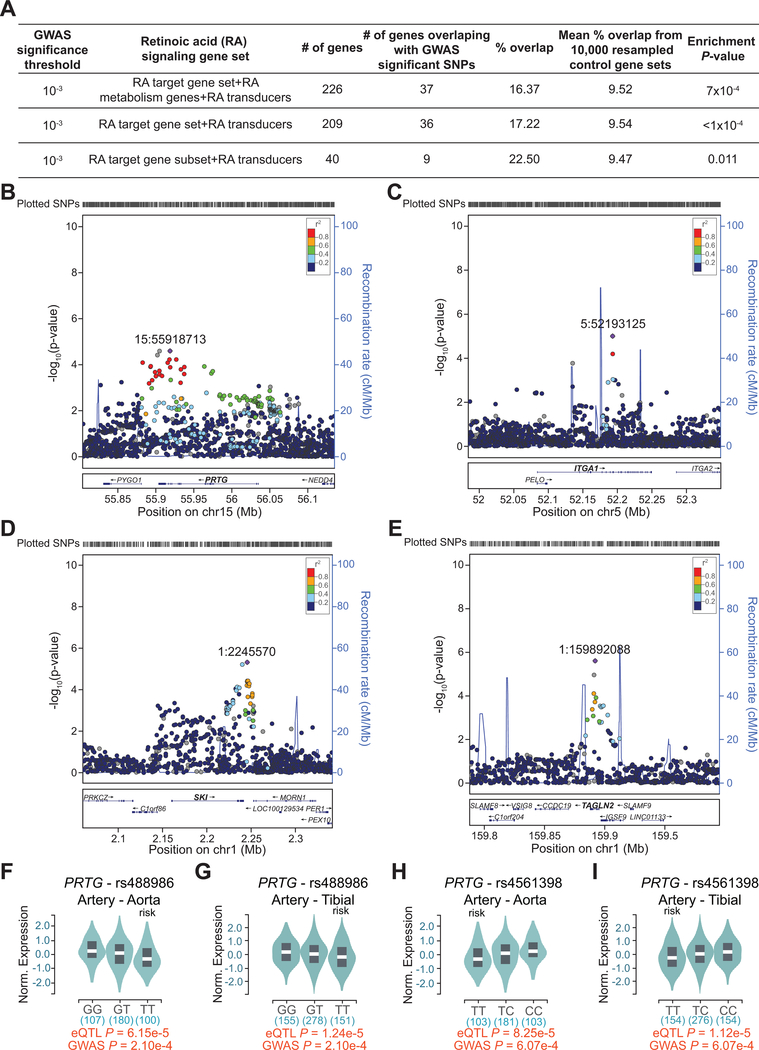
Figure 5. Multiple RA signaling target gene loci are associated with risk of human CAD.
A, CAD GWAS enrichment summary based on a set of 226 RA signaling genes and its subsets. B-E, Regional association plots showing 1000-Genomes based GWAS of CAD/MI in four of RA signaling target gene loci, PRTG (B), ITGA1 (C), SKI (D) and TAGLN2 (E). −log10(p-value) of SNP association for CAD/MI is shown for each plot. Linkage disequilibrium (LD) with the top SNP from each region is color coded by r2. F-I, eQTL data from GTEx for SNPs, rs488986 (F and G) and rs4561398 (H and I), localized within the PRTG locus. Representative violin plots showing normalized expression of PRTG by genotype in CAD-relevant tissues (aorta (F and H) and tibial artery (G and I)). Numbers below the genotypes indicate sample size. Risk genotypes and eQTL and GWAS P-values are indicated. Reduced expression of PRTG is associated with risk alleles in both CAD-relevant tissues.

