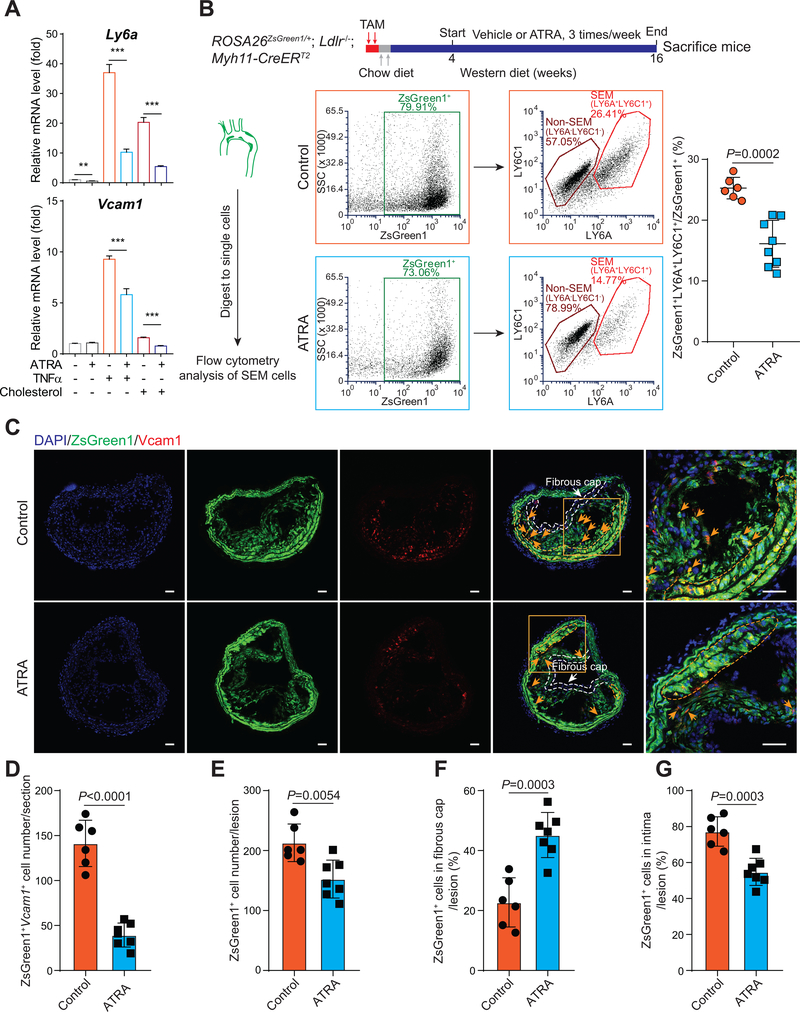
Figure 6. Activation of RA signaling via all-trans retinoic acid (ATRA) inhibits SEM cell marker expression in vitro and suppresses SMC to SEM cell transition and atherosclerosis in vivo.
A, Relative mRNA levels of SEM cell markers, Ly6a and Vcam1, in cultured mouse SMC treated with TNFα (25 ng/mL), cholesterol (40 μg/mL) or vehicle control (PBS) in the absence or presence of ATRA (10 μM) for 72 hours, are measured by RT-qPCR and normalized against Actb. Values are shown as mean ± s.d. **P < 0.01, ***P < 0.001, n=3. B, ROSA26ZsGreen1/+; Ldlr−/−; Myh11-CreERT2 mice induced by 2-day TAM are fed chow diet for 2 days, followed by WD. Vehicle (corn oil, control) or ATRA (2.5 mg/kg mice) administration is started after 4 weeks of WD, 3 times/week. Mice are sacrificed after 16-week WD. Arterial tissues (including ascending aorta, BCA and thoracic aorta) with atherosclerotic lesions are isolated and digested to single cells for flow cytometry analysis of the proportion of ZsGreen1+LY6A+LY6C1+ SEM cells among total ZsGreen1+ cells (control, n=6 mice; ATRA-treated, n=8 mice). Values are shown as mean ± s.d. P-value is indicated. C, RNAscope stained representative BCA sections from control (n=6) and ATRA-treated (n=7) mice indicate ZsGreen1+Vcam1+ SEM cells, regions of media, intima and fibrous cap (defined as the region within 30 μm of the luminal surface). Scale bars, 50 μm. D-G, ZsGreen1+Vcam1+ SEM cell number in BCA sections (D), ZsGreen1+ cell number within lesions (intima+fibrous cap) (E), percentage of ZsGreen1+ cells in fibrous cap/lesion (F) and percentage of ZsGreen1+ cells in intima/lesion (G) are calculated. Values are shown as mean ± s.d. P-values are indicated.

