

Abstract
Objective:
To clarify if musculoskeletal ultrasound (US) would give additional information for the clinical examination to diagnose and evaluate the activity of ankylosing spondylitis (AS).
Methods:
A literature search was performed in PubMed, Embase, Web of Science, the Cochrane Library, Sinomed, Chinese National Knowledge Infrastructure (CINK), and Wanfang databases from their inceptions to May 15, 2020. Studies that examined the musculoskeletal US, which detected sacroiliac joints in people with AS were included. The pooled analyses were performed using Meta Disc version 1.4 software.
Results:
A total of 9 studies encompassing 984 participants were included. Statistical analysis suggested an area under the curve (AUC) of 0.9259 (sensitivity 0.86, specificity 0.54) indicating that US had excellent diagnostic test accuracy for AS, an AUC of 0.6441 (sensitivity 0.87, specificity 0.51) indicating that the US did not have a good diagnostic test accuracy for AS activity. A subgroup analysis revealed that the AUC of power Doppler US (PDUS) and color Doppler US (CDUS) was 0.5000 and 0.9274, respectively, indicating that CDUS was superior to PDUS.
Conclusion:
US, especially CDUS, is a valid and reproducible technique for the diagnosis of AS. While the accuracy of AS activity evaluation of the US is not ideal. It may be considered for routine use as part of the standard diagnostic tools in AS.
Keywords: ankylosing spondylitis, area under curve, meta-analysis, musculoskeletal ultrasound, systematic review
1. Introduction
Ankylosing spondylitis (AS) is a chronic autoimmune disease, included in the group of axial spondyloarthritis.[1] It is a progressive, rheumatic disease, wherein patients may suffer from pain, fatigue, joint destruction, deformity, even disability, and loss of joint function.[2] It typically develops in males in their third decade of life and mainly affects the axial skeleton and the sacroiliac joints (SIJ). The data illustrated that the overall prevalence of AS is 0.1% to 1.4%.[3]
Since some changes associated with AS are irreversible, early diagnosis could improve the ultimate clinical outcome of the disease.[4] Complementary tests can help to diagnose and monitor the patients. Currently, conventional radiography is still widely used as a part of the classical classification criteria for spondyloarthritis, the modified New York criteria,[4] and the Assessment of Spondyloarthritis International Society (ASAS) group criteria.[5] However, radiography has low sensitivity for initial inflammatory changes as compared to the magnetic resonance imaging (MRI) and musculoskeletal ultrasound (US).[6] MRI is a more sensitive method than radiography and tomography because this modality can be used to visualize bone edema before radiographic changes occur;[7] however, this is a high-cost and low-availability method in comparison to US.[8,9]
US has been adopted in many disease, and it was increasingly used to investigate musculoskeletal disorders.[10] It was reported acceptable reliability of US in the evaluation of superficial and deep masticatory muscle thickness.[11] A meta-analysis revealed that US could distinguish that supraspinatus and infraspinatus tendons tended to be stiffer in shoulders with adhesive capsulitis.[12] According to a previous report, the clinical evaluation of an SIJ with a sign, such as tenderness, is poorly reproducible and not accurate in distinguishing between sacroiliitis and mechanical low back pain.[13] US is a highly sensitive, noninvasive, and practical tool in the assessment of musculoskeletal pathologies.[14] In addition, the technical innovations, such as combining grayscale with power Doppler US (PDUS), facilitate the assessment of the vascularity of the synovium and related structures and sites of inflammation in many rheumatic conditions.[15–17] A majority of the studies have used different qualitative and/or semi-quantitative techniques to examine power Doppler signals, such as counting color pixels, grading flow signals, or spectral analysis.[18] Although accumulating evidence proves the validity of US in AS,[19] that for the assessment of AS enthesopathy and its clinical relevance is yet lacking. There is even study that suggested that the vascularization in SIJ presented complex appearance, while a systematic review included 13 studies indicated no enough evidence to support the use of ultrasound as a diagnostic method for sacroiliitis.[20] As there is no review assess the diagnostic performance US for AS, a systematic review aimed to clarify whether US can be used for diagnosing and evaluating the activity of AS is necessary.
2. Methods
2.1. Search strategy
This study was conducted according to the Preferred Reporting Items for Systematic Reviews and Meta-analyses (PRISMA) Statement.[21] Institutional Review Board approval was not required because this article is a meta-analysis. The data comes from published articles and does not require ethical approval. Two reviewers independently searched the electronic databases from their inceptions to May 15, 2020, including PubMed, Embase, Web of Science, the Cochrane Library, Sinomed (Chinese), Chinese National Knowledge Infrastructure (CINK), and Wanfang (Chinese), to identify the potential studies. All the relevant studies were performed using medical subject headings (MeSH) or free text words related to “ankylosing spondylitis” OR “AS” OR “spondyloarthritis” OR “SpA” OR “axial spondyloarthritis” in combination with “ultrasound” OR “ultrasonic” OR “ultrasonography” OR “sonography” OR “echography” OR “US” OR “Doppler.” No language restriction was imposed. The references of relevant articles were also searched manually to retrieve additional eligible articles.
2.2. Selection criteria and literature assessment
Observational studies were included if musculoskeletal US detected SIJ in individuals with AS in the case group in the general population or in normal/healthy volunteers for the control group. The index test was US in any mode, including CDUS, PDUS, B-mode US, greyscale US, two-dimensional US, three-dimensional US, and the contrast-enhanced US. For studies analyzing both active and inactive AS in healthy participants, if the number of true-positive (TP), false-positive (FP), false-negative (FN), and true-negative (TN) cases were reported, they were included for quantitative analysis. If the studies were based on the same participants and outcome measures, only one of those publications with the most detailed information was included in this review.
The exclusion criteria were as follows:
-
1.
in vitro or animal studies;
-
2.
unoriginal research (reviews, editorials, meta-analyses, letters, and comments).
The studies were selected by two reviewers independently by screening the abstracts and full texts according to the eligibility criteria. In case in the event of disagreements, a third reviewer was asked to step in to resolve the issue by consensus.
2.3. Data extraction
Data extracted from eligible studies included publication year, country, study population, type of US, qualifications of sonographers, and the reference standard. These data were recorded in a predesigned table, and the values for TP, FP, FN, and TN for each study were reported for quantitative pooling. Two reviewers extracted data independently, and any disagreements were resolved through discussion with a third reviewer.
2.4. Methodological quality assessment
Two reviewers independently evaluated each study by scoring seven domains of the instrument Quality Assessment of Diagnostic Accuracy Studies-2 (QUADAS-2), a validated tool for the quality assessment of the diagnostic accuracy studies.[22] Any disagreement was resolved through discussion with a third reviewer. This checklist consisted of four key domains: patient selection, index test, reference standard, flow, and timing. Within each study, the domains were assessed in terms of risk of bias, and the first three of these domains were assessed in terms of concerns about applicability. The final results of the assessment of the methodological quality were summarized using Review Management version 5.3.5 (The Cochrane Collaboration, Copenhagen, Denmark).
2.5. Statistical analysis
The pooled analyses were performed using Meta Disc version 1.4 software. Heterogeneity was indicated by I2, where 0% means no heterogeneity and 100% means the strongest heterogeneity. If I2 > 50%, the heterogeneity across studies was significant, and a random-effects model was used in the meta-analysis; otherwise, a fixed-effects model was used.[23] Numerical values for pooled sensitivity, pooled specificity, positive likelihood ratio (LR), negative LR, and diagnostic odds ratio (DOR) were obtained from FN, FP, TN, and TP. These were presented alongside graphical representations, wherein the horizontal lines showed the confidence intervals (CIs). The summary receiver operating characteristic (SROC) curve represented the performance of a diagnostic test. A rough guide for classifying the accuracy of a diagnostic test was based on the area under the curve (AUC) and Q∗ index. On the SROC, each point represents a single study with the X-axis representing sensitivity and the Y-axis representing specificity. Q∗ is the point on the SROC where sensitivity equals specificity. A pooled DOR ranges from zero to infinity and represents improved accuracy. Values <1 point indicate improper test interpretation (a large number of negative tests among the diseased).[24] The criteria for AUC classification were 0.90 to 1 (excellent), 0.80 to 0.90 (good), 0.70 to 0.80 (fair), 0.60 to 0.70 (poor), and 0.50 to 0.60 (failed).[25] The positive LR values <2, 2 to 5, 5 to 10, and >10 were recognized as a not meaningful, small, moderate, and large increase in probability, respectively.[26] The negative LR values >0.5, 0.2 to 0.5, 0.1 to 0.2, and <0.1 were recognized as a not meaningful, small, moderate, and large decrease in probability, respectively.[27] Publication bias was also assessed using funnel plots generated by Review Manager 5.3.5.
3. Results
Initially, 1365 potentially relevant studies were identified through electronic and manual searches. Among these, 498 studies were excluded as these were duplicate publications by the atuomatically discard duplicates option of Endnote 7, and then, 771 studies were excluded after screening the titles and abstracts. Of the remaining 96 studies, 54 were reviews, 15 were case series, four were without eligible outcome, and 14 that evaluated other pathological changes of AS were excluded. Finally, nine studies with 984 participants (614 AS patients and 370 healthy volunteers) were included in this systematic review.[28–36] The selection process of the studies is illustrated in Figure 1.
Figure 1.
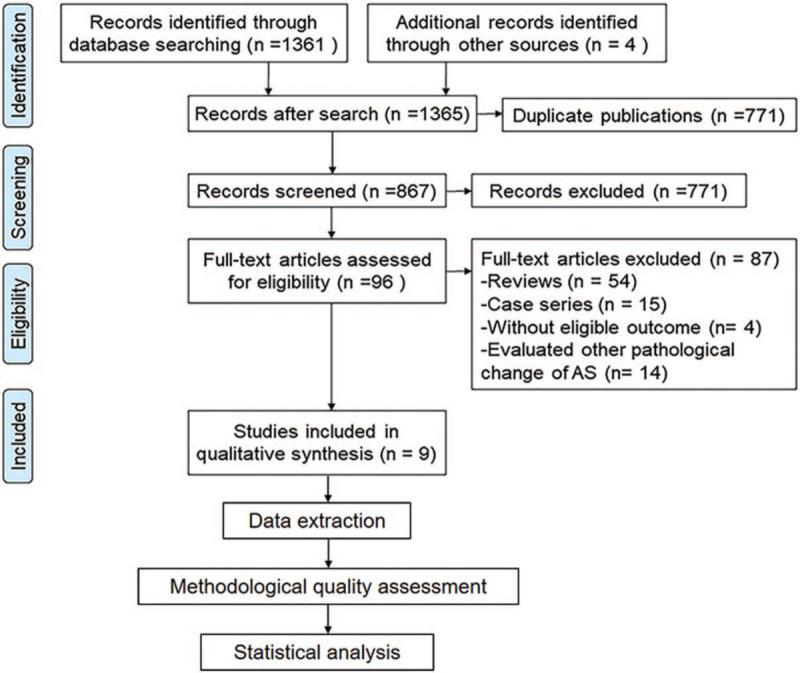
Summary of the literature identification and selection process.
3.1. Characteristics of included studies
Among the nine studies included in the meta-analysis, seven explored the diagnostic performance of AS,[28–34] and five evaluated the AS activity.[29–31,35,36] Three studies[31,35] were published in English, and six[28,29,32–34,36] in Chinese. The CDUS was applied in seven studies,[29–32,34–36] while two studies utilized PDUS.[28,33] Most of the studies enrolled AS patients according to the Modified New York criteria,[4] and one applied the diagnosis of AS with integrated traditional Chinese and Western Medicine.[34] The Bath AS disease activity index (BASDAI) scores were measured for cases using visual analog scales to distinguish between active and inactive AS; a patient with BASDAI score >4 was considered as active AS.[29–31,35] All the studies described that senior or experienced ultrasonographers were employed, but only one claimed >6 years of experience.[31] Only three studies[30,31,35] specifically stated that the results of the diagnostic gold standard were unknown to the sonographers.[28,29,32–34,36] The details of the nine included studies and involved participants are presented in Table 1.
Table 1.
Summary of the studies included in this review.
| Study | Country | Design | Ultrasound | Study population | References | Qualifications of sonographers | TP | FN | TN | FP |
| AS diagnosis | ||||||||||
| Zhu, 2008[28] | China | Case–control | PDUS | 57 sacroiliac joints in 31 patients with active AS and 40 sacroiliac joints in 20 healthy volunteers | Modified New York criteria with MRI | US examination was performed by a senior ultrasound physician | 55 | 2 | 16 | 24 |
| Xue, 2010[29] | China | Case–control | CDUS | 50 AS patients (27 active and 23 inactive), and 30 healthy volunteers | Modified New York criteria with MRI | Each patient was examined by the same ultrasound doctor | 41 | 9 | 30 | 0 |
| Zhu, 2010[30] | China | Case–control | CDUS | 68 AS patients (42 active and 26 inactive) and 35 healthy volunteers | Modified New York criteria with MRI | US examination was performed by an ultrasonographer experienced in musculoskeletal US | 115 | 21 | 27 | 43 |
| Mohammadi, 2013[31] | Iran | Case–control | CDUS | 51 AS patients (27 active and 24 inactive), and 30 healthy volunteers | Modified New York criteria with MRI | One radiologist with 6 years of experience in musculoskeletal radiology performed the US examinations | 31 | 22 | 19 | 11 |
| Qi, 2014[32] | China | Case–control | CDUS | 56 patients with early AS patients (112 sacroiliac joints) and 51 healthy subjects | Modified New York criteria with MRI | All subjects were examined by the same senior musculoskeletal US physician | 102 | 10 | 36 | 66 |
| Lai, 2016[33] | China | Case–control | PDUS | 31 AS patients and 20 healthy subjects | Modified New York criteria with MRI | All subjects were examined by the same senior musculoskeletal US physician | 27 | 2 | 11 | 9 |
| Huang, 2020[34] | China | Cross-sectional | CDUS | 41 AS patients (23 active and 18 inactive) and 41 control subjects | Diagnosis of AS with integrated traditional Chinese and Western Medicine | Each patient was examined by the same US doctor | 41 | 0 | 41 | 0 |
| AS activity Evaluation | ||||||||||
| Xue, 2010[29] | China | Case–control | CDUS | 27 active AS patients and 23 inactive | BASDAI | Each patient was examined by the same US doctor | 15 | 12 | 16 | 7 |
| Zhu, 2010[30] | China | Cross-sectional | CDUS | 42 active AS patients and 26 inactive | BASDAI | An ultrasonographer experienced in musculoskeletal US | 84 | 0 | 21 | 31 |
| Hu, 2011[35] | China | Cross-sectional | CDUS | 113 active AS patients and 48 inactive AS patients | BASDAI | the same experienced ultrasonographer | 205 | 21 | 59 | 37 |
| Mohammadi, 2013[31] | Iran | Case–control | CDUS | 27 active AS patients and 24 inactive | BASDAI | One radiologist with 6 years of experience in musculoskeletal radiology performed the US examinations | 7 | 17 | 19 | 11 |
| Qi, 2018[36] | China | Cross-sectional | CDUS | 101 sacroiliac joints in 55 active AS patients and 60 sacroiliac joints in 31 inactive AS patients | MRI | Experienced ultrasonographer | 90 | 11 | 17 | 43 |
AS = ankylosing spondylitis, BASDAI = Bath AS disease activity index, CDUS = color Doppler ultrasound, FN = false negative, FP = false positive, MRI = magnetic resonance imaging, PDUS = power Doppler ultrasound, TN = true negative, TP = true positive.
3.2. Risk of bias assessment
The results of the methodological quality evaluation are summarized in Figures 2 and 3. For patient selection, all the studies failed to report if a consecutive or random sample of patients was enrolled; most of them were case–control design, except four studies.[30,34–36] In addition, there were fewer concerns that the included patients and setting do not match the review question in these studies, except two studies.[34,36] In addition, the majority of the studies were not claimed blind, thus only three studies got “low risk” in the Index Test.[30,31,35] The modified New York criteria were considered as “gold standard” to diagnosed AS,[4] and then BASDAI was accepted to distinguish between active and inactive AS patients. Moreover, only three studies[30,31,35] specifically stated that the results of the diagnostic gold standard were unknown to the sonographers. Thus, only three studies were labeled “low risk” in the reference standard,[30,31,35] and two studies got “high risk”.[34,36] However, none of the studies reported the details of flow and timing. More than half of the studies reported the index test with low applicability concerns,[28,30,31,35,36] while the applicability concern of the reference standard was controversial.
Figure 2.
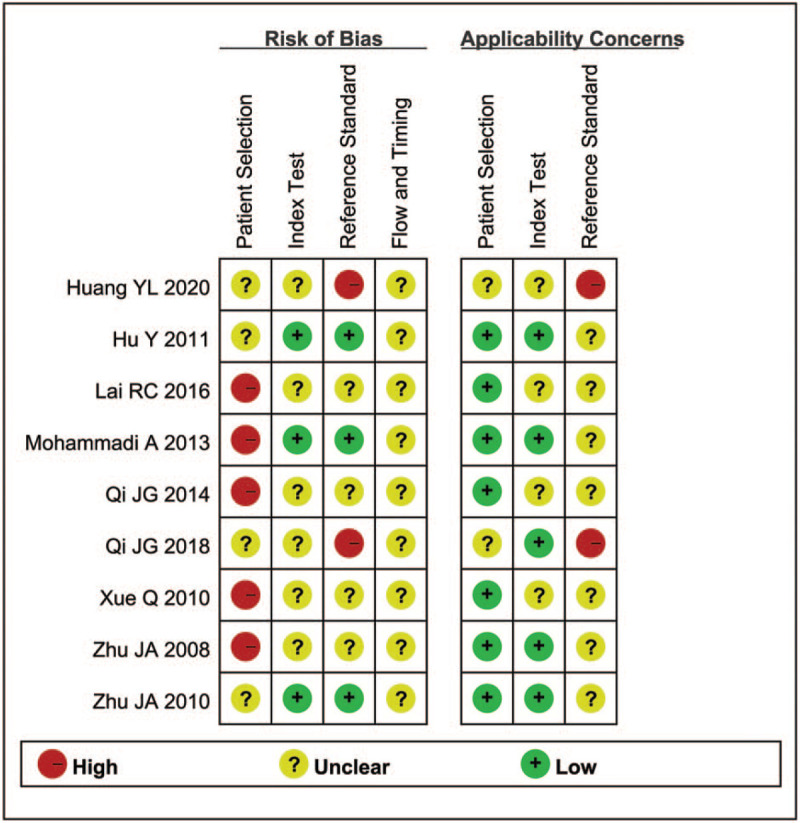
Summary of methodological quality.
Figure 3.
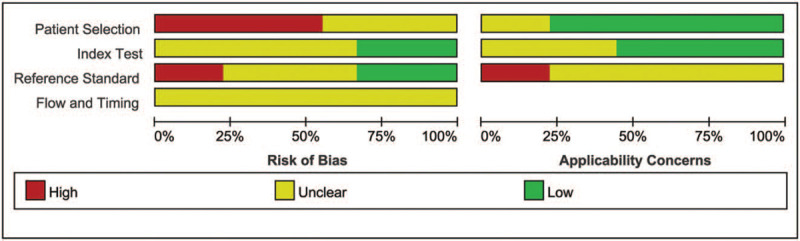
Methodological quality graph.
3.3. Accuracy of AS diagnosis
A total of seven studies with 555 participants (328 AS patients and 348 healthy volunteers) assessed the value of US on AS.[28–34] The data from these studies suggested a DOR of 12.71 (95% CI: 4.21–38.34; I2 = 81.3%), an AUC of 0.9259, and Q of 0.8602, indicating that US had excellent diagnostic test accuracy for AS (Figs. 4 and 5E).
Figure 4.

SROC curve of US for AS diagnosis.
Figure 5.
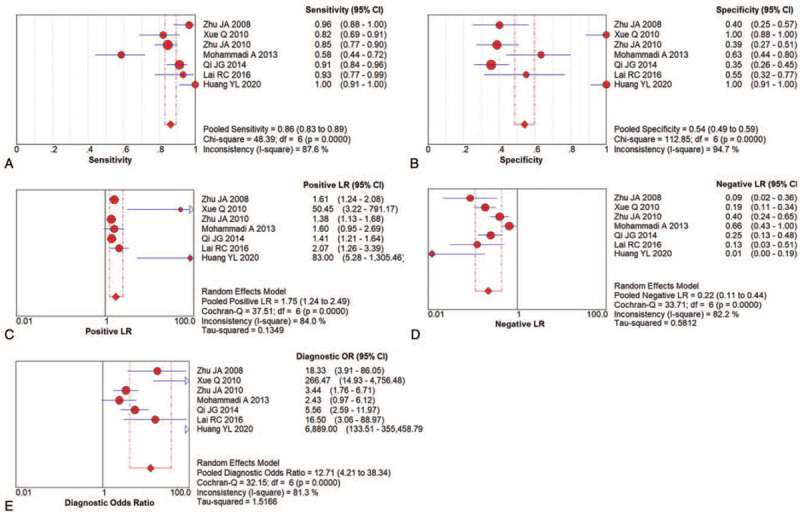
Paired forest plots of US for AS diagnosis. (A) Pooled sensitivity; (B) Pooled specificity; (C) Positive LR; (D) Negative LR; (E) DOR.
The pooled sensitivity and specificity were 0.86 (95% CI: 0.83–0.89) and 0.54 (95% CI: 0.49–0.59), respectively (Figs. 5A and B). The pooled positive LR was 1.75 (95% CI 1.24–2.49), meaning a not meaningful increase in probability, then the pooled negative LR was 0.22 (95% CI 0.11–0.44), which meant a small decrease in probability (Figs. 5C and D). In other words, the positive result of US is not unique, and it would be confused with other similar diseases, then confirmed patients would be easier to find, there are more false positive patients.
3.4. Accuracy of AS activity evaluation
A total of five studies with 445 participants (264 active and 181 inactive AS patients) assessed the diagnostic value of the US on AS activity.[29–31,35,36] The DOR was 5.03 (95% CI: 1.36–18.56; I2 = 86.9%), the AUC was 0.6441, and Q was 0.6091, which indicated that the US did not have a good diagnostic test accuracy for AS activity (Figs. 6 and 7E).
Figure 6.
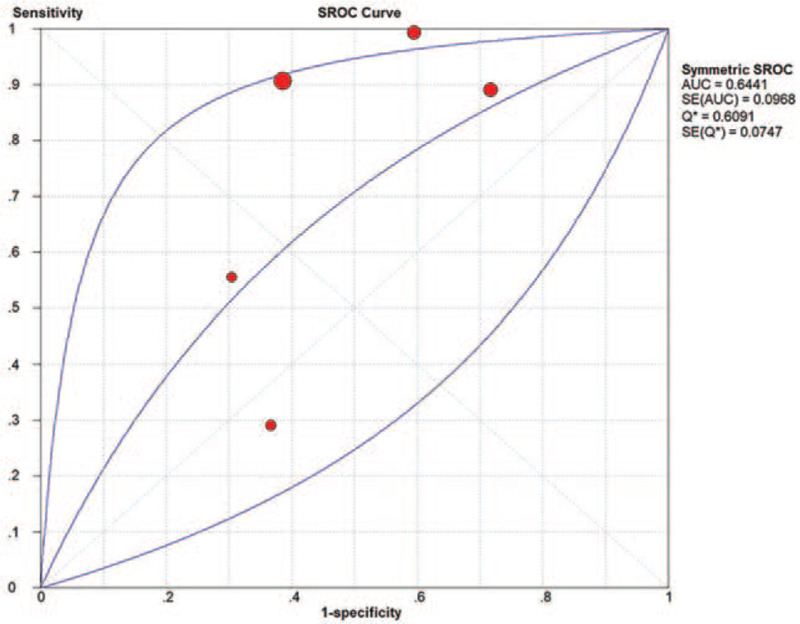
SROC curve of US for AS activity evaluation.
Figure 7.
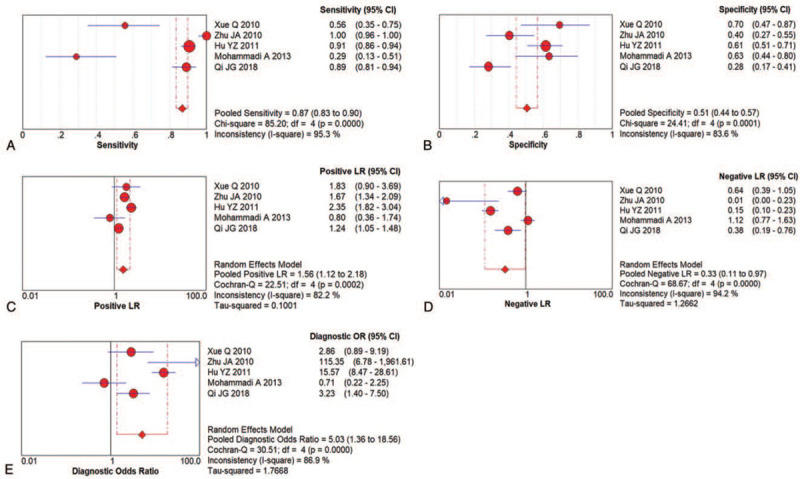
Paired forest plots of US for AS activity evaluation; (A) Pooled sensitivity; (B) Pooled specificity; (C) Positive LR; (D) Negative LR; (E) DOR.
The pooled sensitivity and specificity were 0.87 (95% CI: 0.83–0.90) and 0.51 (95% CI: 0.44–0.57), respectively (Figs. 7A and B). The pooled positive LR was 1.56 (95% CI: 1.12–2.18), indicating an insignificant increase in probability, and the pooled negative LR was 0.33 (95% CI: 0.11–0.97), indicating a small decrease in the probability (Figs. 7C and D). It was the same with US for AS diagnosis, confirmed patients would be easier to find by US, and then it came with more false positive patients.
3.5. Subgroup analysis and sensitivity analysis
Subgroup analysis revealed that the pooled sensitivity and specificity were 0.95 (95% CI: 0.89–0.99) and 0.45 (95% CI: 0.32–0.58), respectively, for PDUS, while that for CDUS were 0.84 (95% CI: 0.80–0.88) and 0.56 (95% CI: 0.50–0.60), respectively. The AUC of PDUS and CDUS was 0.5000 and 0.9274, respectively, indicating that CDUS was superior to PDUS (Fig. 8 and Table 2). In contrast, the PDUS was more targeted to AS, due to higher specificity.
Figure 8.
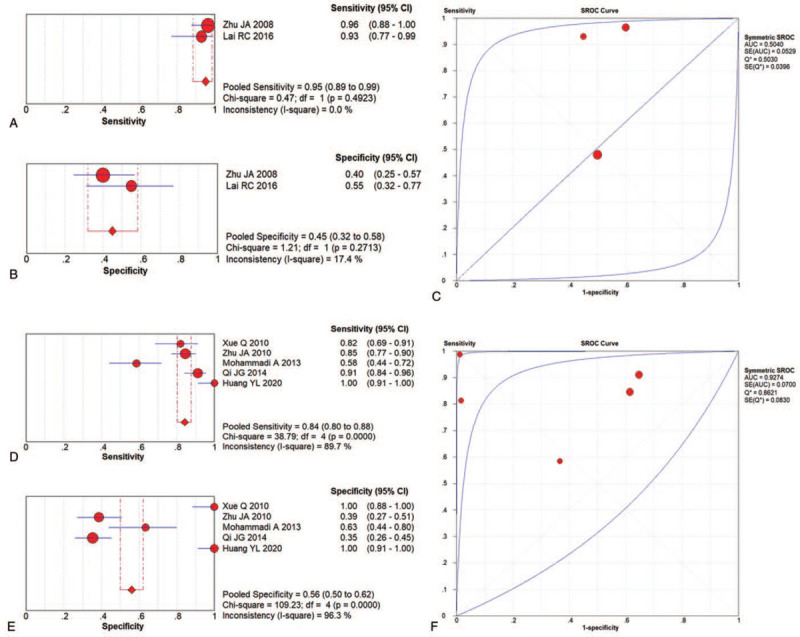
Subgroup analysis of US for AS diagnosis related to PDUS and CDUS.
Table 2.
Subgroup analysis of accuracy of AS diagnosis, and activity evaluation.
| Subgroup | n | Sensitivity (I2) | Specificity (I2) | AUC |
| Accuracy of AS diagnosis | ||||
| Ultrasound category | ||||
| PDUS | 2 | 0.95 (0.89–0.90), 0.0% | 0.45 (0.32–0.58), 17.4% | 0.5040 |
| CDUS | 5 | 0.84 (0.80–0.88), 89.7% | 0.56 (0.50–0.62), 96.3% | 0.9274 |
| Area | ||||
| China | 5 | 0.90 (0.86–0.92), 59.8% | 0.53 (0.47–0.59), 95.5% | 0.9601 |
| Other | 1 | / | / | / |
| Sample size | ||||
| Over 100 | 2 | 0.88 (0.83–0.91), 59.1% | 0.37 (0.29–0.44), 0.00% | / |
| Less than 100 | 5 | 0.85 (0.79–0.89), 91.2% | 0.73 (0.65–0.79), 94.1% | 0.9491 |
| Accuracy of AS activity evaluation | ||||
| Area | ||||
| China | 4 | 0.90 (0.87–0.93), 92.4% | 0.49 (0.42–0.56), 0.86.5% | 0.6933 |
| Other | 1 | / | / | / |
| Sample size | ||||
| Over 100 | 3 | 0.92 (0.89–0.95), 87.1% | 0.47 (0.40–0.54), 88.7% | 0.6249 |
| Less than 100 | 2 | 0.43 (0.29–0.58), 72.7% | 0.66 (0.52–0.78), 0.0% | / |
AS = ankylosing spondylitis, CDUS = color Doppler ultrasound, PDUS = power Doppler ultrasound.
The studies were divided into Asian and other ethnicities, and the sample size was >100 and <100 (Table 2).
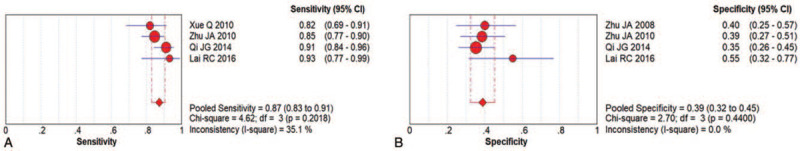
The sensitivity was also analyzed. After the elimination of three studies, the pooled sensitivity and specificity were 0.87 (95% CI: 0.83–0.90) and 0.39 (95% CI: 0.32–0.45) and related to the accuracy of AS diagnosis (Fig. 9A and B). Then, the sensitivity analysis could not identify the source of heterogeneity.
Figure 9.
Sensitivity analysis of US for AS diagnosis.
3.6. Publication bias
As only nine studies were included in this review, thus the funnel plots could not be applied, the publication bias could not be detected.[37]
4. Discussion
AS is a prototype of a seronegative spondyloarthropathy,[1] and early diagnosis is crucial for the prevention of irreversible changes. Sacroiliitis is one of the early clinical signs suggestive of AS, making prompt and easily accessible verification of sacroiliitis a valuable clinical tool. MRI is a valuable tool in the assessment of patients with AS. If MRI is conducted early in the disease, it shows early destructive lesions and alterations (inflammation and edema) in the SIJ.[38] Dynamic MRI with fat saturation (either STIR or T1) with contrast enhancement is highly sensitive and specific for identifying early intraarticular inflammation, cartilage changes, and underlying bone marrow edema in sacroiliitis.[39] The inherent disadvantages of MRI include high cost, length of time required for the study, and the fact that the technique is not available everywhere.
The current results showed that the US could be used as a convenient technique in the diagnosis of AS (AUC = 0.8844), especially CDUS, albeit there is no advantage in distinguishing between active and inactive AS patients (AUC = 0.6441). Therefore, the US can be a very useful tool for assessing sacroiliitis in patients with AS because this modality is a safe imaging method that requires no radiation exposure or contrast material; furthermore, the US can be performed rapidly and in a cost-effective manner in comparison to MRI.[40] Based on the specificity of the US calculated in our study (pooled specificity: 0.53, 95% CI: 0.48–0.58), it is highly likely that a patient would have abnormal US results. The sensitivity of the US (pooled sensitivity: 0.87, 95% CI: 0.83–0.90) in the detection of sacroiliitis-routine usage S in patients with sacroiliitis reduces the need for evaluation of patients with MRI and can be cost-effective.
PDUS displays the energy of all moving erythrocytes at each sampling site. CDUS displays the direction (up or down) and the mean velocity of all moving erythrocytes at each sampling site. In the early machines, power Doppler appeared to be more sensitive than color Doppler,[41] which could be attributed to the fact that at each sampling site, the energies of all the different velocities are summed, generating a better signal-to-noise ratio, whereas, in color Doppler, the average velocity at each sampling site is displayed.[42] Our previous studies reviewed that the CDUS was more accurate then PDUS, which is different from the traditional cognition. Interestingly, six different types of US machines were used to compare the color and power Doppler modalities in these studies.[43] It is a misconception that power Doppler is inherently more sensitive than color Doppler. Both have basically the same detection process and rely on the same physics (e.g., the Doppler equation), and thus, are similarly affected by factors such as Doppler angle, ensemble length, and burst length. Both also use essentially the same signal processing (e.g., autocorrelation, wall filtering, and segmentation). The difference is that the parameter extracted from the processing is displayed on the image-power in one case and velocity (and variance) in the other case. However, both techniques allow tradeoffs to be made between sensitivity and other image properties. The Doppler sensitivity depends on many variables, each of which may be adjusted differently in different models and software programs.[43] The end result is that the sensitivity of a given Doppler configuration cannot be predicted from the design but has to be determined in practice.
There was no systematic review assessed the diagnostic performance of US for AS before, while a systematic review assessed the diagnostic performance of US for spondyloarthritis was published in 2018, wider scope that including AS.[21] Thirteen studies were included. As the methods of evaluation of sacroiliitis vary between the studies included, the systematic review indicated no enough evidence to support the use of ultrasound as a diagnostic method for sacroiliitis but it has potential to identify structural lesions at SIJ's level. Our systematic review focused on AS, excluded other types of spondyloarthritis, and added two studies, thus confirmed the diagnostic performance of US for AS. (Supplementary file).
Nevertheless, the present has some limitations. The qualification of the sonographers, the device used, the duration of symptoms, the ultrasound feature taken into overall consideration, the interpretation of US images among sonographers, the number of examined joints in person-based evaluations, and other methodological characteristics varied across studies. Therefore, future studies are needed to refine the study design and investigate the performance of the US at specific sites and at specific time points in the disease course of AS. Then, as only nine studies were included in the review, the publication bias could not be detected. In addition, subgroup analysis and sensitivity analysis were both conducted, and the source of heterogeneity remains unresolved. Furthermore, follow-up should be recommended to observe the longitudinal changes of US features. Finally, since most of the included studies were from China, the results may be biased by the included population.
5. Conclusion
In summary, this is the first systematic review to assess the diagnostic value of US for AS. It suggested that the US, especially CDUS, is a valid and reproducible technique for the diagnosis of AS, while the accuracy of AS activity evaluation of the US is not yet satisfactory. Thus, this systematic review recommended CDUS for the diagnosis of AS, then the diagnostic specificity of US for AS needs to be improved further. Nevertheless, the present has some limitations related to the details of US operation, a small amount of included articles, and regional bias. To substantiate current conclusions, well-designed studies are imperative, the standardization of ultrasound examination is necessary.
Author contributions
Conceptualization: Lin Zhu.
Data curation: Peng Chen, Xuanjing Sun, Shuo Zhang.
Formal analysis: Peng Chen, Xuanjing Sun, Shuo Zhang.
Project administration: Lin Zhu.
Resources: Lin Zhu, Xuanjing Sun, Shuo Zhang.
Writing – original draft: Lin Zhu, Peng Chen.
Writing – review & editing: Peng Chen.
Supplementary Material
Footnotes
Abbreviations: AS = ankylosing spondylitis, ASAS = the Assessment of Spondyloarthritis International Society, AUC = the area under the curve, CDUS = color Doppler US, CINK = Chinese National Knowledge Infrastructure, CIs = the confidence intervals, DOR = diagnostic odds ratio, FN = false-negative, FP = false-positive, LR = likelihood ratio, MeSH = medical subject headings, MRI = the magnetic resonance imaging, PDUS = power Doppler US, PRISMA = the Preferred Reporting Items for Systematic Reviews and Meta-analyses, SI = sacroiliac, SROC = The summary receiver operating characteristic, TN = true-negative, TP = true-positive, US = ultrasound.
How to cite this article: Zhu L, Chen P, Sun X, Zhang S. Musculoskeletal ultrasound for ankylosing spondylitis: A systematic review and meta-analysis. Medicine. 2021;100:18(e25822).
The authors have no funding information to disclose.
The authors have no conflict of interest to disclose.
Data availability statement: The datasets used and/or analysed during the current study are available from the corresponding author on reasonable request.
The datasets generated during and/or analyzed during the present study are available from the corresponding author on reasonable request.
Supplemental digital content is available for this article.
References
- [1].Garcia-Montoya L, Gul H, Emery P. Recent advances in ankylosing spondylitis: understanding the disease and management. F1000Res 2018;7: doi: 10.12688/f1000research.14956.1. [DOI] [PMC free article] [PubMed] [Google Scholar]
- [2].Dagfinrud H, Mengshoel AM, Hagen KB, et al. Health status of patients with ankylosing spondylitis: a comparison with the general population. Ann Rheum Dis 2004;63:1605–10. [DOI] [PMC free article] [PubMed] [Google Scholar]
- [3].Boonen A, Sieper J, van der Heijde D, et al. The burden of non-radiographic axial spondyloarthritis. Semin Arthritis Rheum 2015;44:556–62. [DOI] [PubMed] [Google Scholar]
- [4].van der Linden S, Valkenburg HA, Cats A. Evaluation of diagnostic criteria for ankylosing spondylitis. A proposal for modification of the New York criteria. Arthritis Rheum 1984;27:361–8. [DOI] [PubMed] [Google Scholar]
- [5].Rudwaleit M, van der Heijde D, Landewé R, et al. The development of Assessment of SpondyloArthritis international Society classification criteria for axial spondyloarthritis (part II): validation and final selection. Ann Rheum Dis 2009;68:777–83. [DOI] [PubMed] [Google Scholar]
- [6].Wakefield RJ, Conaghan PG, Jarrett S, et al. Noninvasive techniques for assessing skeletal changes in inflammatory arthritis: imaging technique. Curr Opin Rheumatol 2004;16:435–42. [DOI] [PubMed] [Google Scholar]
- [7].Puhakka KB, Jurik AG, Egund N, et al. Imaging of sacroiliitis in early seronegative spondylarthropathy. Assessment of abnormalities by MR in comparison with radiography and CT. Acta Radiol 2003;44:218–29. [DOI] [PubMed] [Google Scholar]
- [8].Genc H, Cakit BD, Tuncbilek I, et al. Ultrasonographic evaluation of tendons and enthesal sites in rheumatoid arthritis: comparison with ankylosing spondylitis and healthy subjects. Clin Rheumatol 2005;24:272–7. [DOI] [PubMed] [Google Scholar]
- [9].Bennett AN, McGonagle D, O’Connor P, et al. Severity of baseline magnetic resonance imaging-evident sacroiliitis and HLA-B27 status in early inflammatory back pain predict radiographically evident ankylosing spondylitis at eight years. Arthritis Rheum 2008;58:3413–8. [DOI] [PubMed] [Google Scholar]
- [10].Hambardzumyan MA, Hambardzumyan AH. Differential diagnosis of malignant melanoma and benign cutaneous lesions by ultrasound analysis. SciMedicine J 2020;2:100–7. [Google Scholar]
- [11].Chang PH, Chen YJ, Chang KV, et al. Ultrasound measurements of superficial and deep masticatory muscles in various postures: reliability and influencers. Sci Rep 2020;10:14357. [DOI] [PMC free article] [PubMed] [Google Scholar]
- [12].Chiu YH, Chang KV, Chen IJ, et al. Utility of sonoelastography for the evaluation of rotator cuff tendon and pertinent disorders: a systematic review and meta-analysis. Eur Radiol 2020;30:6663–72. [DOI] [PubMed] [Google Scholar]
- [13].Jarvik JG, Deyo RA. Diagnostic evaluation of low back pain with emphasis on imaging. Ann Intern Med 2002;137:586–97. [DOI] [PubMed] [Google Scholar]
- [14].Cook CR. Ultrasound Imaging of the Musculoskeletal System. Vet Clin North Am Small Anim Pract 2016;46:355–71. [DOI] [PubMed] [Google Scholar]
- [15].Takase-Minegishi K, Horita N, Kobayashi K, et al. Diagnostic test accuracy of ultrasound for synovitis in rheumatoid arthritis: systematic review and meta-analysis. Rheumatology (Oxford) 2018;57:49–58. [DOI] [PubMed] [Google Scholar]
- [16].Zhang Q, Gao F, Sun W. The diagnostic performance of musculoskeletal ultrasound in gout: a systematic review and meta-analysis. PLoS One 2018;13:e0199672. [DOI] [PMC free article] [PubMed] [Google Scholar]
- [17].Iragorri N, Hazlewood G, Manns B, et al. Psoriatic arthritis screening: a systematic review and meta-analysis. Rheumatology (Oxford) 2019;58:692–707. [DOI] [PMC free article] [PubMed] [Google Scholar]
- [18].Jiménez-Balderas FJ, García-Rubi D, Pérez-Hinojosa S, et al. Two-dimensional echo Doppler findings in juvenile and adult onset ankylosing spondylitis with long-term disease. Angiology 2001;52:543–8. [DOI] [PubMed] [Google Scholar]
- [19].Hartung W, Nigg A, Strunk J, et al. Clinical assessment and ultrasonography in the follow-up of enthesitis in patients with spondyloarthritis: a multicenter ultrasound study in daily clinical practice. Open Access Rheumatol 2018;10:161–9. [DOI] [PMC free article] [PubMed] [Google Scholar]
- [20].Gutierrez M, Rodriguez S, Soto-Fajardo C, et al. Ultrasound of sacroiliac joints in spondyloarthritis: a systematic review. Rheumatol Int 2018;38:1791–805. [DOI] [PubMed] [Google Scholar]
- [21].Liberati A, Altman DG, Tetzlaff J, et al. The PRISMA statement for reporting systematic reviews and meta-analyses of studies that evaluate healthcare interventions: explanation and elaboration. BMJ 2009;339:b2700. [DOI] [PMC free article] [PubMed] [Google Scholar]
- [22].Whiting PF, Rutjes AW, Westwood ME, et al. QUADAS-2: a revised tool for the quality assessment of diagnostic accuracy studies. Ann Intern Med 2011;155:529–36. [DOI] [PubMed] [Google Scholar]
- [23].Zhang T, Yin M, Wang L, et al. Diagnostic performance of blood-based liquid biopsies in hepatocellular carcinoma: a protocol for systematic review and meta-analysis. Medicine 2020;99:e22594. [DOI] [PMC free article] [PubMed] [Google Scholar]
- [24].Glas AS, Lijmer JG, Prins MH, et al. The diagnostic odds ratio: a single indicator of test performance. J Clin Epidemiol 2003;56:1129–35. [DOI] [PubMed] [Google Scholar]
- [25].Bradley AP. The use of the area under the ROC curve in the evaluation of machine learning algorithms. Pattern Recognit 1997;30:1145–59. [Google Scholar]
- [26].Grimes DA, Schulz KF. Refining clinical diagnosis with likelihood ratios. Lancet 2005;365:1500–5. [DOI] [PubMed] [Google Scholar]
- [27].Cronin P, Kelly AM, Altaee D, et al. How to perform a systematic review and meta-analysis of diagnostic imaging studies. Acad Radiol 2018;25:573–93. [DOI] [PubMed] [Google Scholar]
- [28].Zhu JA, Hu B, Wang NS, et al. Preliminary evaluation of color power Doppler ultrasonography in diagnosis of sacroiliitis in patients with ankylosing spondylitis. J Shanghai Jiaotong Univ (Med Sci) 2008;28:1146–8. [Google Scholar]
- [29].Xue Q, Zhu JA, Wang NS, et al. The evaluating value ofcolor ultrasound forsacroiliitisand enthesopathy in ankylosing spondylitis. J Pract Med 2010;26:1759–61. [Google Scholar]
- [30].Zhu J, Xing C, Jiang Y, et al. Evaluation of complex appearance in vascularity of sacroiliac joint in ankylosing spondylitis by color Doppler ultrasonography. Rheumatol Int 2012;32:69–72. [DOI] [PubMed] [Google Scholar]
- [31].Mohammadi A, Ghasemi-rad M, Aghdashi M, et al. Evaluation of disease activity in ankylosing spondylitis; diagnostic value of color Doppler ultrasonography. Skeletal Radiol 2013;42:219–24. [DOI] [PubMed] [Google Scholar]
- [32].Qi JG, Guo DN, Liu Q, et al. The application of color Doppler ultrasound of sacroiliac joint in diagnosing early ankylosing spondylitis. Chin J Diffic and Compl Cas 2014;13:824–30. [Google Scholar]
- [33].Lai RQ, Liu JF, Jiang ZJ, et al. PDI manifestation of early ankylosing spondylitis. Mod Med Imaging 2016;25:497–9. [Google Scholar]
- [34].Huang YL. Clinical value of color Doppler ultrasound in evaluating sacroiliac arthritis and tendon end lesions in patients with active ankylosing spondylitis. J Electrocardiogram 2020;9:63–4. [Google Scholar]
- [35].Hu Y, Zhu J, Xue Q, et al. Scanning of the sacroiliac joint and entheses by color Doppler ultrasonography in patients with ankylosing spondylitis. J Rheumatol 2011;38:1651–5. [DOI] [PubMed] [Google Scholar]
- [36].Qi JG, Zhang XY, Guo DN, et al. Color Doppler ultrasonography in assessing the activity of sacroiliitis in patients with ankylosing spondylitis. J Pract Med 2018;34:3787–91. [Google Scholar]
- [37].Bollow M, Braun J, Hamm B, et al. Early sacroiliitis in patients with spondyloarthropathy: evaluation with dynamic gadolinium-enhanced MR imaging. Radiology 1995;194:529–36. [DOI] [PubMed] [Google Scholar]
- [38].Oostveen J, Prevo R, den Boer J, et al. Early detection of sacroiliitis on magnetic resonance imaging and subsequent development of sacroiliitis on plain radiography. A prospective, longitudinal study. J Rheumatol 1999;26:1953–8. [PubMed] [Google Scholar]
- [39].Kiris A, Kaya A, Ozgocmen S, et al. Assessment of enthesitis in ankylosing spondylitis by power Doppler ultrasonography. Skeletal Radiol 2006;35:522–8. [DOI] [PubMed] [Google Scholar]
- [40].Bude RO, Rubin JM, Adler RS. Power versus conventional color Doppler sonography: comparison in the depiction of normal intrarenal vasculature. Radiology 1994;192:777–80. [DOI] [PubMed] [Google Scholar]
- [41].Rubin JM, Bude RO, Carson PL, et al. Power Doppler US: a potentially useful alternative to mean frequency-based color Doppler US. Radiology 1994;190:853–6. [DOI] [PubMed] [Google Scholar]
- [42].Hamper UM, DeJong MR, Caskey CI, et al. Power Doppler imaging: clinical experience and correlation with color Doppler US and other imaging modalities. Radiographics 1997;17:499–513. [DOI] [PubMed] [Google Scholar]
- [43].Torp-Pedersen S, Christensen R, Szkudlarek M, et al. Power and color Doppler ultrasound settings for inflammatory flow: impact on scoring of disease activity in patients with rheumatoid arthritis. Arthritis Rheumatol 2015;67:386–95. [DOI] [PubMed] [Google Scholar]
Associated Data
This section collects any data citations, data availability statements, or supplementary materials included in this article.