Figure 2. Automated calibration of display position.
(A) Schematic showing the position of two hypothetical displays of different sizes, at different distances and orientation relative to the observer (red dot). (B) How a checkerboard of the same visual angle would appear on each of the two displays. (C) Example of automatic calibration of display position. Standard markers are presented on the display, or in the environment, to allow automated detection of the position and orientation of both the display and the observer. These positions and orientations are indicated by the superimposed red cubes as calculated by BonVision. (D) How the checkerboard would appear on the display when rendered, taking into account the precise position of the display. (E and F) Same as (C and D), but for another pair of display and observer positions. The automated calibration was based on the images shown in C and E.
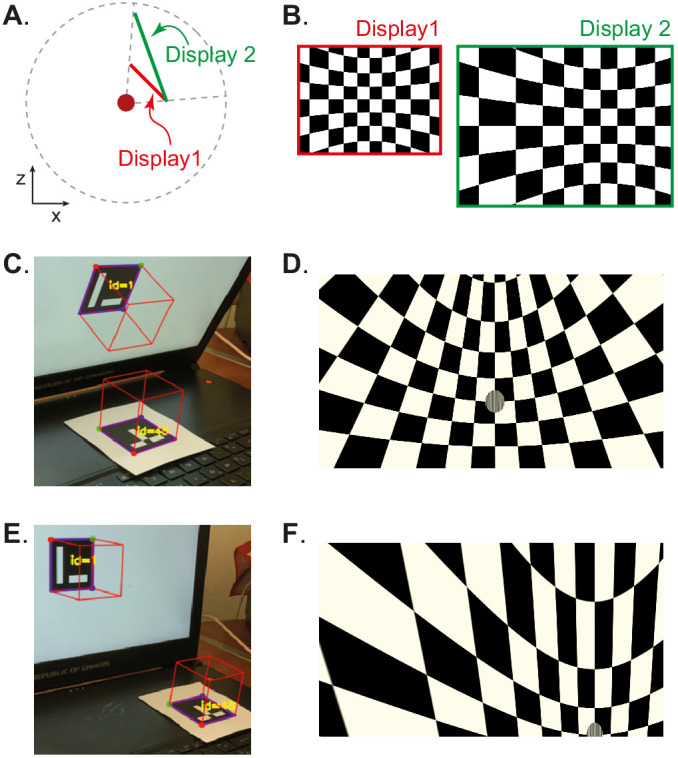
Figure 2—figure supplement 1. Automated workflow to calibrate display position.

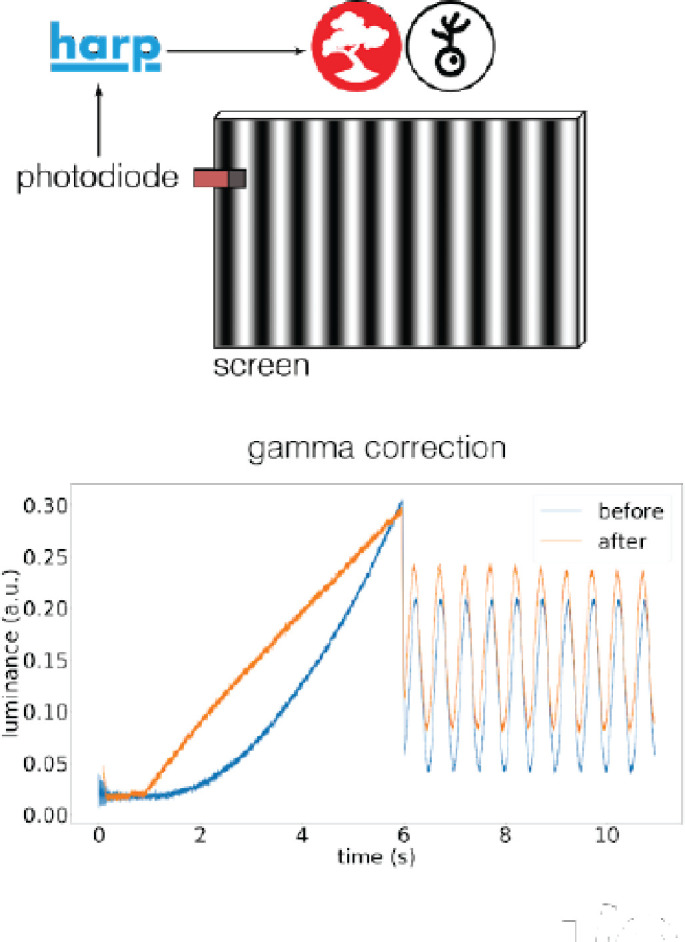
Figure 2—figure supplement 2. Automated gamma-calibration of visual displays.