It is important to produce lactic acid in kimoto-style seed mash; however, the bacterial transition is different depending on the sake brewery. The reason why there are diverse bacterial transitions during kimoto-style seed mash preparation for each sake brewery is unclear so far, and it causes difficulty in starting kimoto-style seed mash.
KEYWORDS: kimoto, bacterial diversity, sake, arginine, growth prediction of Lactobacillus sakei
ABSTRACT
Kimoto-style seed mash is a traditional preparation method for sake that takes advantage of spontaneous lactic acid fermentation before the growth of yeast. Lactic acid helps decrease the pH in seed mash and control the growth of unfavorable microorganisms. In this study, we carried out a comprehensive analysis of the change in the bacterial community and chemical composition during the lactic acid fermentation stage in kimoto-style seed mash preparation. The bacterial transitions were diverse at five sake breweries, but they exhibited three patterns. Lactobacillus sakei was the dominant species in the later stage of lactic acid fermentation in all sake breweries. This species was found to be the most important bacterium for the accumulation of lactic acid, because its average production rate of lactic acid in seed mash reached 4.44 × 10⁻¹¹ mg cell−1 h−1, which is 10 times higher than those of other species. As a result of specific growth rate analysis, it was revealed that the growth rate of L. sakei was influenced by the strain, pH, and temperature. The effects of pH and temperature were explained by the square root model, and the result indicates that the strains isolated in this study were incapable of growth below pH 3.9. The growth curve predicted using the growth model fit the actual cell density in two out of five sake breweries; however, our model did not work well for the remaining three sake breweries, and we presume that the error was caused by the strain or an unknown factor.
IMPORTANCE It is important to produce lactic acid in kimoto-style seed mash; however, the bacterial transition is different depending on the sake brewery. The reason why there are diverse bacterial transitions during kimoto-style seed mash preparation for each sake brewery is unclear so far, and it causes difficulty in starting kimoto-style seed mash. Our findings indicate that the changes in pH caused by lactic acid bacteria grown prior to L. sakei in seed mash influence the growth of L. sakei and are related to the diversity of the bacterial transition. This study uses comprehensive analytical methods to reveal that there is a diversity of bacterial transition and chemical compositions in kimoto-style seed mash depending on the sake brewery and to explain the differences in bacterial transition depending on the characteristics of L. sakei.
INTRODUCTION
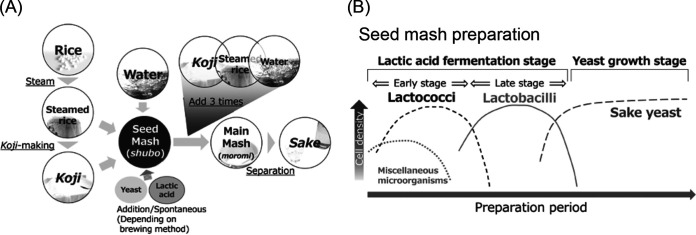
Sake is a traditional alcoholic drink in Japan that is fermented from rice. It is made from rice, koji, and water. An overview of the procedure for making sake is shown in Fig. 1A. Briefly, koji is prepared by growing Aspergillus oryzae on steamed rice, and koji provides enzymes that break down protein and starch. Next, a fermentation starter (seed mash, or shubo in Japanese) that sufficiently propagates yeasts is prepared by mixing steamed rice, koji, and water (as well as lactic acid and cultured yeast in modern methods), and then the steamed rice, koji, and water are added to the seed mash three times over the course of 4 days to avoid diluting the density of the yeast. The final mixture (main mash, or moromi in Japanese) is usually fermented for 3 to 5 weeks. Finally, the main mash is separated into sake and sake cake by a filter press. We can separate the types of seed mash into two categories based on the source of the lactic acid that they contain. In one type, lactic acid is added to the seed mash when the ingredients are mixed, and this is known as sokujo. In the other type, lactic acid is produced by lactic acid bacteria before alcohol fermentation, and this is known as kimoto style. The process for making kimoto-style seed mash is the traditional method, and the sake made with kimoto-style seed mash is said to have unique characteristics of flavor and taste. The lactic acid inhibits the growth of undesirable microorganisms; therefore, it is important to grow lactic acid bacteria and produce lactic acid stably when preparing kimoto-style seed mash. Previous studies revealed that a bacterial succession as described below occurs during the preparation of kimoto-style seed mash, and a theory about bacterial transition was established (Fig. 1B) (1–3) as follows. First, lactic acid cocci grow at the start of the process at a low temperature (5 to 7°C), and then lactic acid bacilli that require various amino acids for their growth grow posterior to the lactic acid cocci as amino acids are provided by the degradation of the rice and koji. Masuda et al. demonstrated that the kimoto-style seed mash preparation goes through this succession using culture-dependent and culture-independent techniques (4). However, hygiene management and the microbiome in sake breweries have changed, and some studies have reported that in several sake breweries the changes in lactic acid bacteria mentioned above were not found (5, 6). It is possible that the change in the brewing environment is linked to the diversification of bacterial succession during kimoto-style seed mash preparation. Therefore, we speculate that the change in the bacterial and chemical components during seed mash preparation differs among sake breweries. Such differences may contribute to the brewery-dependent characteristics of sake. However, no study has investigated the bacterial succession in two or more sake breweries.
FIG 1.
(A) Overview of production process of sake. (B) Conceptual diagram of microbial transition during seed mash preparation.
In this study, we analyzed kimoto-style seed mash made at five sake breweries to elucidate the succession of bacterial diversity and chemical composition during starter culture preparation and to reveal the characteristics that depend on the sake brewery.
RESULTS
Kimoto-style seed mash preparation.
Changes in pH, titratable acidity, amino acid content (formol nitrogen), density, and lactic acid concentration during preparation are shown in Fig. S1 in the supplemental material. Their profiles were different depending on the sake brewery.
Bacterial succession during kimoto making.
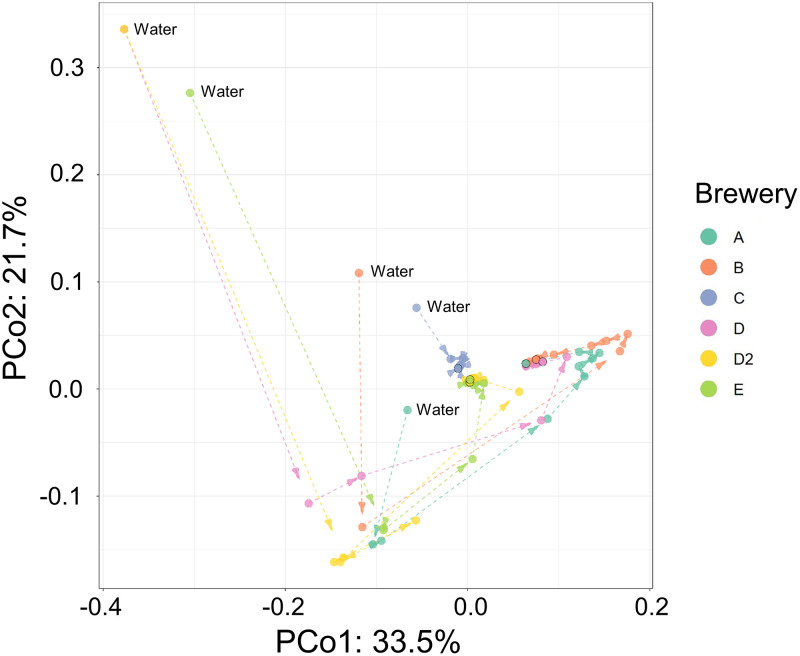
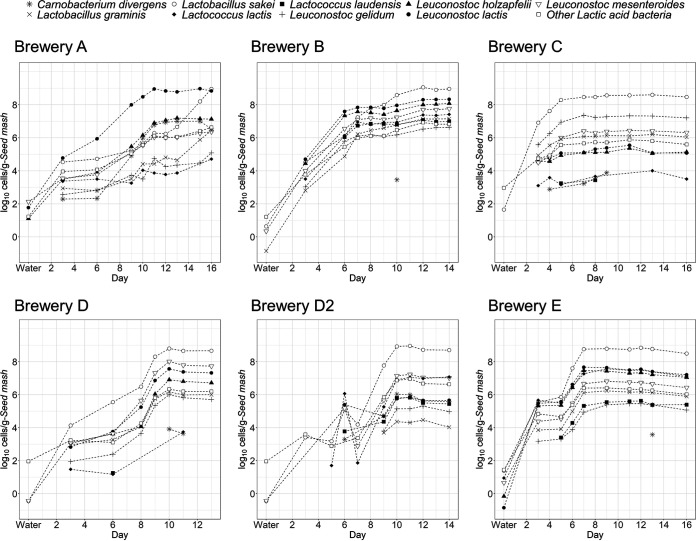
We analyzed the comprehensive bacterial population of the water and the bacterial community succession during fermentation starter preparation using next-generation sequencing (NGS). An overview of the obtained data is shown in Table S1. More than 2,500 species were identified, and the bacterial community in water was the most diverse community in all of the sake breweries. We calculated the Shannon index, performed weighted UniFrac analysis (Fig. 2 and Fig. S2), and evaluated the succession of bacterial diversity during the manufacturing process. The results indicated that the diversity decreased as time went by, and the bacterial community at the later stage of lactic acid fermentation in the seed mash preparation at each sake brewery was similar. We quantified the bacterial population of each sample using the calculation method in accordance with our previous study and visualized the bacterial population as a heatmap (Fig. 3). Eighteen genera showed cell densities exceeding more than 106 cells/g during the manufacturing process in at least one of the sake breweries, and two species (L. sakei and Leuconostoc mesenteroides) showed a density of more than 106 cells/g from all of the sake breweries (Fig. 3B). An especially dominant species at the later stage of preparation was L. sakei, and its cell density reached 109 cells/g. Nine species of lactic acid bacteria exceeded 107 cells/g in cell density during preparation in some sake breweries (Fig. 4), and the bacterial transition from cocci to bacilli reported previously was found in only two sake breweries (breweries A and B). L. mesenteroides was present at a cell density over 106 cells/g in all sake breweries, but the densities of other lactic acid cocci (Leuconostoc lactis or Leuconostoc gelidum) were greater than that of L. mesenteroides in most of the sake breweries.
FIG 2.
Plot of weighted UniFrac distance made using principal coordinate analysis. The arrows connecting to each point indicate the time variation in each batch. The last sampling day in each sake brewery is emphasized with a black circle.
FIG 3.
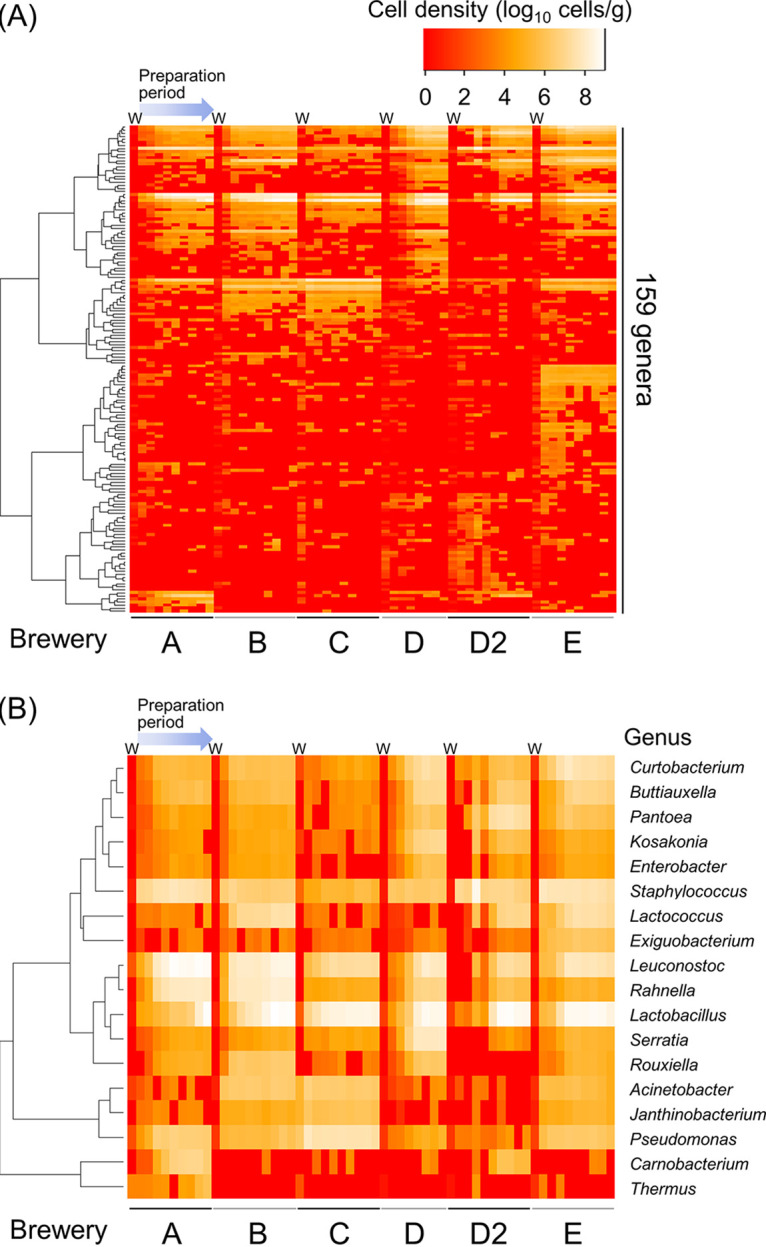
Changes in bacterial cell density during the seed mash preparation process. Columns with a W at the top show the results of quantifying the cell density of the brewing water. (A) Genera in which the cell density was 100 cells/g or above at more than two sampling points in each batch. (B) Genera in which the cell density was 106 cells/g or above during the preparation process in any one or more sake breweries.
FIG 4.
Changes of bacterial cell density of the top nine lactic acid bacteria during seed mash preparation process.
Changes in chemical composition during kimoto making.
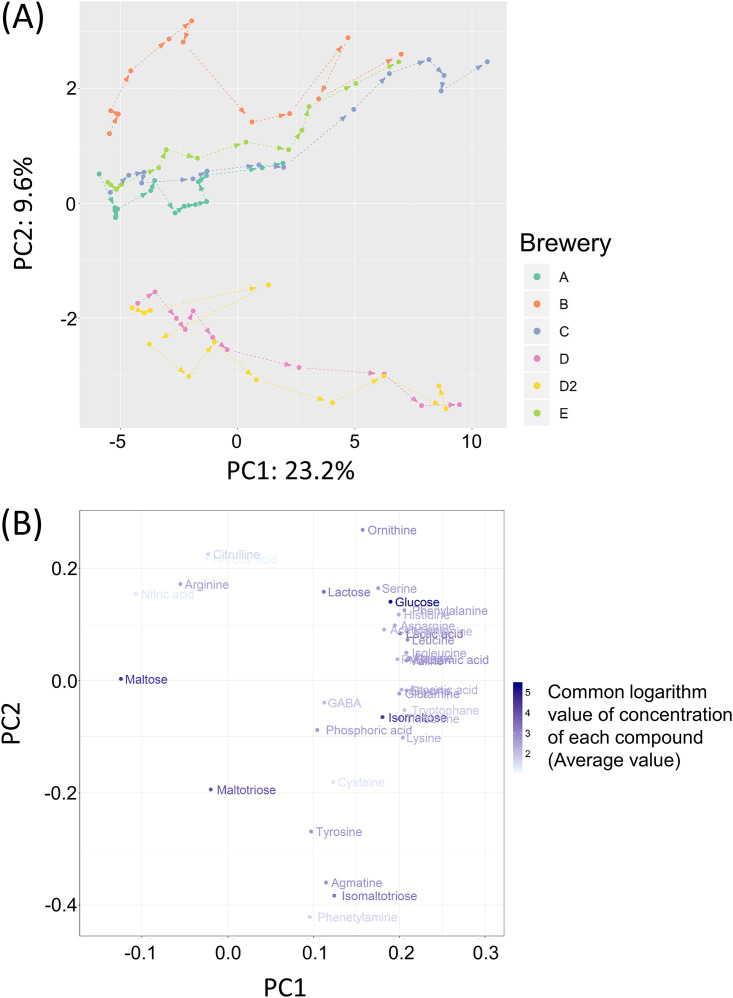
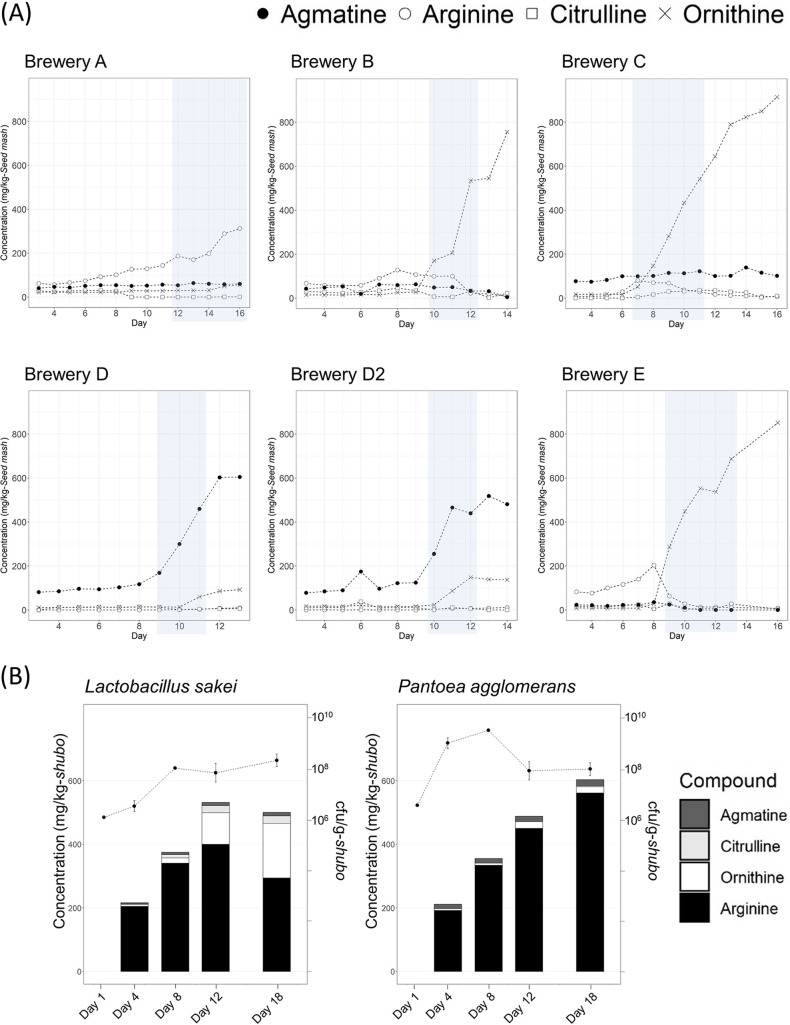
We investigated the changes of 51 compounds during the preparation of seed mash (Table S2). Most compounds tended to increase over time, but some compounds, especially maltose, decreased as the seed mash preparation progressed. For 15 of the 51 compounds (rhamnose, fucose, arabinose, xylose, citric acid, pyruvic acid, malic acid, succinic acid, fumaric acid, pyroglutamic acid, 2-aminobutyric acid, 3-aminobutyric acid, tryptamine, isoamylamine, and putrescine), the concentration of the compounds in all or most of the samples was very low (<1.0 mg/kg of seed mash) or below the limit of quantification of our analysis method. Therefore, principal component analysis was carried out using 36 compounds after omitting 15 compounds as mentioned above (Fig. 5). As a result of the score plot, first principal component explained the time course and the second principal component explained the difference among sake breweries. The loading plot indicated that some compounds (phenetylamine, isomaltotriose, agmatine, tyrosine, maltotriose, nitrous acid, ornithine, citrulline, and lactose) contributed to the differences among sake breweries. In particular, the amounts of citrulline, ornithine, and agmatine differed significantly depending on the sake brewery, and the maximum amounts of ornithine and agmatine reached 0.9 g/liter and 0.6 g/liter, respectively. The concentration of arginine decreased over time in the breweries where the concentration of ornithine or agmatine, both of which are metabolites from arginine, was increased (Table S2). The changes in the concentrations of arginine, citrulline, ornithine, and agmatine in each brewery are shown in Fig. 6. Their changes fit one of three profiles, as follows. (i) The concentration of arginine increased as the preparation progressed (brewery A). (ii) The concentration of ornithine increased as the preparation progressed (breweries B, C, and E). (iii) The concentration of agmatine increased as the preparation progressed (breweries D and D2).
FIG 5.
Principal component analysis of chemical components in seed mash. (A) Score plot of each sample. (B) Loading plot indicates the loading of each compound. The color depth of each compound indicates the concentration of each compound.
FIG 6.
(A) Temporal changes of concentrations of arginine and arginine-related metabolites in each sake brewery. In the periods shaded gray, we tried to identify the bacterium that was responsible for metabolizing arginine. (B) Temporal changes in the concentrations of arginine and arginine-related metabolites and in the cell density of Lactobacillus sakei or Pantoea agglomerans in small-scale seed mash preparation. The y axis on the left side indicates the concentration of arginine or arginine-related metabolites, and the y axis on the right side indicates the cell density of each bacterium.
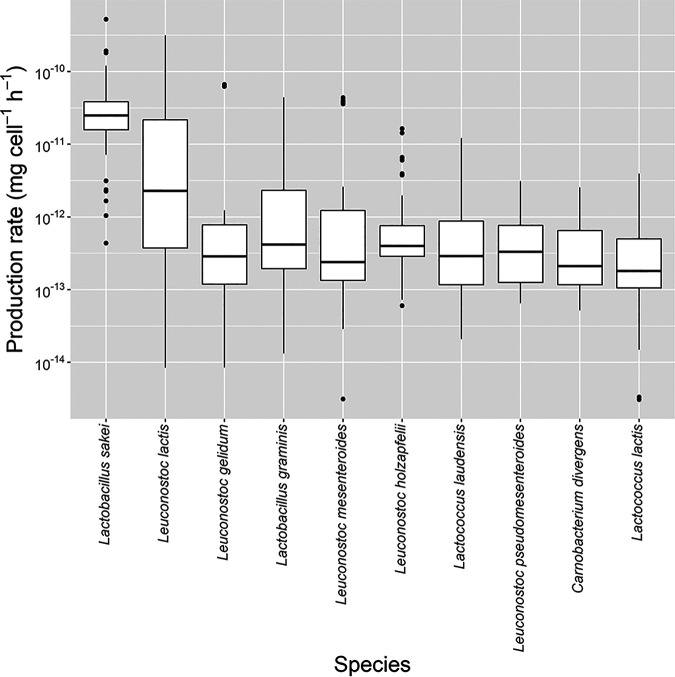
Additionally, the change in the concentration of lactic acid was also different depending on the sake brewery (Fig. S1 and Table S2). We calculated the lactic acid production rate of each bacterium between sampling times based on cell density, time, and the increased amount of lactic acid using linear programming (Fig. 7). The most important bacterium that contributed to lactic acid production was found to be L. sakei, and the maximum and average lactic acid production rate of L. sakei was 5.25 × 10⁻¹⁰ mg cell−1 h−1 and 4.44 × 10⁻¹¹ mg cell−1 h−1, respectively. On the other hand, the growth of L. sakei was inhibited by the addition of lactic acid in the seed mash (Fig. S3), and the result indicated that the growth of L. sakei was influenced by the value of pH.
FIG 7.
Estimated production rate of lactic acid during seed mash preparation in five sake breweries.
Estimation of species related to arginine metabolism.
We narrowed down the species related to arginine metabolism based on a correlation between the number of species and the increase in ornithine or agmatine. Regarding the bacterium that is responsible for producing agmatine, we selected the genera that were detected in >106 cells/g in the period when agmatine started to increase in brewery D (batch 1, from day 9 to day 11; batch 2, from day 10 to day 12) and <106 at the later stage (from day 12 to day 16) in brewery A. On the other hand, we selected the genera that were detected in >106 cells/g in the period when ornithine started to increase in breweries B, C, and E (B, from day 1 to day 12; C, from day 7 to day 11; E, from day 9 to day 13) as the bacterium that was responsible for producing ornithine. The genera selected as responsible for producing ornithine were Lactobacillus and Leuconostoc, and the genus extracted as responsible for producing agmatine was Pantoea. As a result of quantitative PCR (qPCR) of arginine deiminase, we presumed that L. sakei was mainly responsible for the decrease of arginine (data not shown). The production activity of agmatine or ornithine in each bacterium was evaluated by a production activity test, which was performed by adding each bacterium to medium containing a sufficient concentration of arginine (Fig. 6). The result indicated that L. sakei produced ornithine. On the other hand, P. agglomerans was not relevant to the accumulation of agmatine, and we have not found the responsible microorganisms yet.
Modeling of growth curve of L. sakei and its growth prediction.
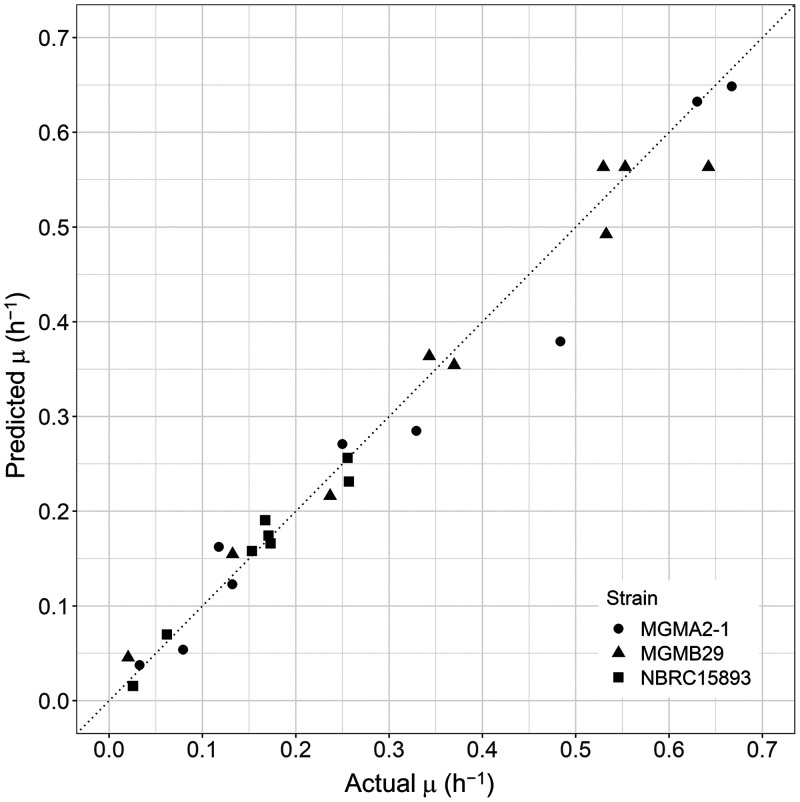
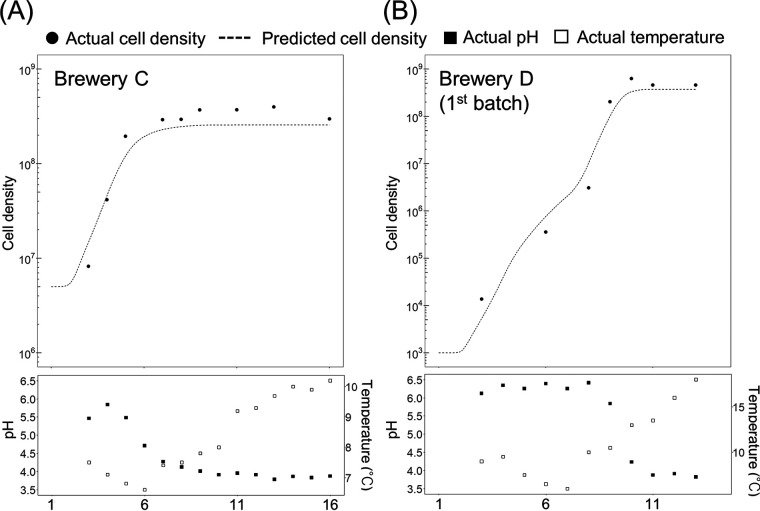
First, we isolated lactic acid bacteria from the seed mash and identified the isolates based on a partial sequence of the small subunit (SSU) rRNA gene (Fig. S4). We used the isolates identified as L. sakei for the analysis of the specific growth rate as follows. We calculated the specific growth rate of L. sakei under various conditions (Table 1) and developed a regression model of the specific growth rate. The specific growth rate of L. sakei was explained by a square root model in which temperature and pH were used as variables (Fig. 8), and its root-mean-square error was 0.033. The developed model indicated that each strain had a different parameter, and two strains isolated from a sake brewery and our institute were not able to grow below pH 3.9 (Table 2). As a result of the prediction of the cell density of L. sakei during seed mash preparation in all sake breweries using the model, we were able to predict the growth of L. sakei during preparation in breweries C and D when we chose the appropriate parameter for prediction (Fig. 9). On the other hand, the cell density in the remaining three sake breweries could not be fitted precisely, so there may be further unknown factors that are needed for prediction.
TABLE 1.
Conditions used to study strains
| Strain | pH | T (K) | μ (h−1) |
|---|---|---|---|
| MGMA2-1 | 5.70 | 280.0 | 0.03 |
| 5.70 | 286.0 | 0.13 | |
| 5.70 | 293.0 | 0.33 | |
| 4.10 | 303.0 | 0.08 | |
| 4.40 | 303.0 | 0.12 | |
| 4.70 | 303.0 | 0.25 | |
| 5.00 | 303.0 | 0.48 | |
| 5.70 | 303.0 | 0.63 | |
| 6.40 | 303.0 | 0.67 | |
| MGMB29 | 5.70 | 280.0 | 0.02 |
| 5.70 | 286.0 | 0.13 | |
| 5.70 | 293.0 | 0.34 | |
| 4.40 | 303.0 | 0.24 | |
| 4.70 | 303.0 | 0.37 | |
| 5.00 | 303.0 | 0.53 | |
| 5.70 | 303.0 | 0.55 | |
| 6.10 | 303.0 | 0.64 | |
| 6.40 | 303.0 | 0.53 | |
| NBRC15893 | 5.70 | 286.0 | 0.03 |
| 5.70 | 293.0 | 0.06 | |
| 5.00 | 303.0 | 0.15 | |
| 5.10 | 303.0 | 0.17 | |
| 5.20 | 303.0 | 0.17 | |
| 5.40 | 303.0 | 0.17 | |
| 5.90 | 303.0 | 0.26 | |
| 6.40 | 303.0 | 0.26 |
FIG 8.
Evaluation of specific growth rate prediction model of each strain. The x axis indicates the actual value, and the y axis indicates the predicted value.
TABLE 2.
Growth characteristics of strainsa
| Strain | Tmin (K) | pHmin | k | μmax (h−1) |
|---|---|---|---|---|
| MGMA2-1 | 272.9 | 3.95 | 0.0198 | 0.65 |
| MGMB29 | 272.9 | 3.91 | 0.0225 | 0.56 |
| NBRC15893 | 279.5 | 3.21 | 0.0123 | 0.26 |
Formula: .
FIG 9.
Prediction of cell density of Lactobacillus sakei. (A) The cell density of L. sakei in brewery C was calculated using the constant values obtained from analyzing strain MGMB29. (B) The cell density of L. sakei in brewery D was calculated using constant values obtained from analyzing strain MGMA2-1. The conditions (temperature and pH) used for prediction in each sake brewery are shown in the lower diagram.
DISCUSSION
A previous study suggested a convincing theory, namely, that L. mesenteroides, which can grow under low nutrient conditions, increases in the fermentation starter prior to the growth of L. sakei, and L. sakei then boosts it after the rice is degraded by koji enzymes (Fig. 1B) (1–3). In fact, a recent study demonstrated that the transition occurred under actual brewing conditions (4). On the other hand, some other studies reported that there were some cases in which the genus Leuconostoc was not detected during the manufacturing process, or, contrarily, the genus Lactobacillus was not detected (5–7). This diversity of bacterial transition makes it more difficult for sake breweries to make kimoto-style seed mash for the first time. In this study, we investigated the succession of the microbial community and changes in chemical components during the preparation of kimoto-style seed mash.
Regarding bacterial transition, the bacterial community in the water at each sake brewery was very diverse, but the diversity decreased over time (see Fig. S2 in the supplemental material). This result indicated that specific species (L. sakei and L. mesenteroides) became dominant in all sake breweries. In particular, the most abundant species that all sake breweries had in common on the last sampling day was L. sakei; however, the growth rate of L. sakei or the amounts of other bacteria were different depending on the sake brewery (Fig. 3). This difference in the bacterial transition influenced the chemical components, especially the lactic acid and the compounds related to arginine metabolism (Table S2). The bacterial transition fit one of three profiles based on the growth profile of rod-shaped lactic acid bacteria and spherical lactic acid bacteria (Fig. 4). In the first profile, spherical lactic acid bacteria remain more numerous than rod-shaped lactic acid bacteria through most of the manufacturing process (brewery A). In the second profile, spherical lactic acid bacteria are more numerous in the early stage but rod-shaped lactic acid bacteria become more numerous than spherical lactic acid bacteria in the middle stage, and then rod-shaped lactic acid bacteria become the dominant species (brewery B). In the third profile, rod-shaped lactic acid bacteria remain more numerous than spherical lactic acid bacteria throughout the manufacturing process (breweries C to E). The changes in the concentration of lactic acid were different depending on the sake brewery, and the concentration of lactic acid tended to increase rapidly after rod-shaped lactic acid bacteria (especially L. sakei) had grown. This result is consistent with the previous theory that proposed that most lactic acid is produced by L. sakei (8). We calculated the production rate of lactic acid of each bacterium (Fig. 7). The average lactic acid production rate of L. sakei reached 4.44 × 10⁻¹¹ mg cell−1 h−1, and it was 10 times greater than that of other lactic acid bacteria. Therefore, it is important to allow L. sakei to grow so that sufficient lactic acid accumulates in the seed mash, but the growth profiles of L. sakei were different depending on the sake brewery. We tried to reveal the reason that the growth of L. sakei differed in each sake brewery. Actually, the theory mentioned above suggested that some kinds of nitrate-reducing bacteria grow and produce nitrous acid at the initial stage of seed mash preparation, and nitrous acid inhibits the growth of L. mesenteroides. However, we decided not to consider nitrate-reducing bacteria and the concentration of nitrous acid in this study, because a previous study reported that the growth of L. sakei generally is not influenced significantly under the concentration of nitrous acid in kimoto-style seed mash (9). As a result of the analysis of the specific growth rate of L. sakei under various culture conditions, the specific growth rate of L. sakei was influenced by pH and temperature, and the square root model could describe the relationship between the culture conditions and specific growth rate. The influence of pH and temperature on the specific growth rate was different among strains, and the characteristics of a strain may contribute to the diversity of bacterial transition during the preparation of seed mash. Actually, we could predict the growth of L. sakei during the preparation of seed mash in breweries C and D well, but those in breweries A, B, and E were not predicted precisely. We need to analyze more strains and investigate whether other factors in seed mash influence the growth of L. sakei or not to increase the prediction accuracy.
The temporal change in the chemical composition was also different depending on the sake brewery (Fig. 5). Previous studies that investigated the components during seed mash preparation or the main fermentation process referred to the possibility that several compounds contribute to the taste of sake, such as the umami taste (10, 11), and the difference in chemical composition may contribute to the difference in the taste of sake among sake breweries. The loading plot showed that maltose decreased consistently in all sake breweries over time. Lactose tended to increase, but the rate of increase was different among sake breweries. Interestingly, arginine and some compounds related to arginine metabolism were significantly different depending on the sake brewery, and our result indicated that L. sakei metabolized arginine to ornithine. Previous studies reported that L. sakei produced ornithine from arginine (12–15), which is consistent with the result obtained in this study. However, the microorganism that metabolized arginine to agmatine is still unknown. Arena et al. reported that a specific strain of Lactobacillus is able to produce agmatine (16), and Akasaka et al. reported that the A. oryzae strain used in koji making is capable of agmatine production under solid-state cultivation at low pH (17). There is a possibility that Lactobacillus or A. oryzae contributes to agmatine production during the preparation of seed mash. Further study is needed on this issue.
In this study, our findings revealed that there were several types of bacterial transitions during kimoto-style seed mash preparation. This difference in bacterial transition may contribute to the concentrations of not only lactose, arginine, ornithine, and agmatine but also those of most compounds related to flavor or taste. Previous studies demonstrated that the growth of L. sakei required specific nutrients, such as tripeptide or fatty acid, and there is a possibility that the concentration of those compounds affects the growth of L. sakei (18–20). Our findings demonstrated that the growth of L. sakei during the preparation of seed mash was influenced not only by specific nutrients but also by temperature, strain, and especially pH. Actually, the growth of L. sakei was inhibited by the addition of lactic acid in the experiment using small-scale seed mash (Fig. S3). Additionally, the growth of L. sakei was inhibited when L. mesenteroides grew prior to L. sakei (Fig. S5). These results suggest that the growth of other lactic acid bacteria at the early stage of preparation probably affects the pH gradually, and the growth of L. sakei is inhibited by the decreasing pH. This study reveals that there is a diversity of bacterial transition and chemical compositions during the production of kimoto-style seed mash depending on the sake brewery using comprehensive analytical methods and to explain the differences in the bacterial transition. We have presumed that the growth of other lactic acid bacteria, such as Leuconostoc bacteria, has an effect on the growth of L. sakei through changing the pH value (Fig. S5). It was considered that the growth profile of L. sakei had a great impact on the overall bacterial transition, because L. sakei accounted for the majority of the bacterial community in the later stages of seed mash preparation in most sake breweries in this study. Therefore, we concluded that the lactic acid bacteria growing prior to L. sakei contribute to a variety of bacterial changes in sake breweries by affecting the growth of L. sakei. However, the growth characteristics of other lactic acid bacteria, especially those of the genus Leuconostoc, are not clear yet. We need to perform further studies to develop a method for controlling L. sakei and other lactic acid bacteria during kimoto-style seed mash preparation.
MATERIALS AND METHODS
Samples analyzed in this study.
Samples of kimoto-style seed mash were provided by five sake breweries (breweries A to E) in Japan. Two sake breweries are located in east Japan, and the others are located in west Japan. One batch of kimoto from each of four of the sake breweries and two batches from one sake brewery were used for sampling. Each sake brewery sampled approximately 30 ml of water used for the starter culture and 20 to 30 g of their kimoto-style seed mash. The samples were frozen immediately and stored until analysis.
Bacterial strains used in this study.
Lactobacillus sakei NBRC15893 and Pantoea agglomerans NBRC102470 were purchased from the National Institute of Technology and Evaluation, Japan. L. sakei strains MGMA2-1 and MGMB29 were isolated from kimoto-style seed mash made by our institute and by a sake brewery (brewery F), respectively. The partial sequence of a small subunit (SSU) rRNA gene of each strain determined in this study was deposited in the DNA Data Bank of Japan.
DNA extraction from kimoto-style seed mash.
We separated microorganisms from the samples by the following method. First, 2 g of sample was weighed out into a 50-ml conical polypropylene tube (Corning, Inc., Corning, NY), and 18 ml of phosphate-buffered saline was added into the conical tube. They were mixed by a vortex mixer for 15 min and then centrifuged at 100 × g for 5 min. After centrifugation, 5 ml of the supernatant was transferred into a new 15-ml conical polypropylene tube (Corning, Inc.) immediately. The supernatant was centrifuged at 10,000 × g for 10 min, and we discarded the supernatant. Finally, we extracted microbial DNA from the pellet using a spin column DNA extraction with bead beating method (Nucleospin soil kit; Macherey-Nagel, Düren, Germany) according to the manufacturer’s instructions.
qPCR.
We quantified the total amount of SSU rRNA using a LightCycler 96 (Roche, Basel, Switzerland) based on a previous study (21). The PCR was carried out in a total volume of 20 μl using FastStart essential DNA probe master mix (Roche) containing 2 μl of template DNA solution, 100 nM forward (TCCTACGGGAGGCAGCAGT) and reverse (GGACTACCAGGGTATCTAATCCTGTT) primers, and a hydrolysis probe ([6-carboxyfluorescein]-CGTATTACCGCGGCTGCTGGCAC-[6-carboxytetramethylrhodamine]) for the quantification of the SSU rRNA gene. The thermal cycler program was 95°C for 10 min and 40 cycles at 95°C for 15 s and 60°C for 60 s. We prepared a standard curve for the SSU rRNA gene by using plasmid pCR4Blunt-TOPO containing the SSU rRNA gene from Lactobacillus hilgardii (length, 5,489 bp).
SSU rRNA gene amplicon analysis using next-generation sequencing.
Next-generation sequencing analysis was carried out by FASMAC Co., Ltd. (Kanagawa, Japan). We sent genomic DNA extracted from the samples to FASMAC, and they prepared sequencing libraries and carried out sequencing analysis as follows. The PCR was carried out in a total volume of 20 μl using TaKaRa Ex Taq HS (TaKaRa Bio, Inc., Kusatsu, Japan) containing a forward (CCTACGGGNGGCWGCAG) and reverse (GACTACHVGGGTATCTAATCC) primer set. The PCR was performed two times. The thermal cycler program of the first PCR was 94°C for 2 min; 25 cycles at 94°C for 30 s, 50°C for 30 s, and 72°C for 30 s; and 72°C for 5 min. The amplicon of the first PCR was purified using AMPure XP. The PCR product then was amplified again under the same conditions and with a thermal program (94°C for 2 min; 10 cycles at 94°C for 30 s, 60°C for 30 s, and 72°C for 30 s; and 72°C for 5 min). The amplicon of the second PCR was also purified using AMPure XP. Paired-end sequencing analysis was performed using the MiSeq system (Illumina, Inc., San Diego, CA). The obtained data were treated using Sickle ver. 1.33, Fastx Toolkit ver. 0.0.13.2, FLASH ver. 1.2.10, and USEARCH ver. 8.0.1623_i86linux64.
Bacterial population analysis.
The obtained sequences (FASTA files) were identified with Quantitative Insights Into Microbial Ecology 1.8.0 (QIIME; http://qiime.org/) (22). We used default settings for each parameter for the microbiome analysis by QIIME except for the reference sequences for the taxonomy assignment. We identified the sequences obtained from next-generation sequencing (NGS) analysis by QIIME based on the Greengenes database, DNA Data Bank of Japan (DDBJ) 16S rRNA sequence data of prokaryotes downloaded from the DDBJ on 23 June 2017, and a sequence set downloaded from the National Center for Biotechnology Information (NCBI; BioProject no. PRJNA33175) on 22 June 2017. Basically, we assigned the taxonomy based on a sequence set downloaded from NCBI and checked the results of the assignment by comparing it with the results obtained from other reference databases. The abundance ratio of each bacterium in each seed mash sample was calculated from the total read counts and the read counts of each bacterium.
The number of cells per milliliter of bacteria was calculated as described in our previous research (23). Briefly, the total copy number obtained by qPCR was multiplied by the bacterial abundance ratio obtained from NGS analysis. The copy number of each bacterium was divided by the rRNA gene operon copy number of each bacterium obtained from the rRNA Operon Copy Number Database (https://rrndb.umms.med.umich.edu) (24). The total bacterial amount is the sum of all of the bacterial amounts.
Chemical component analysis.
We analyzed several indexes of fermentation management (titratable acidity, amino acid content [formol nitrogen], pH, and density), sugar (arabinose, fucose, glucose, isomaltose, isomaltotriose, lactose, maltose, maltotriose, rhamnose, and xylose), organic acid (acetic acid, citric acid, fumaric acid, lactic acid, malic acid, phosphoric acid, pyroglutamic acid, pyruvic acid, and succinic acid), inorganic acid (nitric acid and nitrous acid), amino acid (alanine, 2-aminobutanoic acid, 3-aminobutanoic acid, 4-aminobutanoic acid, arginine, asparagine, aspartic acid, citrulline, cysteine, glutamic acid, glutamine, glycine, histidine, isoleucine, leucine, lysine, methionine, ornithine, phenylalanine, proline, serine, threonine, tryptophan, tyrosine, and valine), and amines (agmatine, isoamylamine, phenethylamine, putrescine, and tryptamine). To determine the titratable acidity, amino acid content, pH, and density, the samples were centrifuged, and the supernatants were analyzed according to the official analysis method authorized by the Japanese National Tax Administration Agency (25). To analyze the other components, each component was extracted from the samples using an appropriate extraction buffer for each respective target compound, and then we performed high-performance liquid chromatography (HPLC). We describe the detailed extraction methods and HPLC conditions in the supplemental material.
Culture conditions of growth curve analysis.
Three strains of L. sakei were cultured in constant pH and temperature using a jar fermenter to develop a model for evaluating the influence of pH and temperature on the specific growth rate (Table 1). These strains were precultured in de Man Rogosa Sharpe medium two times, and then 1 ml of the preculture suspension was inoculated into 1 liter of pH- and density-adjusted koji medium (Boume 10.0). For preparation of the koji medium, we mixed 250 g of koji and 1 liter of ultrapure water and kept the mixture at 55°C for 12 to 16 h. The mixture then was centrifuged and filtered by filter paper (no. 2; Toyo Roshi Kaisha, Ltd., Tokyo, Japan). The koji medium in the jar fermenter was pH adjusted after autoclaving. We sampled the culture suspension aseptically and determined the number of CFU by the spiral plating method (EDDY JET2W; IUL Instruments, Barcelona, Spain).
Analysis of arginine metabolism by L. sakei and P. agglomerans.
We prepared seed mash using sterilized pregelatinized rice, koji, and water. The ingredients and each bacterium (approximately 1 × 10⁶ cells/g in the mixture) were mixed in a 50-ml conical polypropylene tube. The seed mash was placed at 9°C in an incubator for 17 days and sampled on day 4, day 8, day 12, and day 18 (day 1 represents the day the culture was started). The viable cells and concentrations of arginine-related compounds in the samples collected were determined by appropriate nutrient agar plating or ultrahigh-performance liquid chromatography mass spectrometry (UHPLC-MS) as described in the supplemental material.
Statistical analysis.
All statistical analysis was performed using the R language (http://www.R-project.org/) (26). The plots were generated using the ggplot2 package (27). Bacterial community analysis based on UniFrac distance was performed using the GUniFrac package (28–30). We estimated the lactic acid production rate using linear programming under some constraints as follows. First, the generation time and lactic acid production rate were constant between the sampling points. Second, the lactic acid production rate of each bacterium never exceeded 2.5 × 10⁻⁷ mg cell−1 h−1. Third, lactic acid was not metabolized by any bacterium. Fourth, the lactic acid production rate at the time the bacterium was growing and when the cell density reached a value that was closest to the highest cell density among the sampling points was assumed to be the maximum lactic acid production rate, and it was assumed that the lactic acid production rates at the other sampling points did not exceed this maximum production rate. Under the constraints, we calculated an appropriate lactic acid production rate based on the amount of each bacterium that existed in the seed mash, the time, and the increase in the amount of lactic acid between sampling points to minimize the residual sum of squares between the actual concentration and the predicted concentration of lactic acid (formulas are in the supplemental material). To generate the model of the specific growth rate, we calculated the specific growth rate of each condition and strain from the actual cell density and tried to fit it to a polynomial model or square root model.
Data availability.
The nucleotide sequence data reported in this study are available in the DDBJ/EMBL/GenBank databases under the accession numbers LC557029 and LC557030.
Supplementary Material
ACKNOWLEDGMENT
We express our sincere gratitude to all the sake breweries that provided the kimoto-style seed mash.
Footnotes
Supplemental material is available online only.
REFERENCES
- 1.Saito K. 1935. Study of bacteria found in sake starter (I). Jozogaku Zasshi 13:503–522. [Google Scholar]
- 2.Akiyama Y. 1978. A microbiological control of sake brewing from the standpoint of ecology of yeasts. J Ferment Technol Japan 56:618–629. [Google Scholar]
- 3.Ashizawa T. 1976. The mystery of Japanese sake brewing focused on kimoto. J Brew Soc Japan 71:424–427. [Google Scholar]
- 4.Masuda Y, Noguchi T, Takahashi T, Iguchi A, Osawa R, Mizogushi H. 2012. DGGE and PFGE analysis of lactic acid bacterial succession during Kimoto making. Seibutsu-Kogaku Kaishi 90:684–690. [Google Scholar]
- 5.Koyanagi T, Nakagawa A, Kiyohara M, Matsui H, Tsuji A, Barla F, Take H, Katsuyama Y, Tokuda K, Nakamura S, Minami H, Enomoto T, Katayama T, Kumagai H. 2016. Tracing microbiota changes in yamahai-moto, the traditional Japanese sake starter. Biosci Biotechnol Biochem 80:399–406. doi: 10.1080/09168451.2015.1095067. [DOI] [PubMed] [Google Scholar]
- 6.Bokulich NA, Ohta M, Lee M, Mills DA. 2014. Indigenous bacteria and fungi drive traditional kimoto sake fermentations. Appl Environ Microbiol 80:5522–5529. doi: 10.1128/AEM.00663-14. [DOI] [PMC free article] [PubMed] [Google Scholar]
- 7.Momose H, Kamao A. 1993. Lactic acid cocci isolated from Moto (Sake starter) prepared by traditional method. J Brew Soc Japan 88:76–80. doi: 10.6013/jbrewsocjapan1988.88.76. [DOI] [Google Scholar]
- 8.Kitahara K (ed). 1966. Studies on lactic acid bacteria. Tokyodaigaku Shuppankai, Tokyo, Japan. [Google Scholar]
- 9.Ashizawa H, Saito Y. 1966. Microbiological study on yamahai-style seed mash. J Brew Soc Japan 61:1033–1037. [Google Scholar]
- 10.Tatsukami Y, Morisaka H, Aburaya S, Aoki W, Kohsaka C, Tani M, Hirooka K, Yamamoto Y, Kitaoka A, Fujiwara H, Wakai Y, Ueda M. 2018. Metabolite profiling of the fermentation process of “yamahai-ginjo-shikomi” Japanese sake. PLoS One 13:e0190040. doi: 10.1371/journal.pone.0190040. [DOI] [PMC free article] [PubMed] [Google Scholar]
- 11.Taniguchi M, Takao Y, Kawasaki H, Yamada T, Fukusaki E. 2020. Profiling of taste-related compounds during the fermentation of Japanese sake brewed with or without a traditional seed mash (kimoto). J Biosci Bioeng 130:63–70. doi: 10.1016/j.jbiosc.2020.02.017. [DOI] [PubMed] [Google Scholar]
- 12.Chaillou S, Champomier–Vergès MC, Cornet M, Crutz–Le Coq AM, Dudez AM, Martin V, Beaufils S, Darbon–Rongère E, Bossy R, Loux V, Zagorec M. 2005. The complete genome sequence of the meat-borne lactic acid bacterium Lactobacillus sakei 23K. Nat Biotechnol 23:1527–1533. doi: 10.1038/nbt1160. [DOI] [PubMed] [Google Scholar]
- 13.Rimaux T, Rivière A, Illeghems K, Weckx S, De Vuyst L, Leroy F. 2012. Expression of the arginine deiminase pathway genes in Lactobacillus sakei is strain dependent and is affected by the environmental pH. Appl Environ Microbiol 78:4874–4883. doi: 10.1128/AEM.07724-11. [DOI] [PMC free article] [PubMed] [Google Scholar]
- 14.Nishio A. 2016. Development of low alcohol sake containing high level functional amino acid ornithine. Rep Tottori Inst Indust Technol 19:31–34. [Google Scholar]
- 15.Tsuji A, Kozawa M, Tokuda K, Enomoto T, Koyanagi T. 2018. Robust domination of Lactobacillus sakei in microbiota during traditional Japanese sake starter yamahai-moto fermentation and the accompanying changes in metabolites. Curr Microbiol 75:1498–1505. doi: 10.1007/s00284-018-1551-8. [DOI] [PubMed] [Google Scholar]
- 16.Arena ME, de Nadra MC. 2001. Biogenic amine production by Lactobacillus. J Appl Microbiol 90:158–162. doi: 10.1046/j.1365-2672.2001.01223.x. [DOI] [PubMed] [Google Scholar]
- 17.Akasaka N, Kato S, Kato S, Hidese R, Wagu Y, Sakoda H, Fujiwara S. 2018. Agmatine production by Aspergillus oryzae is elevated by low pH during solid-state cultivation. Appl Environ Microbiol 84:e00722-18. doi: 10.1128/AEM.00722-18. [DOI] [PMC free article] [PubMed] [Google Scholar]
- 18.Terakawa E, Nozawa M, Mizoguchi H, Hara S. 1998. Abstr 50th Soc Biotechnol, abstr 325, p 34.
- 19.Terakawa E, Mizoguchi H, Hara S. 1999. Abstr Brewing Soc Japan Annual Meeting, abstr 14.
- 20.Yamaji E, Furukawa K, Mizoguchi H, Hara S. 2005. Growth factors required for the predominant of Lactobacillus sakei over Leuconostoc mesenteroides in kimoto. J Brew Soc Japan 100:281–288. doi: 10.6013/jbrewsocjapan1988.100.281. [DOI] [Google Scholar]
- 21.Nadkarni MA, Martin FE, Jacques NA, Hunter N. 2002. Determination of bacterial load by real-time PCR using a broad-range (universal) probe and primers set. Microbiology 148:257–266. doi: 10.1099/00221287-148-1-257. [DOI] [PubMed] [Google Scholar]
- 22.Caporaso JG, Kuczynski J, Stombaugh J, Bittinger K, Bushman FD, Costello EK, Fierer N, Gonzalez PA, Goodrich JK, Gordon JI, Huttley GA, Kelley ST, Knights D, Koenig JE, Ley RE, Lozupone CA, McDonald D, Muegge BD, Pirrung M, Reeder J, Sevinsky JR, Turnbaugh PJ, Walters WA, Widmann J, Yatsunenko T, Zaneveld J, Knight R. 2010. QIIME allows analysis of high-throughput community sequencing data. Nat Methods 7:335–336. doi: 10.1038/nmeth.f.303. [DOI] [PMC free article] [PubMed] [Google Scholar]
- 23.Takahashi M, Kita Y, Mizuno A, Goto-Yamamoto N. 2017. Evaluation of method bias for determining bacterial populations in bacterial community analyses. J Biosci Bioeng 124:476–486. doi: 10.1016/j.jbiosc.2017.05.007. [DOI] [PubMed] [Google Scholar]
- 24.Stoddard SF, Smith BJ, Hein R, Roller BR, Schmidt TM. 2015. rrnDB: improved tools for interpreting rRNA gene abundance in bacteria and archaea and a new foundation for future development. Nucleic Acids Res 43:D593–D598. doi: 10.1093/nar/gku1201. [DOI] [PMC free article] [PubMed] [Google Scholar]
- 25.The Brewing Society of Japan. 1993. The annotation of the official analytical methods of the National Tax Agency of Japan, 4th ed. The Brewing Society of Japan, Tokyo, Japan. [Google Scholar]
- 26.R Core Team. 2019. R: a language and environment for statistical computing. R Foundation for Statistical Computing, Vienna, Austria. https://www.R-project.org/. [Google Scholar]
- 27.Wickham H. 2016. ggplot2: elegant graphics for data analysis. Springer-Verlag, New York, NY. [Google Scholar]
- 28.Lozupone C, Knight R. 2005. UniFrac: a new phylogenetic method for comparing microbial communities. Appl Environ Microbiol 71:8228–8235. doi: 10.1128/AEM.71.12.8228-8235.2005. [DOI] [PMC free article] [PubMed] [Google Scholar]
- 29.Chen J, Bittinger K, Charlson ES, Hoffmann C, Lewis J, Wu GD, Collman RG, Bushman FD, Li H. 2012. Associating microbiome composition with environmental covariates using generalized UniFrac distances. Bioinformatics 28:2106–2113. doi: 10.1093/bioinformatics/bts342. [DOI] [PMC free article] [PubMed] [Google Scholar]
- 30.Chen J. 2018. GUniFrac: generalized UniFrac distances. R package version 1.1. https://CRAN.R-project.org/package=GUniFrac.
Associated Data
This section collects any data citations, data availability statements, or supplementary materials included in this article.
Supplementary Materials
Data Availability Statement
The nucleotide sequence data reported in this study are available in the DDBJ/EMBL/GenBank databases under the accession numbers LC557029 and LC557030.


