

Metagenome assembly and the recovery of metagenome-assembled genomes (MAGs) have recently become common tasks for microbiome studies across environmental and clinical settings. However, the extent to which MAGs can capture the genes of the population they represent remains speculative.
KEYWORDS: genome recovery, genome completeness, metagenomes, assembly, gene abundance, metagenomics
ABSTRACT
The recovery of metagenome-assembled genomes (MAGs) from metagenomic data has recently become a common task for microbial studies. The strengths and limitations of the underlying bioinformatics algorithms are well appreciated by now based on performance tests with mock data sets of known composition. However, these mock data sets do not capture the complexity and diversity often observed within natural populations, since their construction typically relies on only a single genome of a given organism. Further, it remains unclear if MAGs can recover population-variable genes (those shared by >10% but <90% of the members of the population) as efficiently as core genes (those shared by >90% of the members). To address these issues, we compared the gene variabilities of pathogenic Escherichia coli isolates from eight diarrheal samples, for which the isolate was the causative agent, against their corresponding MAGs recovered from the companion metagenomic data set. Our analysis revealed that MAGs with completeness estimates near 95% captured only 77% of the population core genes and 50% of the variable genes, on average. Further, about 5% of the genes of these MAGs were conservatively identified as missing in the isolate and were of different (non-Enterobacteriaceae) taxonomic origin, suggesting errors at the genome-binning step, even though contamination estimates based on commonly used pipelines were only 1.5%. Therefore, the quality of MAGs may often be worse than estimated, and we offer examples of how to recognize and improve such MAGs to sufficient quality by (for instance) employing only contigs longer than 1,000 bp for binning.
IMPORTANCE Metagenome assembly and the recovery of metagenome-assembled genomes (MAGs) have recently become common tasks for microbiome studies across environmental and clinical settings. However, the extent to which MAGs can capture the genes of the population they represent remains speculative. Current approaches to evaluating MAG quality are limited to the recovery and copy number of universal housekeeping genes, which represent a small fraction of the total genome, leaving the majority of the genome essentially inaccessible. If MAG quality in reality is lower than these approaches would estimate, this could have dramatic consequences for all downstream analyses and interpretations. In this study, we evaluated this issue using an approach that employed comparisons of the gene contents of MAGs to the gene contents of isolate genomes derived from the same sample. Further, our samples originated from a diarrhea case-control study, and thus, our results are relevant for recovering the virulence factors of pathogens from metagenomic data sets.
INTRODUCTION
The recovery of complete or nearly complete genomes from metagenomes, or genome binning, is still a challenging bioinformatics task influenced by several factors such as microbial community diversity, sequencing effort, sequence read length, intrapopulation sequence and gene diversity, and the assembly and binning algorithms used. Several studies have successfully recovered metagenome-assembled genomes (MAGs) from metagenomic data sets (1–4), while other studies have cited high intrapopulation strain heterogeneity as the cause of failure to recover MAGs (2, 5–7). High (target) population abundance relative to the rest of the microbial community has also been identified as one reason for poor MAG recovery (7, 8). The recovery of reliable and complete or nearly-complete MAGs provides key data for several downstream analyses and research objectives, including the quantification of intrapopulation diversity (9). Intrapopulation diversity has been attributed to various genetic and evolutionary mechanisms, such as horizontal gene transfer (HGT) (2), lack of recent genome-wide and gene-specific sweeps (1), and neutral mutations (6). Reliable detection of such genetic events within a population based on—for instance—(metagenomic) read recruitment plots of MAGs (10) can provide new quantitative insights into the dynamics of intrapopulation gene diversity and identify the ecological and genetic mechanisms responsible for the diversity patterns observed. Therefore, it is important to further understand the limitations and strengths of genome binning and MAGs in assessing intrapopulation diversity.
Several pipelines have recently been developed to deal with these issues and to recover population genomes from metagenomic data sets with relatively high intrapopulation heterogeneity, and these pipelines have even allowed the reconstruction of individual strains (or genotypes) from such data sets (11, 12). For example, ConStrains (11) used single-nucleotide polymorphism (SNP) patterns in a set of universal genes to infer levels of intrapopulation diversity. DESMAN (12), on the other hand, identified core genes within MAGs or groups of MAGs of the same species and subsequently calculated variant positions within these genes to identify different strains and their relative abundances. Both of these pipelines were tested with mock and real (field) samples; typically, they performed better with the former and with low-diversity data sets (11, 12). Thus, how reliably SNPs and genes can be assigned to specific reference strains (genomes) by using these and other tools, especially with actual experimental data sets, remains speculative.
Mock data sets of known composition, such as those developed as part of the Critical Assessment of Metagenome Interpretation (CAMI) challenge (13), are not ideal for assessing the effects of intrapopulation heterogeneity, because only a single (or, at best, only a few) strain per species has typically been included during the DNA sequencing step or used to simulate data in these mock data sets. Hence, how well the results based on mock data sets translate to real, more-diverse data sets often remains unclear. Nonetheless, the results of the CAMI challenge provide valuable insights into the strengths and limitations of different software for specific research questions and tasks. Most notable, for genome binning, is the fact that different algorithms showed variable performances depending on the complexity of the data set and the presence or absence of closely related strains and populations (13, 14); no binning algorithm performed the best for all types of samples. However, in most comparisons, MaxBin 2.0 performed reliably and often outperformed other binning algorithms.
Our recent study of natural populations described a method to statistically identify genes of MAGs that are absent (i.e., none or <10% of the members of the population carry the gene) or variable (i.e., carried by some members of the population but not all) based on the sequence coverage of these genes by metagenomic short reads that represent the natural population under study relative to the core genes (carried by all or almost all members of the population, i.e., >90% of total members) (2). That is, our study provided an approach to quantify gene-level diversity within a population based on read recruitment of a reference genome that represents the population. This study also determined the reference genome/MAG sequence coverage needed in order to reliably detect such variable genes (as opposed to missing them by chance due to low sequence coverage) at about 7× or more, which agreed with the results of the CAMI challenge for reliably recovering target genes in a metagenomic assembly. Here, we employed this method and these thresholds for detecting isolate-specific and population-variable genes based on metagenomic read coverage.
In this paper, we aimed to advance the metagenomic workflow for assessing intrapopulation gene-level diversity and to provide an independent assessment of MAG quality that does not rely on the common practice of detecting the presence or absence and copy number of (a rather small number of) universal protein-coding genes or clade-specific core genes (15, 16). To this end, we focused on all the genes that were recovered (or not) by pathogenic Escherichia coli MAGs based on whole-genome comparisons of MAGs against their corresponding isolate genomes recovered from the same diarrheal stool sample. We also assessed the number of population-variable and core genes that were identified based on a read recruitment plot of an isolate genome but were not captured by the corresponding MAG. Therefore, we assessed the quality of the MAG based on the true- and false-positive gene recovery rates by using the isolate genomes as a reference, in addition to the common tools available for this purpose. The metagenomic data sets used in the study were previously reported as part of our survey of diarrheal cases in Ecuador and our typing of the etiological agents (17). Here, we used a small subset of these data sets in which the E. coli isolate available represented the etiological agent of diarrhea and was abundant enough in the corresponding data set to not limit assembly and genome binning (>10× coverage; see Table S1 in the supplemental material). Hence, our study also represents a relevant case for public health, because it assesses the limitations in recovering the full gene content of the etiological agent of diarrheal disease using metagenomics and genome binning.
RESULTS
Identification and quality of MAGs and isolate genomes.
In total, eight isolate-MAG pairs were analyzed from eight distinct human fecal samples (Tables 1 and 2; Fig. 1). The estimated completeness of the genomes based on the Microbial Genomes Atlas (MiGA) workflow ranged from 91% to 95.5% (average, 94.5%) for the isolates and from 81.1% to 95.5% (average, 92%) for the MAGs (Table 1). Contamination estimates were 0.0% for all isolate genomes (as expected for pure isolate DNA sequencing) and ranged from 0.9% to 7.2% for the MAGs. The high level of estimated completeness of all isolates was also consistent with the high sequencing depth of their genomes obtained by the genome reads (average, 22×) (Tables 1 and 2; Fig. 2). MAGs were recovered from the same sample as the isolate (no coassembly was performed), using the large contigs of the assembly (longer than 500 bp) and MaxBin 2.0 with default settings (see Materials and Methods for details). Genome-aggregate average nucleotide identity (ANI) within all isolate-MAG pairs was 98.9% or above, with an average of 99.77%, indicating that the MAGs obtained belonged to the same population as the isolates and were members of E. coli, with the exceptions of samples Q196 (97.63% ANI) and Q51 (96.99% ANI) (Table 3), in which the MAGs apparently represented a strain(s) of the population distinct from the isolate.
TABLE 1.
Properties of isolate genomes analyzed and metagenome-assembled genomesa
| Isolate | Metagenome | Group | No. of genes |
Completeness (%) |
Contamination (%) |
Quality (%) |
||||
|---|---|---|---|---|---|---|---|---|---|---|
| Isol | MAG | Isol | MAG | Isol | MAG | Isol | MAG | |||
| E158 | MG24 | DAEC | 4,931.0 | 6,158.0 | 94.6 | 88.3 | 0.0 | 0.9 | 90.1 | 83.8 |
| E124 | MG23 | DAEC | 5,026.0 | 4,611.0 | 95.5 | 95.5 | 0.0 | 0.9 | 91.0 | 91.0 |
| Q51 | MG31 | DAEC | 5,040.0 | 8,607.0 | 94.6 | 81.1 | 0.0 | 7.2 | 90.1 | 45.1 |
| B45 | MG6 | ETEC | 4,747.0 | 4,378.0 | 94.6 | 95.5 | 0.0 | 0.9 | 90.1 | 91.0 |
| E184 | MG19 | ETEC | 4,864.0 | 5,205.0 | 95.5 | 95.5 | 0.0 | 2.7 | 91.0 | 82.0 |
| E230 | MG25 | DAEC | 6,990.0 | 5,025.0 | 91.0 | 95.5 | 0.0 | 0.9 | 86.5 | 91.0 |
| B200 | MG15 | ETEC | 4,659.0 | 4,838.0 | 95.5 | 97.2 | 0.0 | 2.7 | 91.0 | 82.9 |
| Q196 | MG32 | DAEC | 5,052.0 | 5,831.0 | 94.6 | 92.8 | 0.0 | 3.6 | 90.1 | 74.8 |
Isol, isolate genome; MAG, metagenome-assembled genome; ETEC, enterotoxigenic E. coli; DAEC, diffusely adhering E. coli. Completeness, contamination, and quality values are expressed as percentages.
TABLE 2.
Sizes of metagenomes, genome isolates analyzed, and metagenome-assembled genomes, and numbers of contigsa
| Isolate | Metagenome | Size (bp) |
N50 (bp) |
No. of contigs |
||||
|---|---|---|---|---|---|---|---|---|
| mg | Isol | MAG | Isol | MAG | Isol | MAG | ||
| E158 | MG24 | 1,597,930,096 | 5,203,137 | 3,664,797 | 77,037 | 3,676 | 202 | 2,270 |
| E124 | MG23 | 2,493,980,240 | 5,105,242 | 4,690,531 | 86,732 | 30,442 | 204 | 359 |
| Q51 | MG31 | 208,405,856 | 5,198,049 | 5,768,476 | 55,381 | 1,800 | 252 | 4,256 |
| B45 | MG6 | 2,672,086,384 | 4,846,694 | 4,574,698 | 30,625 | 49,234 | 315 | 236 |
| E184 | MG19 | 1,407,813,248 | 5,043,927 | 4,808,941 | 88,848 | 10,996 | 182 | 1,019 |
| E230 | MG25 | 1,979,172,096 | 5,883,307 | 5,126,380 | 5,050 | 75,456 | 1,630 | 308 |
| B200 | MG15 | 2,805,315,248 | 4,801,347 | 4,554,119 | 42,883 | 8,615 | 243 | 1,020 |
| Q196 | MG32 | 230,287,984 | 5,188,961 | 5,196,245 | 34,191 | 13,450 | 309 | 1,071 |
Isol, genome isolate; mg, metagenome; MAG, metagenome-assembled genome.
FIG 1.

Schematic of the pipeline followed in this study to identify isolate and population genes captured by MAGs recovered from the same fecal sample. E. coli isolates were recovered and sequenced, after testing positive for the presence of virulence factors by PCR, resulting in draft genomes, while metagenomes from the same samples were assembled and binned in order to recover MAGs belonging to the same species (ANI, >95%). Metagenomic reads were mapped on isolate contigs and genes in order to identify population core and variable genes and isolate (strain)-specific genes based on their coverage patterns as shown in the recruitment plot (see the text for exact definitions). These sets of genes were subsequently searched against the assembled MAG sequences in order to assess how well the MAG represented the population gene content.
FIG 2.

Completeness estimations and true-positive recovery rates of MAGs. Using the isolate genome as a reference, population “core genes” (circles) and “core and variable genes” (triangles) represent the ratios of total core genes and core and variable genes recovered by the MAGs, respectively (true-positive recovery rates). Squares and diamonds represent MiGA and CheckM completeness estimates for the same MAGs, respectively.
TABLE 3.
Fractions of isolate variable and isolate-specific genes and of variable and strain-specific genes not recovered by MAGsa
| MAG/isol | ANI (isolate vs MAG) (%) | % of the following isolate genes/total isolate genes: |
% of isolate genes shared with MAGs | % of isolate core genes missed by MAGs/core genes | % of isolate variable genes missed by MAGs/variable genes | ||
|---|---|---|---|---|---|---|---|
| Core | Variable | Isolate specific | |||||
| MG24-MAG/E158 | 99.990 | 98.925 (4,878) | 0.932 (46) | 0.142 (7) | 64.875 (3,199) | 34.706 (1,693) | 69.56 (32) |
| MG23-MAG/E124 | 99.990 | 97.532 (4,902) | 2.009 (101) | 0.457 (23) | 84.779 (4,261) | 13.851 (679) | 62.37 (63) |
| MG31-MAG/Q51 | 96.990 | 97.421 (4,910) | 2.24 (113) | 0.337 (17) | 42.023 (2,118) | 57.617 (2,829) | 67.25 (76) |
| MG6-MAG/B45 | 99.990 | 98.504 (4,676) | 1.390 (66) | 0.105 (5) | 88.561 (4,204) | 11.313 (529) | 13.63 (9) |
| MG19-MAG/E184 | 99.970 | 98.540 (4,793) | 1.398 (68) | 0.062 (3) | 76.356 (3,714) | 23.158 (1,110) | 54.41 (37) |
| MG25-MAG/E230 | 99.840 | 86.680 (6,059) | 0.000 | 13.319 (931) | 62.532 (4,371) | 27.859 (1,688) | 0.000 |
| MG15-MAG/B200 | 98.890 | 92.187 (4,295) | 0.000 | 7.812 (364) | 69.027 (3,216) | 25.122 (1,079) | 0.000 |
| MG32-MAG/Q196 | 97.630 | 97.18 (4,910) | 0.000 | 2.810 (142) | 70.269 (3,550) | 27.698 (1,360) | 0.000 |
aAbsolute numbers of genes are given in parentheses.
The number of isolate genes shared with the corresponding (paired) MAG recovered from the same sample ranged from 2,118 in Q51 to 4,371 in E230, representing, on average, 74% of the isolate genes, with the exception of Q51, in which they represented only 42% of the genes (Table 3). Similarly, MAG genes shared with the isolate represented, on average, 75% of total MAG genes, with the exception of Q51, where they represented only 24%. The variation in these values correlated well with the ANI between the isolate genome and its corresponding MAG; genome pairs showing relatively low ANI values also shared fewer genes. For instance, the isolate and MAG originating from Q51 showed 96.99% ANI. E230 was a different case in that a high number of genes (6,990) was recovered in the isolate genome compared to the average number of genes in E. coli genomes or the MAGs studied here (average, 4,902; standard deviation [SD], 154) (Tables 1 and 2), suggesting that there was a coculture of two strains, which would explain the low ratio of shared genes (ANI between the isolate and the MAG was 99.84%). Sample E158 was also an exception to the above-mentioned rule (high ANI; high percentage of shared genes) because the low ratio of shared genes was presumably due to low MAG completeness (<90%).
The rest of the MAG genes (nonshared) either had a distant match or did not match with isolate population genes (MAG specific) (Fig. 1) and could be considered the result of natural variability within the natural population present in the sample or could be due to assembly or binning errors as shown below. Given the ANI and genome content results, the Q51 isolate and its corresponding MAG clearly did not represent the same genotype (or strain) and thus were removed from further analysis. Although Q196 had a low ANI with its MAG (97.63%), similar to Q51, it was included in further analysis because the number of genes shared between the isolate and the MAG was not that low, representing 70.26% and 60.88% of the total isolate and MAG genes, respectively.
Frequencies of population core, variable, and isolate-specific genes.
Metagenomic reads were mapped onto the corresponding isolate genome from the same sample in order to reveal the core genes within the natural E. coli population in the sample and identify genes that were variable in the population, i.e., those that were carried by some but not all members of the population, as well as isolate-specific genes (those with no metagenomic reads mapping onto them) (Fig. 1; Fig. 3, panel 1.2; Fig. S1). Metagenomic reads were also mapped on the corresponding MAG sequence (Fig. 3, panel 1.3) in order to assess whether or not the MAG represented the metagenomic population as well as the isolate did (whether the average nucleotide identity of mapped reads [ANIr] to the MAG and the ANIr to the isolate sequence were similar). Indeed, average identity and coverage level values were similar between the MAG and the isolate, showing <10% difference in most cases (Table S1) except for the E230, Q51, and Q196 samples, which represented heterogeneous populations of pathogenic and commensal E. coli, as shown below. In all cases, including the samples with heterogeneous populations, the isolate genome was preferred over the MAG as the reference in the recruitment plot for the analysis of core variable and strain-specific genes because of the uncertainty about the extent to which the MAG may represent sequences, including contamination from other taxa.
FIG 3.
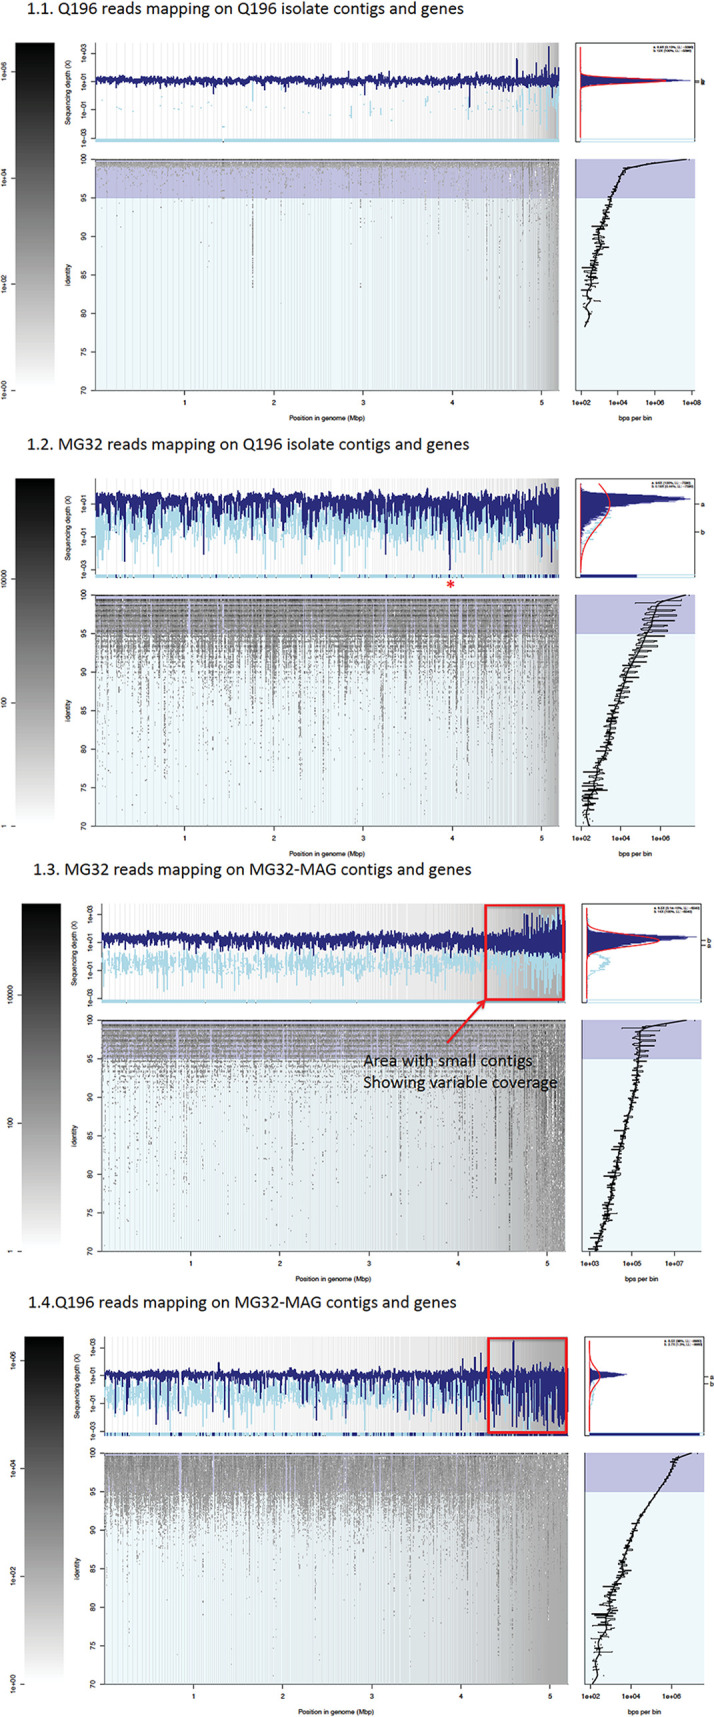
Read recruitment plots of an E. coli isolate and the corresponding MAG of sample Q196. All reads of the metagenome (1.2 and 1.3) and isolate (1.1 and 1.4) data sets were searched against all genes of the isolate and the corresponding MAG. The former search revealed population core and variable genes, as well as isolate-specific genes (using the isolate as the reference), while the latter search identified MAG genes not present in the isolate and corroborated whole-genome blastn comparisons between the MAG and isolate sequences. The main recruitment plot panel shows where individual metagenomic reads matched to the MAG or isolate (x axes) and the percent identity of the match (y axes). The position histogram (top left of each panel) displays the average coverage of each base position for each gene (window). The dark blue histogram represents the coverage by reads matching >100 bp in length and showing >95% nucleotide sequence identity; in light blue are reads matching below the nucleotide identity threshold used. The peak histogram (top right of each panel) represents the distribution of the sequencing depth values of each window for the selected threshold. The identity histogram (bottom right) displays the total number of short-read-derived base positions at given percent identities. The star in panel 1.2 indicates the small blue lines at the bottom of the sequence depth (y axis) that represent isolate-specific genes with no recruited reads. Red boxes in panels 1.3 and 1.4 designate the area of short contigs at the end of the MAG that have variations in coverage and likely represent chimeric sequences.
Variable genes were defined as those with coverage significantly lower than the mean genome coverage (P < 0.01) but >10% of the mean coverage; isolate-specific genes were defined as those showing ≤10% of the mean genome coverage, including no coverage by reads (completely absent). To calculate the level of coverage that provided a probability (P value) of <0.01 (i.e., that the gene coverage was significantly lower than the mean genome coverage, with the null hypothesis being that the gene is present in the population and core), the resulting distribution of coverage values for all genes of a MAG or an isolate genome based on the recruitment plot with metagenome reads was fit to a log-normal distribution using the enveomics.R package, v1.4.1 (10). Core genes were defined as those that showed coverage similar to the average coverage of the whole genome (i.e., P ≥ 0.01).
Variable genes were low in frequency, in general, ranging from 0% to 2.24% of the total isolate genes (average, 0.997%), while isolate-specific genes ranged from 0.10% to 13.31%, with an average of 3.12% (Fig. 4; Table 3). Annotation of population-variable genes revealed that they were related to glycosyltransferases, membrane transporters, secretion proteins, transcriptional regulators, and type III effector proteins that could be related to increased virulence of the population and/or increased fitness in the gut (Table S2), implying that variable genes could provide different members of the population with different adaptive traits.
FIG 4.

Population gene content diversity as revealed by recruitment plots with isolate genomes. With the isolate genome as a reference, the bars represent the frequencies of population-variable (dark shading) and isolate-specific (isp) (light shading) genes based on metagenomic read mapping (left y axis) for each sample studied (x axis). Symbols represent the corresponding numbers of genes (right y axis) as follows: filled circles, core genes; dark shaded circles, variable genes; light shaded circles, isolate-specific (isp) genes.
Samples B200, E230, and Q196 had the highest numbers of isolate-specific genes, which accounted for >1% of the total genes in the genome, in contrast to the other four isolates analyzed (Fig. 4; Table 3). Note that the isolate genome recovered from sample Q196 is likely to represent an E. coli population other than the abundant genotype present in the sample, as evidenced by a low ANI between the isolate genome and the MAG (97.6%). Annotation of these isolate-specific genes showed that >30% represented uncharacterized proteins, even reaching 49% in Q196, while 4.65% to 10.51% of isolate-specific genes were attributable to mobile elements, mainly phage proteins, transposases, and integrases (Table S3). The relative frequency of uncharacterized proteins among isolate-specific genes was significantly higher than that in the total isolate genome (P, 0.04 by the chi-square test). This was not the case for the mobile elements (P, 0.12 by the chi-square test), although ratios for mobile elements in samples B200 and E230 were much higher (>2-fold) among isolate-specific genes than in the whole genome. However, 20 to 38% of the isolate-specific genes identified were at the edges of contigs (<100 bp from the edge), in comparison to 5 to 40% for the whole genome, and this could be problematic for metagenomic read coverage estimation (fewer reads can typically be mapped at the ends of contigs with high stringency thresholds such as those used here). Therefore, we did not include isolate-specific genes from the isolates in the quality assessment of the MAGs (Fig. 1); in addition, such genes should not be expected to be captured by MAGs, since they are carried by only a few cells, or even a single cell, of the total population.
As also discussed previously with regard to the E230 isolate genome, an unexpectedly high number of genes (6,990) was observed compared to the average number of genes in E. coli isolate genomes and the MAGs studied here (average, 4,902, SD, 154) (Table 1). Taxonomic profiling of the isolate-specific genes in E230 showed that all these genes were assignable to E. coli, suggesting that there was a coculture of two strains that was sequenced, and this presumably accounted for the high numbers of isolate-specific genes not captured by the metagenome and core genes not detected by the MAG (Fig. 2 and 4). This was also supported by the high fragmentation of the E230 genome assembly (1,630 contigs; N50, 5,050 bp) (Table 2). Hence, the relatively lower performance of the MAG in the case of E230 (see below) was most likely due to a mixed coculture of the isolate genome rather than a low-quality MAG.
Population core and variable genes missed by MAGs (completeness).
We next examined if the population core and variable genes identified by the read recruitment analysis above using the isolate genome as the reference were captured by the corresponding MAGs from the same sample. Core genes not captured by the MAGs represented a fraction ranging from 11.31% (B45) to 34.7% (E158) (24.84%, on average) of the total core genes, while the fraction of variable genes missing in the MAGs was 13.63% to 69.56% (50.17%, on average) (Table 3; Fig. S2). As expected, MAGs missed all isolate-specific genes in these comparisons; these genes are too rare in-situ to be assembled, since they are specific to the isolate in question.
A fraction of missed core genes (ranging from 12% to 79%) and variable genes (from 19% to 39%) in our samples found matching MAG homologs in BLASTN whole-genome comparisons of isolates with MAGs. However, these matches showed ≤90% nucleotide identity or ≤90% alignment length, indicating that either these genes were indeed real population-divergent homologs—genes not shared with the isolate—or they resulted from assembly errors (Fig. S3). The remaining missed core (16% to 71%) and variable (64% to 71%) population genes that did not find any homolog among the MAG genes were assembled but binned in other Enterobacteriaceae MAGs from the same fecal sample (Fig. S3), revealing binning errors when closely related populations coexist in the same samples. Genes with relatively low sequence identity or alignment length and genes binned in other MAGs accounted for >95% of the total core genes and/or variable genes missed by the MAG. In two of the samples (E230, Q196), the percentage of genes that had no match with any MAG gene exceeded 30% (Fig. S3). Not surprisingly, these two samples were also among the samples with the highest numbers of isolate-specific genes (Table 3; Fig. 4) while isolate Q196 also had a low ANI value (<99%) with its corresponding MAG, suggesting the copresence of different genotypes.
Importantly, assessment of MAG completeness using either MiGA (based on the presence/absence and single/multiple copy of 111 essential universal genes) or CheckM (based on 1,173 marker genes conserved in the Enterobacteriaceae family) showed that all MAGs were of high completeness (86.5% to 91%) based on recently proposed standards (9), and the estimated completeness was slightly higher by CheckM than by MiGA (Table 1; Fig. 2). However, when genome completeness was estimated based on true-positive recovery rates for (i) core genes only (recovered population core genes/total population core genes, using the isolate as the reference in the read recruitment plot) and (ii) core and variable genes combined (recovered population core and variable genes/total core and variable genes), the rates ranged from 65.29% to 88.68% and 64.95 to 88.65%, respectively (Fig. 2). These rates were lower than the completeness assessments of MiGA and CheckM, by 16.9% and 20.4%, respectively, on average (Fig. 2).
Frequency of contamination from non-E. coli sequences in MAGs and underlying causes.
MAG genes that were not shared with the population after whole-genome comparison to the isolate genes with substantial metagenome coverage (core and variable population genes), ranged from 3.97% (B45) to 48.05% (E158) (Table 4). These genes were separated into two categories: (i) genes that had distant matches showing either >70% but ≤90% identity or alignment length, or both, with the isolate genes and (ii) genes with no matches with isolate genes at ≥70% identity and alignment length (Fig. 1), i.e., MAG-specific genes. The first category accounted, in total, for 25.8% to 45.02% of the nonshared MAG genes (Table 4), indicating true gene variability for cases of lower identities and potential assembly issues for cases of low alignment length values. The second category accounted for more than half of the nonshared MAG genes in all cases (Table 4). In the MAG-isolate pairs with low ANI values (Table 3), some of these MAG-specific genes could represent real population-variable genes not present in the isolate. However, we posit that this fraction, representing between 2.35% (B45) and 26.41% (E158) of the entire genome (average, 14.42%, excluding Q196), corresponds, for the most part, to MAG contamination: genome fragments erroneously included in the MAG.
TABLE 4.
Fractions of MAG genes not shared with the population, MAG-specific genes, and non-Enterobacteriaceae genes among MAG genes and MAG-specific genes
| MAG/isol | % (absolute no.) of the following genes within the indicated group: |
||||||
|---|---|---|---|---|---|---|---|
| MAG genes not shared with isolate | MAG-specific genes |
Non-Enterobacteriaceae genes |
Genes in short contigs (<1,000 bp) |
||||
| Nonshared MAG genes | Total MAG genes | MAG genes | MAG-specific genes | MAG-specific genes | MAG-specific non-Enterobacteriaceae genes | ||
| MG24-MAG/E158 | 48.051 (2,959) | 54.98 (1,627) | 26.421 | 4.3 (265) | 11.87 (215) | 44.75 (810) | 10.39 (21) |
| MG23-MAG/E124 | 7.590 (350) | 66.85 (234) | 5.075 | 2.42 (112) | 21.69 (59) | 28.52 (83) | 13.55 (8) |
| MG6-MAG/B45 | 3.974 (174) | 59.19 (103) | 2.353 | 2.32 (102) | 36.28 (41) | 29.41 (50) | 63.33 (38) |
| MG19-MAG/E184 | 28.645 (1,491) | 64.72 (965) | 18.540 | 6.68 (348) | 27.59 (298) | 33.01 (335) | 35.78 (107) |
| MG25-MAG/E230 | 13.014 (654) | 68.65 (449) | 8.935 | 5.63 (283) | 46.63 (222) | 28.15 (134) | 36.28 (82) |
| MG15-MAG/B200 | 36.543 (1,852) | 69.006 (1,278) | 25.217 | 5.14 (261) | 16.77 (224) | 19.62 (262) | 12.22 (28) |
| MG32-MAG/Q196 | 39.118 (2,281) | 74.22 (1,693) | 29.034 | 10.03 (585) | 30.32 (545) | 35.39 (636) | 7.10 (39) |
A considerable fraction (20% to 45%; average, 30.6%, excluding Q196) of the MAG-specific genes were found in contigs shorter than 1,000 bp (Table 4) (reported toward the end of the MAG sequence file) and usually showed more-variable coverage than the rest of the genome (higher or lower [examples can be found in Fig. 3]), further corroborating the proposition that these genes represented binning errors. In agreement with this interpretation, best-match analysis of MAG-specific genes against available reference genomes showed that a substantial fraction, ranging from 11.87% (E158) to 46.63% (E230) of these MAG-specific genes or 2.42% to 10.03% of total MAG genes, did not match Enterobacteriaceae (Table 4); the remaining genes matched Enterobacteriaceae genomes. Some of the genes not matching Enterobacteriaceae were also parts of short contigs (7% to 36%) (Table 4). Importantly, both CheckM and MiGA failed to estimate MAG contamination by other bacterial families in most cases, i.e., their contamination estimates were 0.9% to 3.6%, because these tools are based on universal genes only, and the majority of the extraneous genes were not universal or core genes.
The highest numbers of MAG-specific genes were observed in the MAGs recovered from the E158, B200, Q196, and E184 metagenomes (>20% of total MAG genes). Overall, these MAGs had high completeness and low contamination (Table 1) but exhibited the highest numbers of non-Enterobacteriaceae genes, followed by the E230 MAG, which also exhibited 9% MAG-specific genes (Table 4).
Evaluation of the effect of contig length on MAG quality.
Our MAGs overall showed high completeness (>80%) and low contamination (<10%) according to MiGA (Table 1), and the N50 values (50% of the assembly is found in contigs longer than the N50 value) varied among the MAGs and were lower than the N50 values for the isolates in most cases (Table 2). The importance of contig number and length for retrieving accurate and complete MAGs has been discussed previously (18), and those studies suggested that fewer than 10 long contigs should ideally be used as candidates for complete MAGs (i.e., fully circularized genomes). In agreement with this suggestion, we found that the number of contigs making up the MAG sequence was positively correlated (R = 0.91) with the percentage of genes that were MAG specific in our data set (Fig. S4), implying that using longer contigs decreases false-positive binning errors. To more accurately quantify this parameter, we performed binning again, using different minimum lengths (1 kb, 2 kb, and 5 kb) for including contigs in the binning step. Our evaluation using MiGA showed that MAG completeness was not significantly decreased in this range of contig lengths except for the E158-MAG, while contamination decreased and quality increased in almost all cases (Table S4). A contig length of 1,000 bp offered the best compromise between lower contamination and minor decreases in quality and completeness, which was roughly consistent with what was reported previously based on different binning algorithms (19). Similarly, the number of nonshared MAG genes decreased in most cases, as expected (Table S4; Fig. 5), while isolate genes captured by the corresponding MAG decreased slightly and even increased in some cases, indicating that using longer contigs (lower fragmentation) also allowed for more-reliable binning (Table S4; Fig. 5).
FIG 5.

Estimations of MAG completeness and MAG-specific genes obtained by using different minimum contig lengths for binning (from left to right for each sample, 0.5, 1, 2, and 5 kbp). (Bottom) MiGA completeness estimations for MAGs (filled bars) and the fraction of isolate genes shared by the corresponding MAG from the same sample (shaded bars). (Top) Fraction of MAG-specific genes not present in the corresponding isolate genome.
DISCUSSION
Despite the common use of genome binning in recent molecular microbial ecology studies, investigations of how well MAGs represent the total population by direct comparison with isolate genomes from the same sample are lacking. Here, we compared population core and variable genes detected using genomes of E. coli isolates as the reference in read recruitment plots versus MAGs originating from the same sample. Taking into account that our samples were medium-to-high-complexity data sets (17), our results were consistent with those of the CAMI challenge in that we were able to recover MAGs with high completeness (>80%) and low contamination (<8%) from each metagenome using MaxBin 2.1.1 (13). Confoundingly, our study highlighted, in addition, consistent contamination of sequences from other bacterial families recovered by MAGs that often went unnoticed by the common strategies and tools used for this purpose.
Overall, MAGs missed 25% and 50% of the population core and variable genes, respectively, on average, which was substantially higher than the estimate of the quality-checking pipelines (Table 3; Fig. 4; see also Fig. S2 in the supplemental material). These findings were consistent with those reported recently based on a comparison of isolate genomes derived from a low-complexity (enrichment) culture of ∼20 bacterial species with the MAGs recovered from the metagenome of the culture (20), further highlighting the need for improvements in binning approaches and/or manual curation of the resulting MAGs (18). Nelson and colleagues reported, in addition, that isolate genes missed by MAGs were often found in short contigs of atypical tetranucleotide frequency (20), which was presumably specific to the approach used for binning (a tetranucleotide-based approach). The binner software employed in our study (MaxBin) is not (as) sensitive to tetranucleotide composition variation but is prone to splitting population genomes in multiple (independent) MAGs in some samples (13), which was also observed in our samples (E158, Q51) that yielded MAGs of low completeness. Therefore, different results than those reported here could be obtained depending on the binning strategy employed and the specific metagenomic data set(s). That said, our results should provide a reference guide for the binning of single data sets with no manual curation of the resulting MAGs. Further, the genes missed by MAGs often included virulence factors in both our study and the previous study (20), because these genes are commonly carried by short contigs (after assembly) of atypical coverage and/or tetranucleotide frequency. Therefore, applications of binning to clinical samples should examine contigs not binned as part of the (target) MAG for the presence of (known or suspected) virulence factors as well as applying the recommendations below for more-reliable MAGs.
The reverse comparison, i.e., population genes identified using the MAG as the reference that were not recovered by using the isolate genome, revealed even more MAG genes that were not shared with the isolate (Table 4). These genes are attributable, at least partly, to the fact that the isolates almost never represent all members of a natural population. However, our analysis indicated that the majority of these genes were classified in families other than Enterobacteriaceae (i.e., potential errors in binning), which would result in an overestimation of population gene variability. Our analysis showed that our MAGs have, on average, 4.4% (range, 2.3% to 6.7%, excluding Q196) of sequences not taxonomically classified into Enterobacteriaceae and attributed here to binning errors. This value is higher than the contamination levels estimated both by MiGA (0.9% to 2.7%; average, 1.5%, excluding Q196) and by CheckM (0.36% to 7.92%; average, 2.63%). Therefore, it appears that MAGs recovered using the most frequently used pipelines and thresholds commonly have a low but substantial frequency of sequences that belong to taxonomic groups other than the group in question and that this was not estimated by the best-performing tools for quality assessment, since these tools do not target the detection of extraneous sequences. Thus, further improvements in genome quality assessment as well as long-read sequencing technologies are needed for higher accuracy. For the time being, the recommendations below should help to identify such problematic cases and/or to obtain MAGs of sufficient quality.
Suggestions for reliable genome binning and MAGs.
Our analysis identified key parameters and metrics, such as the number of contigs and gene taxonomic classification, that could be explored for more-reliable genome binning or could help to identify problematic MAGs. The following suggestions are therefore presented; they typically result in high-quality MAGs, defined as representing >85% of core and variable population genes and showing <3% contamination (i.e., genes of different taxonomic origin). Notably, this quality level was achieved by default binning settings only for the MAGs of samples E124 and B45; six out of eight metagenomes produced MAGs of lower quality. Our suggestions include the following:
-
•
Identify high-quality MAGs based on MiGA or CheckM (>70% quality score) with >10× coverage in order to obtain homogenous gene coverage. Also, select MAGs with a low number of contigs (<500) and high N50 (>20,000 bp), since these parameters provide the best assemblies.
-
•
Generate metagenomic read recruitment plots of high-quality MAGs as suggested previously (7). These plots typically reveal uniform coverage across the MAG, with increased coverage where the rRNA and multicopy mobile genes are located. Manually inspect, and possibly remove, contigs of unusual coverage compared to the rest of the genome that do not carry rRNA or (known) multicopy genes. Tools such as Anvi’o could further facilitate the (manual) identification and removal of such contigs (21).
-
•
Keep in mind that sequences harboring contamination are more frequently found in short contigs and are characterized by more-variable coverage patterns than the average of the genome. Further, the sequence diversity within the population revealed by the recruitment plot (e.g., mapping patterns of reads showing >90% nucleotide identity to the MAG) often differs for chimeric contigs relative to the rest of the genome. To avoid such contigs, it is preferable to select longer contigs for binning (>1,000 bp).
-
•
Compare MAGs to their closest relatives (ANI, >93% to 95%) in terms of genome size and number of genes for expectation of the gene content from the MAG sequence. Note that taxonomy does not directly follow conservation of genome length (22). However, genome size deviations of more than 0.5 and 1 Mbp at the species and genus levels, respectively, could be indicative of problematic binning.
-
•
Obtain the taxonomic profiles of a majority of genes using tools such as MyTaxa, and examine their in situ coverage by metagenomic reads to detect chimeric MAGs, even in cases where the tools for quality assessment provide high-quality values.
Our study is based on a limited number of samples (pairs) analyzed and on a specific, limited level of complexity, that of the gut microbiome. Another limitation was the focus on E. coli isolates alone. Future studies should include metagenomes of varied complexities and isolates of different species in order to verify that our results apply to other prokaryotic taxa. Further, while we used only one binning tool in this study, our data set is appropriate for evaluating additional binning tools or strategies that combine the outputs of several tools. The suggestions provided here should facilitate the identification and removal or manual curation of “suspicious” MAGs not captured by the available quality-checking tools. Since MAGs are increasingly used in ecological and diversity/taxonomic studies (23, 24), it is possible that the coassembly of several metagenomes containing closely related populations could produce even more-erroneous MAGs (25). Thus, it is important that such efforts be combined with thorough inspection of the MAG sequences, especially for the handful of MAGs that are critical for the study of pathogens and other target organisms or are used to describe new Candidatus taxa (26).
MATERIALS AND METHODS
Study design, collection of samples, isolates, and sequencing.
This study was a part of the EcoZUR (E. coli en Zonas Urbanas y Rurales) project, a case-control study of diarrhea that was carried out over 18 months in northern coastal Ecuador (17, 27). One of the objectives of the EcoZUR project was the identification of diarrheal cases for which E. coli was the causative agent and the evaluation of signatures in the gut microbiome that might distinguish between infections caused by different E. coli pathotypes. For this purpose, samples from infected children with an E. coli pathotype, based on culture results and PCR-based identification of pathotype-specific genes carried by the isolates, and their age-matched controls were analyzed using whole shotgun metagenomic data, isolate genome sequencing, and epidemiological data (Fig. 1). Collection of samples, culturing of E. coli isolates, and metagenome and genome sequencing, as well as metagenome assembly, have been described previously (17). For the current study, a subset of EcoZUR samples was used (Tables 1 and 2), for which the isolated E. coli strain was presumably the causative disease agent based on a combination of data including metagenomic relative abundance and level of clonality (pathogenic E. coli populations tend to be more clonal than commensal E. coli), the presence of virulence factors, and epidemiological data (e.g., the presence of symptoms and the more-frequent association of the isolate with disease than with healthy samples) (17).
Population genome binning.
Contigs longer than 500 bp were binned into genomes using MaxBin v2.1.1 with default settings (28). Only contigs from the assembly of an individual sample were used for binning (i.e., no coassembly was performed). CheckM and the MiGA Web server (www.microbial-genomes.org) were used to estimate the completeness and contamination of each metagenome-assembled genome (MAG) based on the recovery of single-copy universal bacterial proteins (15, 16). Recruitment plots were constructed, as described previously (29), for isolates and MAG contigs and genes using the enveomics.R package, v1.4.1, from the enveomics collection (10).
Taxonomic assignments and functional annotation of predicted genes.
Genes were predicted in all MAGs or isolate genome sequences analyzed using Prodigal (v2.6.1; default parameters) (30). Taxonomic assignment based on phylogenetic reconstruction of the universal single-copy-number genes for each MAG was performed using CheckM and MiGA. Assessment of the taxonomic origins of individual genes and operons was based on MyTaxa (31) as implemented in MiGA. Genome-aggregate average nucleotide identity (ANI) was calculated between all MAGs assigned to Enterobacterales and the respective isolates using the ani.rb script from the enveomics collection. Functional annotation for each genome was performed using blastp searches (score, >60 bits; similarity, >40%) against UniProt 2017_11 (32).
Gene conservation in the natural (metagenomic) population.
Recruitment of metagenomic reads to the reference MAG or isolate sequences was used to identify areas of sequence discontinuity for the corresponding population as described previously (29). For all MAGs, 95% nucleotide identity, the most commonly used threshold for species demarcation (33), corresponding to an area of sequence discontinuity revealed by the read recruitment plots, was used as the threshold to identify reads representing the reference population and estimate the coverage of the population (i.e., relative abundance in the metagenome) (Table S1; Fig. 2). Reads with <95% identity were assumed to represent distinct (nontarget), co-occurring populations and were excluded from further analysis. Read mapping against the MAG or isolate genomes was performed with BLAT, and only one match (best match) per read was saved (34).
Eight MAG-isolate pairs from disease samples (Fig. 1; Tables 1 and 2) for which the isolate was concluded to be the causative agent and its population was abundant (>7× coverage) in the metagenome based on our previous study (17) were used in total. Metagenome read mapping was performed for each isolate to assess the level of gene conservation within the natural sequence-discrete population and to determine the relative abundance of each gene (Fig. 1). More specifically, metagenome reads were mapped onto isolate genomes in order to identify variable and core genes, and isolate genes missing (or less abundant) within the natural population (for exact definitions of these sets of genes, see Results). Variable and absent genes were calculated only for isolates with 7× or more average coverage across the genome in order to reduce the impact of spurious results. When population coverage is lower, genes may be missed due to sequence depth variation and not true absence, resulting in a false-positive signal (2). This level of coverage (>7×) and the associated P value (<0.01; see also below) ensured a low number (<1%) of potential false-positive results based on subsampling and simulation experiments performed previously (2). Gene coverage was calculated using the sequencing depth of the corresponding window in the recruitment plot using the BlastTab.seqdepth.pl script from the enveomics collection (10). All isolate genes were also searched against MAG genes using BLASTN searches (thresholds for a match: nucleotide identity, >90%; alignment length, >90%) to determine if the MAG included these genes (Fig. 1). For read mapping, the ANIr against the reference MAG or isolate genome sequence, using all mapped reads with identities above the selected nucleotide identity threshold (95%), was also calculated in order to estimate the level of intrapopulation sequence diversity (Table S1).
Data availability.
The 32 biosamples used in this study are available in NCBI, under BioProject number PRJNA486009 (BioSample numbers SAMN16296799 to SAMN16296806 and SAMN16453473 to SAMN16453496; these numbers provide links to the accession numbers of the original metagenomes released by Peña-Gonzalez et al. [17] and additional metadata). The MAG sequences recovered in this study are available under GenBank accession numbers JAEPDT000000000 to JAEPDZ000000000, JAEPEA000000000 to JAEPEQ000000000, JADDTU000000000 to JADDTZ000000000, and JADDUA000000000 to JADDUB000000000, as well as through http://enve-omics.ce.gatech.edu/data/ecozur.
Supplementary Material
ACKNOWLEDGMENTS
Funding for this study is provided by National Institute of Allergy and Infectious Diseases grants 1K01AI103544 (to K.L.) and R01AI137679 (to K.L. and K.T.K.) and by NSF award 1759831 (to K.T.K.). The content of this paper is solely the responsibility of the authors and does not necessarily represent the official views of the National Institutes of Health or NSF.
Footnotes
Supplemental material is available online only.
REFERENCES
- 1.Bendall ML, Stevens SL, Chan L-K, Malfatti S, Schwientek P, Tremblay J, Schackwitz W, Martin J, Pati A, Bushnell B, Froula J, Kang D, Tringe SG, Bertilsson S, Moran MA, Shade A, Newton RJ, McMahon KD, Malmstrom RR. 2016. Genome-wide selective sweeps and gene-specific sweeps in natural bacterial populations. ISME J 10:1589–1601. doi: 10.1038/ismej.2015.241. [DOI] [PMC free article] [PubMed] [Google Scholar]
- 2.Meziti A, Tsementzi D, Rodriguez-R LM, Hatt JK, Karayanni H, Kormas KA, Konstantinidis KT. 2019. Quantifying the changes in genetic diversity within sequence-discrete bacterial populations across a spatial and temporal riverine gradient. ISME J 13:767–779. doi: 10.1038/s41396-018-0307-6. [DOI] [PMC free article] [PubMed] [Google Scholar]
- 3.Marx V. 2016. Microbiology: the road to strain-level identification. Nat Methods 13:401–404. doi: 10.1038/nmeth.3837. [DOI] [PubMed] [Google Scholar]
- 4.Sangwan N, Xia F, Gilbert JA. 2016. Recovering complete and draft population genomes from metagenome datasets. Microbiome 4:8. doi: 10.1186/s40168-016-0154-5. [DOI] [PMC free article] [PubMed] [Google Scholar]
- 5.Bai Y, Müller DB, Srinivas G, Garrido-Oter R, Potthoff E, Rott M, Dombrowski N, Münch PC, Spaepen S, Remus-Emsermann M, Hüttel B, McHardy AC, Vorholt JA, Schulze-Lefert P. 2015. Functional overlap of the Arabidopsis leaf and root microbiota. Nature 528:364–369. doi: 10.1038/nature16192. [DOI] [PubMed] [Google Scholar]
- 6.Kashtan N, Roggensack SE, Rodrigue S, Thompson JW, Biller SJ, Coe A, Ding H, Marttinen P, Malmstrom RR, Stocker R, Follows MJ, Stepanauskas R, Chisholm SW. 2014. Single-cell genomics reveals hundreds of coexisting subpopulations in wild Prochlorococcus. Science 344:416–420. doi: 10.1126/science.1248575. [DOI] [PubMed] [Google Scholar]
- 7.Ramos-Barbero MD, Martin-Cuadrado A-B, Viver T, Santos F, Martinez-Garcia M, Antón J. 2019. Recovering microbial genomes from metagenomes in hypersaline environments: the good, the bad and the ugly. Syst Appl Microbiol 42:30–40. doi: 10.1016/j.syapm.2018.11.001. [DOI] [PubMed] [Google Scholar]
- 8.Hug LA. 2018. Sizing up the uncultured microbial majority. mSystems 3:e00185-18. doi: 10.1128/mSystems.00185-18. [DOI] [PMC free article] [PubMed] [Google Scholar]
- 9.Bowers RM, Kyrpides NC, Stepanauskas R, Harmon-Smith M, Doud D, Reddy TBK, Schulz F, Jarett J, Rivers AR, Eloe-Fadrosh EA, Tringe SG, Ivanova NN, Copeland A, Clum A, Becraft ED, Malmstrom RR, Birren B, Podar M, Bork P, Weinstock GM, Garrity GM, Dodsworth JA, Yooseph S, Sutton G, Glöckner FO, Gilbert JA, Nelson WC, Hallam SJ, Jungbluth SP, Ettema TJG, Tighe S, Konstantinidis KT, Liu W-T, Baker BJ, Rattei T, Eisen JA, Hedlund B, McMahon KD, Fierer N, Knight R, Finn R, Cochrane G, Karsch-Mizrachi I, Tyson GW, Rinke C, Lapidus A, Meyer F, Yilmaz P, Parks DH, Eren AM, Genome Standards Consortium, et al. 2017. Minimum information about a single amplified genome (MISAG) and a metagenome-assembled genome (MIMAG) of bacteria and archaea. Nat Biotechnol 35:725–731. doi: 10.1038/nbt.3893. [DOI] [PMC free article] [PubMed] [Google Scholar]
- 10.Rodriguez-R LM, Konstantinidis KT. 2016. The enveomics collection: a toolbox for specialized analyses of microbial genomes and metagenomes. PeerJ Preprints 4:e1900v1. 10.7287/peerj.preprints.1900v1. [DOI]
- 11.Luo C, Knight R, Siljander H, Knip M, Xavier RJ, Gevers D. 2015. ConStrains identifies microbial strains in metagenomic datasets. Nat Biotechnol 33:1045–1052. doi: 10.1038/nbt.3319. [DOI] [PMC free article] [PubMed] [Google Scholar]
- 12.Quince C, Delmont TO, Raguideau S, Alneberg J, Darling AE, Collins G, Eren AM. 2017. DESMAN: a new tool for de novo extraction of strains from metagenomes. Genome Biol 18:181. doi: 10.1186/s13059-017-1309-9. [DOI] [PMC free article] [PubMed] [Google Scholar]
- 13.Sczyrba A, Hofmann P, Belmann P, Koslicki D, Janssen S, Dröge J, Gregor I, Majda S, Fiedler J, Dahms E, Bremges A, Fritz A, Garrido-Oter R, Jørgensen TS, Shapiro N, Blood PD, Gurevich A, Bai Y, Turaev D, DeMaere MZ, Chikhi R, Nagarajan N, Quince C, Meyer F, Balvočiūtė M, Hansen LH, Sørensen SJ, Chia BKH, Denis B, Froula JL, Wang Z, Egan R, Kang DD, Cook JJ, Deltel C, Beckstette M, Lemaitre C, Peterlongo P, Rizk G, Lavenier D, Wu Y-W, Singer SW, Jain C, Strous M, Klingenberg H, Meinicke P, Barton MD, Lingner T, Lin H-H, Liao Y-C, Silva GGZ, et al. 2017. Critical Assessment of Metagenome Interpretation—a benchmark of metagenomics software. Nat Methods 14:1063–1071. doi: 10.1038/nmeth.4458. [DOI] [PMC free article] [PubMed] [Google Scholar]
- 14.Rodriguez RL, Tsementzi D, Luo C, Konstantinidis KT. 2020. Iterative subtractive binning of freshwater chronoseries metagenomes identifies over 400 novel species and their ecologic preferences. Environ Microbiol 22:3394–3412. doi: 10.1111/1462-2920.15112. [DOI] [PubMed] [Google Scholar]
- 15.Parks DH, Imelfort M, Skennerton CT, Hugenholtz P, Tyson GW. 2015. CheckM: assessing the quality of microbial genomes recovered from isolates, single cells, and metagenomes. Genome Res 25:1043–1055. doi: 10.1101/gr.186072.114. [DOI] [PMC free article] [PubMed] [Google Scholar]
- 16.Rodriguez-R LM, Gunturu S, Harvey WT, Rosselló-Mora R, Tiedje JM, Cole JR, Konstantinidis KT. 2018. The Microbial Genomes Atlas (MiGA) webserver: taxonomic and gene diversity analysis of Archaea and Bacteria at the whole genome level. Nucleic Acids Res 46:W282–W288. doi: 10.1093/nar/gky467. [DOI] [PMC free article] [PubMed] [Google Scholar]
- 17.Peña-Gonzalez A, Soto-Girón MJ, Smith S, Sistrunk J, Montero L, Páez M, Ortega E, Hatt JK, Cevallos W, Trueba G, Levy K, Konstantinidis KT. 2019. Metagenomic signatures of gut infections caused by different Escherichia coli pathotypes. Appl Environ Microbiol 85:e01820-19. doi: 10.1128/AEM.01820-19. [DOI] [PMC free article] [PubMed] [Google Scholar]
- 18.Chen L-X, Anantharaman K, Shaiber A, Eren AM, Banfield JF. 2020. Accurate and complete genomes from metagenomes. Genome Res 30:315–333. doi: 10.1101/gr.258640.119. [DOI] [PMC free article] [PubMed] [Google Scholar]
- 19.Dick GJ, Andersson AF, Baker BJ, Simmons SL, Thomas BC, Yelton AP, Banfield JF. 2009. Community-wide analysis of microbial genome sequence signatures. Genome Biol 10:R85. doi: 10.1186/gb-2009-10-8-r85. [DOI] [PMC free article] [PubMed] [Google Scholar]
- 20.Nelson WC, Tully BJ, Mobberley JM. 2020. Biases in genome reconstruction from metagenomic data. PeerJ 8:e10119. doi: 10.7717/peerj.10119. [DOI] [PMC free article] [PubMed] [Google Scholar]
- 21.Eren AM, Esen ÖC, Quince C, Vineis JH, Morrison HG, Sogin ML, Delmont TO. 2015. Anvi’o: an advanced analysis and visualization platform for ‘omics data. PeerJ 3:e1319. doi: 10.7717/peerj.1319. [DOI] [PMC free article] [PubMed] [Google Scholar]
- 22.Větrovský T, Baldrian P. 2013. The variability of the 16S rRNA gene in bacterial genomes and its consequences for bacterial community analyses. PLoS One 8:e57923. doi: 10.1371/journal.pone.0057923. [DOI] [PMC free article] [PubMed] [Google Scholar]
- 23.Delmont TO, Quince C, Shaiber A, Esen ÖC, Lee ST, Rappé MS, McLellan SL, Lücker S, Eren AM. 2018. Nitrogen-fixing populations of Planctomycetes and Proteobacteria are abundant in surface ocean metagenomes. Nat Microbiol 3:804–813. doi: 10.1038/s41564-018-0176-9. [DOI] [PMC free article] [PubMed] [Google Scholar]
- 24.Lesker TR, Durairaj AC, Gálvez EJC, Lagkouvardos I, Baines JF, Clavel T, Sczyrba A, McHardy AC, Strowig T. 2020. An integrated metagenome catalog reveals new insights into the murine gut microbiome. Cell Rep 30:2909–2922.e6. doi: 10.1016/j.celrep.2020.02.036. [DOI] [PMC free article] [PubMed] [Google Scholar]
- 25.Shaiber A, Eren AM. 2019. Composite metagenome-assembled genomes reduce the quality of public genome repositories. mBio 10:e00725-19. doi: 10.1128/mBio.00725-19. [DOI] [PMC free article] [PubMed] [Google Scholar]
- 26.Konstantinidis KT, Rosselló-Móra R, Amann R. 2017. Uncultivated microbes in need of their own taxonomy. ISME J 11:2399–2406. doi: 10.1038/ismej.2017.113. [DOI] [PMC free article] [PubMed] [Google Scholar]
- 27.Smith SM, Montero L, Paez M, Ortega E, Hall E, Bohnert K, Sanchez X, Puebla E, Endara P, Cevallos W, Trueba G, Levy K. 2019. Locals get travellers’ diarrhoea too: risk factors for diarrhoeal illness and pathogenic Escherichia coli infection across an urban-rural gradient in Ecuador. Trop Med Int Health 24:205–219. doi: 10.1111/tmi.13183. [DOI] [PMC free article] [PubMed] [Google Scholar]
- 28.Wu Y-W, Tang Y-H, Tringe SG, Simmons BA, Singer SW. 2014. MaxBin: an automated binning method to recover individual genomes from metagenomes using an expectation-maximization algorithm. Microbiome 2:26. doi: 10.1186/2049-2618-2-26. [DOI] [PMC free article] [PubMed] [Google Scholar]
- 29.Caro-Quintero A, Konstantinidis KT. 2012. Bacterial species may exist, metagenomics reveal. Environ Microbiol 14:347–355. doi: 10.1111/j.1462-2920.2011.02668.x. [DOI] [PubMed] [Google Scholar]
- 30.Hyatt D, Chen G-L, Locascio PF, Land ML, Larimer FW, Hauser LJ. 2010. Prodigal: prokaryotic gene recognition and translation initiation site identification. BMC Bioinformatics 11:119. doi: 10.1186/1471-2105-11-119. [DOI] [PMC free article] [PubMed] [Google Scholar]
- 31.Luo C, Rodriguez-R LM, Konstantinidis KT. 2014. MyTaxa: an advanced taxonomic classifier for genomic and metagenomic sequences. Nucleic Acids Res 42:e73. doi: 10.1093/nar/gku169. [DOI] [PMC free article] [PubMed] [Google Scholar]
- 32.Wu CH, Apweiler R, Bairoch A, Natale DA, Barker WC, Boeckmann B, Ferro S, Gasteiger E, Huang H, Lopez R, Magrane M, Martin MJ, Mazumder R, O’Donovan C, Redaschi N, Suzek B. 2006. The Universal Protein Resource (UniProt): an expanding universe of protein information. Nucleic Acids Res 34:D187–D191. doi: 10.1093/nar/gkj161. [DOI] [PMC free article] [PubMed] [Google Scholar]
- 33.Goris J, Konstantinidis KT, Klappenbach JA, Coenye T, Vandamme P, Tiedje JM. 2007. DNA-DNA hybridization values and their relationship to whole-genome sequence similarities. Int J Syst Evol Microbiol 57:81–91. doi: 10.1099/ijs.0.64483-0. [DOI] [PubMed] [Google Scholar]
- 34.Kent WJ. 2002. BLAT—the BLAST-like alignment tool. Genome Res 12:656–664. doi: 10.1101/gr.229202. [DOI] [PMC free article] [PubMed] [Google Scholar]
Associated Data
This section collects any data citations, data availability statements, or supplementary materials included in this article.
Supplementary Materials
Data Availability Statement
The 32 biosamples used in this study are available in NCBI, under BioProject number PRJNA486009 (BioSample numbers SAMN16296799 to SAMN16296806 and SAMN16453473 to SAMN16453496; these numbers provide links to the accession numbers of the original metagenomes released by Peña-Gonzalez et al. [17] and additional metadata). The MAG sequences recovered in this study are available under GenBank accession numbers JAEPDT000000000 to JAEPDZ000000000, JAEPEA000000000 to JAEPEQ000000000, JADDTU000000000 to JADDTZ000000000, and JADDUA000000000 to JADDUB000000000, as well as through http://enve-omics.ce.gatech.edu/data/ecozur.