

We read with great interest the recent article by Salvalaggio and colleagues comparing the ability of different lesion mapping techniques to predict post-stroke behavioural deficits.1 The authors have been pioneers in this area and previously developed a principal components analysis (PCA)/ridge-regression approach to predict behavioural deficits from lesion location2 and from resting state functional connectivity data obtained in patients after their stroke.3 In their recent paper, Salvalaggio et al. test whether this method can predict behaviour scores based on connectivity with the lesion location generated using normative connectomes. Specifically, they use a normative structural connectome to generate structural disconnection (SDC) maps4 and a normative functional connectome to generate a functional disconnection map (FDC). The latter technique is meant to emulate the lesion network mapping approach used by our laboratory5-7 and many others.8-16 The authors conclude that lesion location, SDC, and resting state functional connectivity MRI (rs-fcMRI) from the patients themselves all have value in predicting behavioural deficits, but that ‘indirect estimation of functional disconnection did not predict behavioural deficits’.
We applaud this effort. We believe that different lesion mapping approaches will likely offer complementary insights into lesion-induced deficits. Studies directly comparing different approaches are therefore of great value. Further, lesion network mapping has only rarely been used to predict behavioural scores17,18 as it was developed for a different purpose: namely to test whether lesions in different locations that cause the same symptom map to a common brain network and to identify the topography of that network.5 However, we were surprised that FDC performed so poorly in the analyses by Salvalaggio et al.1 This outcome was particularly surprising as we have previously used lesion network mapping to predict behavioural deficits in the same stroke dataset.17 In Ferguson et al.17 we derived a memory network based on lesion locations causing amnesia, then tested whether intersection of lesion locations with our network predicted variance in memory scores in independent datasets, including the dataset studied by Salvalaggio et al. Although the amount of behavioural variance predicted by our memory network was not high, it was statistically significant, suggesting that lesion network mapping has value for localizing and predicting behavioural deficits.
To ensure this discrepancy was not due to our use of an independent dataset to derive our lesion network or our focus on memory deficits, we performed a new set of analyses, deriving lesion networks for each of the eight behavioural factors studied by Salvalaggio et al. and using only this stroke dataset. For each behavioural factor, we generated a univariate T-map using FSL PALM that related behavioural score to rs-fcMRI connectivity at each voxel, controlling for lesion size.19 These maps were generated multiple times, each time leaving out one patient’s data. A ‘network damage score’ was then calculated for the left-out patient by summing the positive T-values of each voxel that fell within that patient’s lesion mask, the same method used in our previous study.17 We then computed the Pearson correlation between network damage scores and the behavioural factor scores to obtain R2 values, which could be directly compared to the results reported in Salvalaggio et al.1 (Table 1). Of note, these scores were also used to generate predicted behavioural factor scores, which yields an identical R2 value.
Table 1.
Prediction of behavioural factor scores
| Lesion R2 1 | SDC R2 1 | FDC R2 1 | LNM R2 calculated from Network Damage Score | |
|---|---|---|---|---|
| Language | 0.48 | 0.41 | 0.06 | 0.41 |
| Motor left (right lesion) | 0.35 | 0.37 | 0.12 | 0.4 |
| Motor right (left lesion) | 0.28 | 0.42 | 0.08 | 0.22 |
| Visual left (right lesion) | 0.4 | 0.23 | 0.18 | 0.32 |
| Visual right (left lesion) | 0.58 | 0.33 | 0.38 | 0.38 |
| Verbal memory | 0.06 | 0.05 | 0.01a | 0.03 a (P = 0.078) |
| Spatial memory | 0.19 | 0.19 | 0.04 | 0.18 |
| Attention (visual field bias) | 0.18 | 0.16 | 0.1 | 0.18 |
| Mean R2 across domains | 0.32 | 0.27 | 0.12 | 0.27 |
FDC = functional disconnection; LNM = lesion network mapping; SDC = structural disconnection.: aModel not significant.
In direct contrast to the conclusions of Salvalaggio et al., we found that lesion network mapping (i) predicted statistically significant variance in behavioural scores in nearly every domain (all except verbal memory); (ii) predicted identical overall variance compared to SDC mapping; and (iii) predicted similar variance compared to lesion location. In every case, lesion network mapping outperformed the FDC approach used by Salvalaggio et al., often by a wide margin (Table 1). Our lesion network maps also showed improvements in localization compared to the maps shown in Salvalaggio et al. For example, our lesion network map of language deficits aligned well with areas activated by language tasks (Fig. 1A). Our lesion network map of verbal memory mapped to the left hippocampus (Fig. 1B), a region with an established role in verbal memory.20–22 This level of neuroanatomical specificity was not present in any of FDC, SDC, or lesion location maps presented in Salvalaggio et al. There is a clear discrepancy between the results obtained using our standard lesion network mapping approach and the results reported by Salvalaggio et al.1 using their FDC approach. There are several methodological differences that may help explain this discrepancy.
Figure 1.
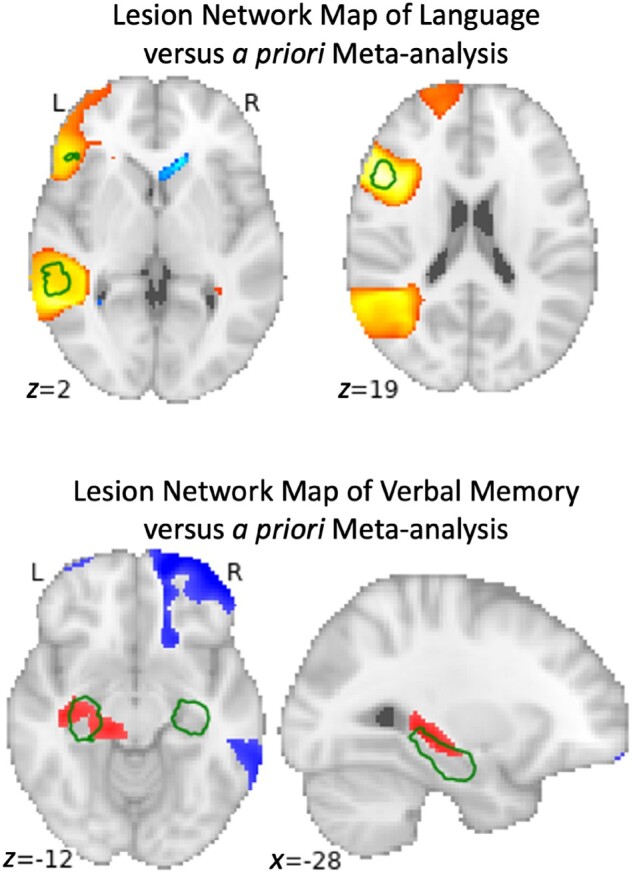
Comparison of voxel-wise univariate regression of post-stroke behavioural scores with a priori regions from the literature for language (top) and verbal memory (bottom). Permutation-based statistical testing was performed comparing the functional connectivity of each stroke location with the rest of the brain versus their post-stroke language or verbal memory score; representing the best and worst case scenarios across the eight factors in the study. The top image demonstrates locations (red) where lesion network mapping identified a strong statistically significant relationship with language scores, thresholded at a family-wise error-corrected P-value of 0.05, compared to a meta-analysis of regions associated with the term ‘language’ from Neurosynth in green, thresholded at z > 11. The bottom image demonstrates locations (red and blue) where lesion network mapping identified the strongest relationship with verbal memory scores, thresholded at an uncorrected P-value of 0.05, compared to a meta-analysis of associated with the term ‘hippocampus’ from Neurosynth in green, thresholded at z > 13.
First, different methods were used to generate our lesion networks compared to their FDC maps. Similar to other recent lesion network mapping studies from our group, we used a normative connectome from 1000 subjects collected on a 3 T MRI scanner6,23 while Salvalaggio et al. used a normative connectome from 176 subjects collected on a 7 T MRI scanner.24 The 5-fold difference in the number of subjects may be important. Recent work suggests that group connectivity estimates do not stabilize until cohorts exceed 150–200 subjects, and several reports suggest the need for much higher sample sizes.25-30 Second, 7 T scanners may be less sensitive to the functional MRI blood oxygen level-dependent (BOLD) signal used for functional connectivity outside of the cortex31 and more susceptible to signal loss, geometric distortions, and magnetic field inhomogeneity, particularly in deep structures.32,33 Some studies found a complete absence of deep nuclei BOLD activation at 7 T unless sequences are tailored for this purpose, particularly when multiband acceleration is used, as it was in the current 7 T dataset.34 The fact that most lesions in Salvalaggio et al. were deep subcortical lesions may inadvertently exaggerate the weaknesses of a 7 T connectome. Finally, Salvalaggio et al. used average Pearson’s correlation (r-values) as their measure of functional connectivity, whereas our lesion network mapping studies use T-values to incorporate variability in connectivity across subjects into the group-level connectivity estimate.6 This difference may become particularly important when using smaller connectome datasets with greater intersubject variability. Of note, Salvalaggio et al. used methods that incorporated intersubject variability into their SDC maps, but not their FDC maps.
Second, different methods were used to map and predict behavioural variance. We used a simple univariate method to identify behaviourally relevant networks, in contrast to the more complicated PCA/ridge-regression method used by Salvalaggio et al. (although some maps generated using a univariate method were included in the Supplementary material). The PCA/ridge-regression technique was derived for prediction of behavioural deficits based on lesion location2 and thus may not be the best technique for use with lesion network mapping/FDC data. PCA may oversimplify the data, eliminating variance that is useful for behavioural prediction. The authors recognize this issue, noting that PCA produced a small number of components with FDC maps (5–7 components) compared to the other modalities where their technique performed much better (12–58 components). Similarly, ridge regression relies on assumptions of linearity and constant variance,35 which may be violated by FDC/lesion network maps.
Finally, FDC/lesion network mapping data have a fundamental difference from lesion or SDC data, in that functional connections can be either positive or negative and higher values do not always indicate higher relevance. Methods originally developed for use with binary lesion location data may need to be modified to deal with this complexity. In Ferguson et al.17 and in the present analyses, we focused on positive connectivity values to simplify the analysis and allow for straightforward comparisons to lesion location and SDC data. However, previous lesion network mapping work suggests that the negative connections are important for symptoms such as depression,18 hallucinations,5,36 delusions,37 dystonia,38 and prosopagnosia.39 We put little effort into trying to optimize our prediction of behavioural deficits based on lesion network mapping data, and doubt our simple univariate method is optimal. Future work is needed to determine the best approach, including how best to combine the information provided by positive and negative functional connections.
In summary, we found that lesion network mapping predicts significance behavioural variance in nearly all domains, and predicts similar variance compared to SDC or lesion location. Even in the domain in which we failed to predict significant variance (verbal memory) we showed accurate neuroanatomical localization to the left hippocampus that was not matched by the other techniques. Our current findings are consistent with prior work showing that lesion network mapping can predict behavioural variance in depression scores18 and memory scores17 across independent datasets, which is generally considered a more stringent test of behavioural prediction than the leave-one-out method used in our current analyses and by Salvalaggio et al.1 Finally, lesion network mapping may be uniquely valuable for symptoms that depend on negative correlations between the lesion location and other brain regions,5,36-39 a phenomenon that may be hard to predict based solely on lesion location or SDC. We thank the authors of Salvalaggio et al. for their excellent paper and for motivating this discourse. We encourage further work by all groups to compare and improve different methods for predicting post-stroke behavioural deficits.
Data availability
Data availability is not applicable to this article as no new data were created or analysed in this study.
Funding
A.C. was supported by NIH K23MH120510 and the Child Neurology Foundation. M.D.F. was supported by the Sidney R. Baer, Jr. Foundation, the Nancy Lurie Marks Foundation, the Mather’s Foundation, and the NIH (grants R01 MH113929, R01 MH115949, and R01 AG060987).
Competing interests
The authors report no competing interests.
References
- 1. Salvalaggio A, De Filippo De Grazia M, Zorzi M. et al. Post-stroke deficit prediction from lesion and indirect structural and functional disconnection. Brain. 2020;143:2173-2188. [DOI] [PMC free article] [PubMed] [Google Scholar]
- 2. Corbetta M, Ramsey L, Callejas A, et al. Common Behavioral Clusters and Subcortical Anatomy in Stroke. Neuron. 2015;85:927-941. [DOI] [PMC free article] [PubMed] [Google Scholar]
- 3. Siegel JS, Ramsey LE, Snyder AZ, et al. Disruptions of network connectivity predict impairment in multiple behavioral domains after stroke. Proc Natl Acad Sci USA. 2016;113:E4367-E4376. [DOI] [PMC free article] [PubMed] [Google Scholar]
- 4. Foulon C, Cerliani L, Kinkingnéhun S, et al. Advanced lesion symptom mapping analyses and implementation as BCBtoolkit. GigaScience. 2018;7:1-17. [DOI] [PMC free article] [PubMed] [Google Scholar]
- 5. Boes AD, Prasad S, Liu H, et al. Network localization of neurological symptoms from focal brain lesions. Brain. 2015;138:3061-3075. [DOI] [PMC free article] [PubMed] [Google Scholar]
- 6. Cohen AL, Fox MD.. Reply: The influence of sample size and arbitrary statistical thresholds in lesion-network mapping. Brain. 2020;143:e41. [DOI] [PMC free article] [PubMed] [Google Scholar]
- 7. Fox MD. Mapping symptoms to brain networks with the human connectome. N Engl J Med. 2018;379:2237-2245. [DOI] [PubMed] [Google Scholar]
- 8. Albazron FM, Bruss J, Jones RM, et al. Pediatric postoperative cerebellar cognitive affective syndrome follows outflow pathway lesions. Neurology. 2019;93:E1561-E1571. [DOI] [PMC free article] [PubMed] [Google Scholar]
- 9. Klingbeil J, Wawrzyniak M, Stockert A, . et al. Hippocampal diaschisis contributes to anosognosia for hemiplegia: evidence from lesion network-symptom-mapping. NeuroImage. 2020;208:116485. [DOI] [PubMed] [Google Scholar]
- 10. Lee I, Nielsen K, Nawaz U, et al. Diverse pathophysiological processes converge on network disruption in mania. J Affect Disord. 2019;244:115-123. [DOI] [PMC free article] [PubMed] [Google Scholar]
- 11. Lim J-S, Lee J-J, Woo C-W, et al. Individual-level lesion-network mapping to visualize the effects of a stroke lesion on the brain network: connectograms in stroke syndromes. J Clin Neurol. 2020;16:116-123. [DOI] [PMC free article] [PubMed] [Google Scholar]
- 12. Mansouri AM, Germann J, Boutet A, et al. Identification of neural networks preferentially engaged by epileptogenic mass lesions through lesion network mapping analysis. Sci Rep. 2020;10:10989. [DOI] [PMC free article] [PubMed] [Google Scholar]
- 13. Mithani K, Boutet A, Germann J, et al. Lesion network localization of seizure freedom following mr-guided laser interstitial thermal ablation. Sci Rep. 2019;9:18598. [DOI] [PMC free article] [PubMed] [Google Scholar]
- 14. Philippi CL, Bruss J, Boes AD, et al. Lesion network mapping demonstrates that mind-wandering is associated with the default mode network. J Neurosci Res. 2021;99:361-373. [DOI] [PMC free article] [PubMed] [Google Scholar]
- 15. Sutterer MJ, Bruss J, Boes AD, et al. Canceled connections: lesion-derived network mapping helps explain differences in performance on a complex decision-making task. Cortex J Devoted Study Nerv Syst Behav. 2016;78:31-43. [DOI] [PMC free article] [PubMed] [Google Scholar]
- 16. Wawrzyniak M, Klingbeil J, Zeller D. et al. The neuronal network involved in self-attribution of an artificial hand: a lesion network-symptom-mapping study. NeuroImage. 2018;166:317-324. [DOI] [PubMed] [Google Scholar]
- 17. Ferguson MA, Lim C, Cooke D, et al. A human memory circuit derived from brain lesions causing amnesia. Nat Commun. 2019;10:3497. [DOI] [PMC free article] [PubMed] [Google Scholar]
- 18. Padmanabhan JL, Cooke D, Joutsa J, et al. A human depression circuit derived from focal brain lesions. Biol Psychiatry. 2019;86:749-758. [DOI] [PMC free article] [PubMed] [Google Scholar]
- 19. Winkler AM, Ridgway GR, Webster MA. et al. Permutation inference for the general linear model. NeuroImage. 2014;92:381-397. [DOI] [PMC free article] [PubMed] [Google Scholar]
- 20. Bonner-Jackson A, Mahmoud S, Miller J. et al. Verbal and non-verbal memory and hippocampal volumes in a memory clinic population. Alzheimers Res Ther. 2015;7:61. [DOI] [PMC free article] [PubMed] [Google Scholar]
- 21. de Toledo-Morrell L, Dickerson B, Sullivan MP, . et al. Hemispheric differences in hippocampal volume predict verbal and spatial memory performance in patients with Alzheimer’s disease. Hippocampus. 2000;10:136-142. [DOI] [PubMed] [Google Scholar]
- 22. Kilpatrick C, Murrie V, Cook M. et al. Degree of left hippocampal atrophy correlates with severity of neuropsychological deficits. Seizure. 1997;6:213-218. [DOI] [PubMed] [Google Scholar]
- 23. Holmes AJ, Hollinshead MO, O’Keefe TM, et al. Brain Genomics Superstruct Project initial data release with structural, functional, and behavioral measures. Sci Data. 2015;2:150031. [DOI] [PMC free article] [PubMed] [Google Scholar]
- 24. Vu AT, Auerbach E, Lenglet C, et al. High resolution whole brain diffusion imaging at 7 T for the Human Connectome Project. NeuroImage. 2015;122:318-331. [DOI] [PMC free article] [PubMed] [Google Scholar]
- 25. Cremers HR, Wager TD, Yarkoni T.. The relation between statistical power and inference in fMRI. PLoS ONE. 2017;12:e0184923. [DOI] [PMC free article] [PubMed] [Google Scholar]
- 26. Cui Z, Gong G.. The effect of machine learning regression algorithms and sample size on individualized behavioral prediction with functional connectivity features. NeuroImage. 2018;178:622-637. [DOI] [PubMed] [Google Scholar]
- 27. Dansereau C, Benhajali Y, Risterucci C, et al. Statistical power and prediction accuracy in multisite resting-state fMRI connectivity. NeuroImage. 2017;149:220-232. [DOI] [PubMed] [Google Scholar]
- 28. Marek S, Tervo-Clemmens B, Calabro FJ, et al. Towards Reproducible Brain-Wide Association Studies. bioRxiv. 2020: 2020.08.21.257758.
- 29. Turner BO, Paul EJ, Miller MB, . et al. Small sample sizes reduce the replicability of task-based fMRI studies. Commun Biol. 2018;1:62. [DOI] [PMC free article] [PubMed] [Google Scholar]
- 30. Varoquaux G. Cross-validation failure: small sample sizes lead to large error bars. NeuroImage. 2018;180:68-77. [DOI] [PubMed] [Google Scholar]
- 31. De Martino F, Yacoub E, Kemper V, et al. The impact of ultra-high field MRI on cognitive and computational neuroimaging. NeuroImage. 2018;168:366-382. [DOI] [PubMed] [Google Scholar]
- 32. de Hollander G, Keuken MC, W van der Z, . et al. Comparing functional MRI protocols for small, iron-rich basal ganglia nuclei such as the subthalamic nucleus at 7 T and 3 T. Hum Brain Mapp. 2017;38:3226-3248. [DOI] [PMC free article] [PubMed] [Google Scholar]
- 33. Uğurbil K, Xu J, Auerbach EJ, et al. Pushing spatial and temporal resolution for functional and diffusion MRI in the Human Connectome Project. NeuroImage. 2013;80:80-104. [DOI] [PMC free article] [PubMed] [Google Scholar]
- 34. Miletić S, Bazin P-L, Weiskopf N, . et al. Trampel R. fMRI protocol optimization for simultaneously studying small subcortical and cortical areas at 7T. NeuroImage. 2020;219:116992. [DOI] [PubMed] [Google Scholar]
- 35. Hoerl AE, Kennard RW.. Ridge Regression: Biased Estimation for Nonorthogonal Problems. Technometrics. 1970;12:55-67. [Google Scholar]
- 36. Kim NY, Hsu J, Talmasov D, et al. Lesions causing hallucinations localize to one common brain network. Mol Psychiatry. 2019. doi: 10.1038/s41380-019-0565-3 [DOI] [PubMed] [Google Scholar]
- 37. Darby RR, Laganiere S, Pascual-Leone A, . et al. Finding the imposter: brain connectivity of lesions causing delusional misidentifications. Brain. 2017;140:497-507. [DOI] [PMC free article] [PubMed] [Google Scholar]
- 38. Corp DT, Joutsa J, Darby RR, et al. Network localization of cervical dystonia based on causal brain lesions. Brain. 2019;142:1660-1674. [DOI] [PMC free article] [PubMed] [Google Scholar]
- 39. Cohen AL, Soussand L, Corrow SL, . et al. Looking beyond the face area: lesion network mapping of prosopagnosia. Brain. 2019;142:3975-3990. [DOI] [PMC free article] [PubMed] [Google Scholar]
Associated Data
This section collects any data citations, data availability statements, or supplementary materials included in this article.
Data Availability Statement
Data availability is not applicable to this article as no new data were created or analysed in this study.