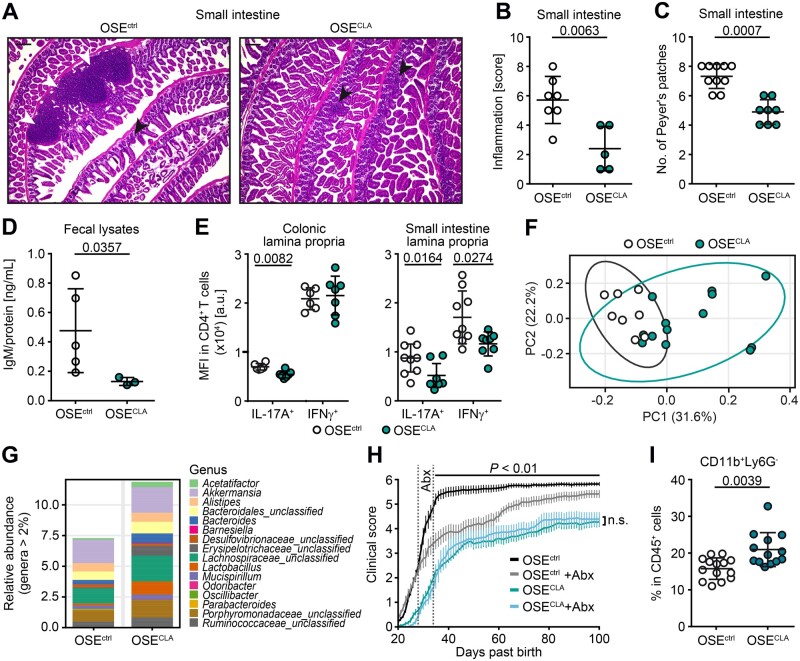
Figure 2.
CLA supplementation reduces intestinal inflammation in OSE mice. (A) Haematoxylin and eosin (HE)-stained small intestine tissue slices of representative OSEctrl and OSECLA mice (black arrows = mucosal inflammatory cell infiltrates; white arrows = submucosal inflammation/expanding lymphoid follicles). (B) Histopathological intestinal inflammation score of the small intestine was assessed for OSEctrl (n = 7) and OSECLA mice (n = 5). (C) Total counts of Peyer’s patches in the small intestine of OSEctrl (n = 10) and OSECLA mice (n = 8) as well as (D) concentrations of faecal immunoglobulin M (IgM) normalized to total protein amount in OSEctrl (n = 5) and OSECLA mice (n = 3) are shown. (E) Representative MFI of cytokine expression in intestinal CD4+ T cells is illustrated for age-matched OSEctrl (n ≥ 6) and OSECLA mice (n ≥ 7). (F and G) Analysis of the gut microbiome of OSEctrl (n = 8) and OSECLA mice (n = 13) is shown as (F) PCA and (G) bar graph of the relative abundance at the genus level. (H) Short-term treatment with antibiotics (Abx) has been applied to OSEctrl + Abx (n = 9) and OSECLA +Abx mice (n = 9). The clinical scores of these mice and their non-antibiotic-treated controls (OSEctrln = 17; OSECLAn = 15) are illustrated as mean group scores over time ± SEM. (I) Frequency of colonic MDSC-like cells (CD11b+ Ly6G−) in OSEctrl (n = 14) versus OSECLA mice (n = 13) was determined via flow cytometry. Scatter dot plots depict mean ± SD, whereas each dot represents one individual mouse. Statistics: (H) two-way ANOVA with Bonferroni correction; (B–E and I) Mann-Whitney U-test. Scale bars = 200 µm; n.s. = not significant.

