

Abstract
Objective –
Vascular calcification is a critical pathology associated with increased cardiovascular event risk, but there are no FDA-approved anti-calcific therapies. We hypothesized and validated that an unbiased screening approach would identify novel mediators of human vascular calcification.
Approach and Results –
We performed an unbiased quantitative proteomics and pathway network analysis that identified increased carnitine O-octanoyltransferase (CROT) in calcifying primary human coronary artery smooth muscle cells (SMCs). Additionally, human carotid artery atherosclerotic plaques contained increased immunoreactive CROT near calcified regions. CROT siRNA reduced fibrocalcific response in calcifying SMCs. In agreement, histidine 327 to alanine point mutation inactivated human CROT fatty acid metabolism enzymatic activity and suppressed SMC calcification. CROT siRNA suppressed type 1 collagen secretion, and restored mitochondrial proteome alterations and suppressed mitochondrial fragmentation in calcifying SMCs. Lipidomics analysis of SMCs incubated with CROT siRNA revealed increased eicosapentaenoic acid, a vascular calcification inhibitor. CRISPR/Cas9-mediated Crot deficiency in low-density lipoprotein receptor-deficient mice reduced aortic and carotid artery calcification without altering bone density, or liver and plasma cholesterol and triglyceride concentrations.
Conclusions –
CROT is a novel contributing factor in vascular calcification via promoting fatty acid metabolism and mitochondrial dysfunction, as such CROT inhibition has strong potential as an anti-fibrocalcific therapy.
Keywords: CROT, cardiovascular calcification, smooth muscle cells, mitochondria, EPA, proteomics, lipidomics
Subject codes: Cell Signaling/Signal Transduction, Vascular Disease
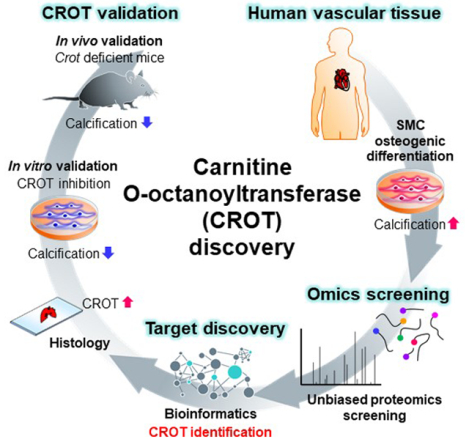
Graphical Abstract
Introduction
Cardiovascular disease is the leading cause of death worldwide, with vascular calcification increasing cardiovascular event risk.1,2 We and others have demonstrated cardiovascular calcification is an actively regulated process involving osteogenic differentiated vascular smooth muscle cells (SMCs) releasing calcifying extracellular vesicles that form microcalcifications in collagen extracellular matrix.3–7 Microcalcifications in thin atherosclerotic plaque cap may contribute to plaque destabilization and rupture8, leading to myocardial infarction and stroke.
The molecular mechanisms underlying osteogenic differentiation of SMCs are unclear. Calcifying SMCs have increased mitochondrial fragmentation, promoted by a mitochondrial and peroxisomal fission protein, dynamin-related protein 1.5 Peroxisomes and mitochondria are cellular organelles in which fatty acid metabolism occurs in eukaryotes. Whether fatty acid metabolism plays a critical mechanistic role in cardiovascular calcification has not been definitively demonstrated beyond exogenous administration of ω3-polyunsaturated fatty acids in model systems. ω3-Polyunsaturated fatty acids, eicosapentaenoic acid (EPA) and docosahexaenoic acid are anti-inflammatory agonists that suppress vascular calcification when incubated with cultured vascular cells or are administered to non-atherosclerotic rodent models of vascular calcification.9–12 Whether endogenously produced ω3-polyunsaturated fatty acids suppress vascular calcification and the mechanistic role of ω3-polyunsaturated fatty acids in atherosclerotic calcification is unclear. While somewhat controversial and requiring validation in large cohort human studies, ω3-Polyunsaturated fatty acids have been inversely associated with coronary artery calcification in a small patient cohort.13 Increased ω3-polyunsaturated fatty acids associated with reduced coronary artery calcification in a study comparing Japanese to Caucasian men.14 Additionally, fatty acid desaturase activity and docosahexaenoic acid are decreased in calcified human aortic valve tissues.15 Together, these studies implicate a role of fatty acid metabolism in cardiovascular calcification.
Changes in vascular SMC phenotype are linked to alterations in mitochondrial metabolism.16 β-oxidation is a metabolic process through which fatty acids are broken down starting in peroxisomes and then in mitochondria to generate acetyl-CoA, which functions in the citric acid cycle and electron transport train. Mammalian peroxisomes do not fully β-oxidize medium-chain fatty acid intermediates, medium- and long-chain acyl-CoA molecules, that require further metabolism in mitochondria. Carnitine O-octanoyltransferase (CROT), is enzyme involved in transport of medium- and long-chain acyl-CoA out of peroxisomes.16 CROT trans-esterifies medium- and long-chain fatty acyl chains and belongs to a carnitine acyltransferase family that catalyze a reversible reaction of L-carnitine + acyl-CoA ⇄ acyl-L-carnitine + CoASH.17,18 In HepG2 human liver cells, overexpression and gene silencing of CROT decreases and increases long-chain fatty acids, respectively.19 Whether CROT is mechanistically involved in vascular calcification is unknown, but its role in fatty acid metabolism strongly supports this possibility. To discover novel inducers of vascular calcification with therapeutic anti-calcification drug potential, we performed an unbiased proteomics and pathway network analysis that identified CROT as a novel contributing factor in human SMCs calcification. A finding we validated in a mouse model of atherosclerotic calcification.
Materials and Methods
Additional detailed materials and methods are included in the Supplemental Materials.
Cell culture and osteogenic induction
Human coronary artery SMCs (PromoCell, Cat#: C-12511) were cultured in SMC growth medium 2 (PromoCell, Cat#: C-22062) for subculture. To induce osteogenic transduction, cells were cultured in osteogenic medium (OM; Dulbecco’s modified Eagle medium with 4.5 g/L glucose (DMEM) (Thermo Fisher Scientific, Cat#: 10569010), 10% fetal bovine serum (FBS), 10 mM β-glycerophosphate disodium salt pentahydrate, 100 μM L-ascorbic acid 2-phosphate sesquimagnesium salt hydrate, 10 nM dexamethasone or control normal medium (NM; DMEM, 10% FBS).
CROT siRNA
siRNA incubation was performed using ON-TARGETplus siRNA for CROT (Horizon Discovery, CROT: J-009230–08) or ON-TARGETplus Non-targeting Control Pool scrambled siRNA (Horizon Discovery, Cat#: D-001810-10-20) with DharmaFECT 1 transfection reagent (Horizon Discovery, Cat#: T-2001–03). Final concentration of siRNA was adjusted to 20 nM and transfected siRNA was performed according to the manufacturer’s protocol. Human vascular SMCs were seeded at day −5 (5 days before media exchange to OM) with 0.8×10⁵ cells/mL in smooth muscle cell growth medium 2 in 6-well plates for proteomic experiments or 24-well plates for real-time PCR, TNAP activity assay, and Alizarin red staining. Smooth muscle cell growth medium 2 was replaced with NM and the first transfection of siRNA was performed the following day (day −4). During the next medium exchange at day −2, siRNA incubation was also performed. Day 0 indicates when media was exchange from NM to OM (or continued with NM for controls). After day 0, media exchange and transfection of siRNA were performed every 3–4 days.
CROT enzymatic activity assay
H327A-CROT-FLAG expression plasmid vector was made using CROT (NM_021151) Human Tagged ORF Clone (OriGene, RC207888) and site mutagenesis. HEK293 cells were transfected with CROT-FLAG or H327A-CROT-FLAG plasmid vector using Lipofectamine™ 3000 Transfection Reagent (Thermo Fisher Scientific Inc., Cat#: L3000015) according to manufacturer’s protocol. 2 days after the transfection, cells were harvested using Pierce™ IP Lysis Buffer (Thermo Fisher Scientific Inc., Cat#: 87788). CROT-FLAG and H327A-CROT-FLAG proteins were purified using ANTI-FLAG® M2 Affinity Gel (Sigma-Aldrich, Inc., Cat#: A2220) according to manufacturer’s protocol. Enzymaticactivity of CROT and H327A-CROT was measured using 0.1, 0.2 and 0.5 μg recombinant CROT-FLAG or H327A-CROT-FLAG incubated with 500 μM Octanoyl coenzyme A lithium salt hydrate (Sigma-Aldrich, Inc., Cat#: O6877), 2 mM L-Carnitine hydrochloride (Sigma-Aldrich, Inc., Cat#: C0283) and 125 μM Aldrithiol™−4 (Sigma-Aldrich, Inc., Cat#: 143057) in 0.2 mL of 25 mM potassium phosphate buffer (pH 7.4). Absorbance was measured at 324 nm on a 96-well plate reader.
Crot−/−Ldlr−/− mice
Crot−/− mice were produced by deleting Crot exon 3 that includes a start codon in Crot in C57BL/6J mice with a CRISPR-Cas9 method (The Jackson Laboratory). Sequences of sgRNA targeting intron 2 and 3 of Crot are listed in Supplemental Major Resources Table. After three generations of backcrossing, crossbreeding of Crot−/− mice with Ldlr−/− mice (The Jackson Laboratory, Cat#: 002207) was performed. Genotype was decided through genome DNA PCR using the listed primers (see Supplemental Major Resources Table) and LongAmp® Taq PCR Kit (New England Biolabs., Cat#: E5200S) according to manufacturer’s protocol.
In vivo vascular calcification imaging
10-week-old male Cro+/+Ldlr−/− or Crot−/−Ldlr−/− mice were fed high-fat and high cholesterol diet (Research Diets, Inc., Cat#: D12108CO) for 15 weeks to induce cardiovascular calcification. 100 μL OsteoSense680EX fluorescent imaging agent (PerkinElmer Inc., Cat#: NEV10020EX) was administered intravenously via tail vein into mice 24 hours before dissection. In vivo NIRF signals were obtained by assessing OsteoSense680EX signal in carotid arteries imaged using a fluorescent microscopy (Olympus Corporation) and mice under anesthesia. After euthanizing mice, cardiovascular tissues were perfused with saline and dissected. NIRF signals were obtained by assessing OsteoSense680EX in cardiovascular tissues imaged ex vivo using a KODAK Image Station 4000MM (Eastman Kodak Company) and analyzed using KODAK Molecular Imaging Software. All animal experiments were approved by and performed in compliance with Beth Israel Deaconess Medical Center’s Institutional Animal Care and Use Committee (protocol#: 010–2016). Male mice were used in this initial study characterizing CROT inhibition due to sex differences in male and female fatty acid and lipid metabolism20 that could impact data interpretation.
Mass spectrometry data
All mass spectrometry and resulting search data have been deposited to the ProteomeXchange Consortium via the PRIDE partner repository21 with the dataset identifier PXD022575.
Statistical analysis
Analysis of variance (ANOVA) with Dunn’s, Dunnett’s, or Tukey’s multiple comparison testing and Student’s t-tests were performed using Prism 8 (GraphPad, La Jolla, CA). The normality and variance were not tested to determine whether the applied parametric tests were appropriate.
Results
Unbiased proteomics and pathway network analysis revealed CROT as a novel vascular calcification contributing factor
To identify novel contributing factors in vascular calcification, we first performed tandem mass tagging proteomics using primary human coronary artery SMCs cultured in control normal medium (NM) or calcification-inducing osteogenic medium (OM) (Figure 1A). The proteomics data were combined, and we identified a total of 3,638 common proteins among our experimental conditions, timepoints and donors (Figure 1B). We next focused on proteins that were increased in OM compared to NM, from which 198 proteins were detected (Figure 1B). Enrichment in pathways from KEGG, BioCarta and Reactome was used to analyze the 198 proteins increased in OM. Significant pathways from this analysis included pathways related to metabolism, tricarboxylic acid (TCA) cycle, respiratory electron transport, and peroxisomal function (Figure 1C and Supplemental file I). We next made a pathway network using all significant pathways (P<0.05) obtained through pathway enrichment analysis of the 198 increased proteins, from which we identified 10 pathways that had the highest betweenness centrality, an indicator that these may be intermediary pathways potentially crucial to the communication between all significantly enriched pathways due to their “bottleneck” status in the network (Figure 1D). Top ranked pathways included ones related to peroxisome and lipid metabolism (Figure 1C and 1D). CROT was a key protein commonly identified in most of these top betweenness centrality pathways including: metabolism (-log(P)=11.2, Reactome), peroxisome (-log(P)=5.55, KEGG), peroxisomal protein import (-log(P)=5.29, Reactome), peroxisomal lipid metabolism (-log(P)=3.62, Reactome), metabolism of lipids (-log(P)=3.18, Reactome) and fatty acid metabolism (-log(P)=2.43, Reactome) (Figure 1C and Supplemental file I). Furthermore, CROT protein levels increased when SMC media was switched from NM to OM (Supplemental figure IA). These data suggested CROT is induced in calcifying SMCs and is associated with several pathways likely contributing to SMC osteogenic differentiation. Therefore, we focused our study on assessing a novel role of CROT in vascular calcification.
Figure 1.
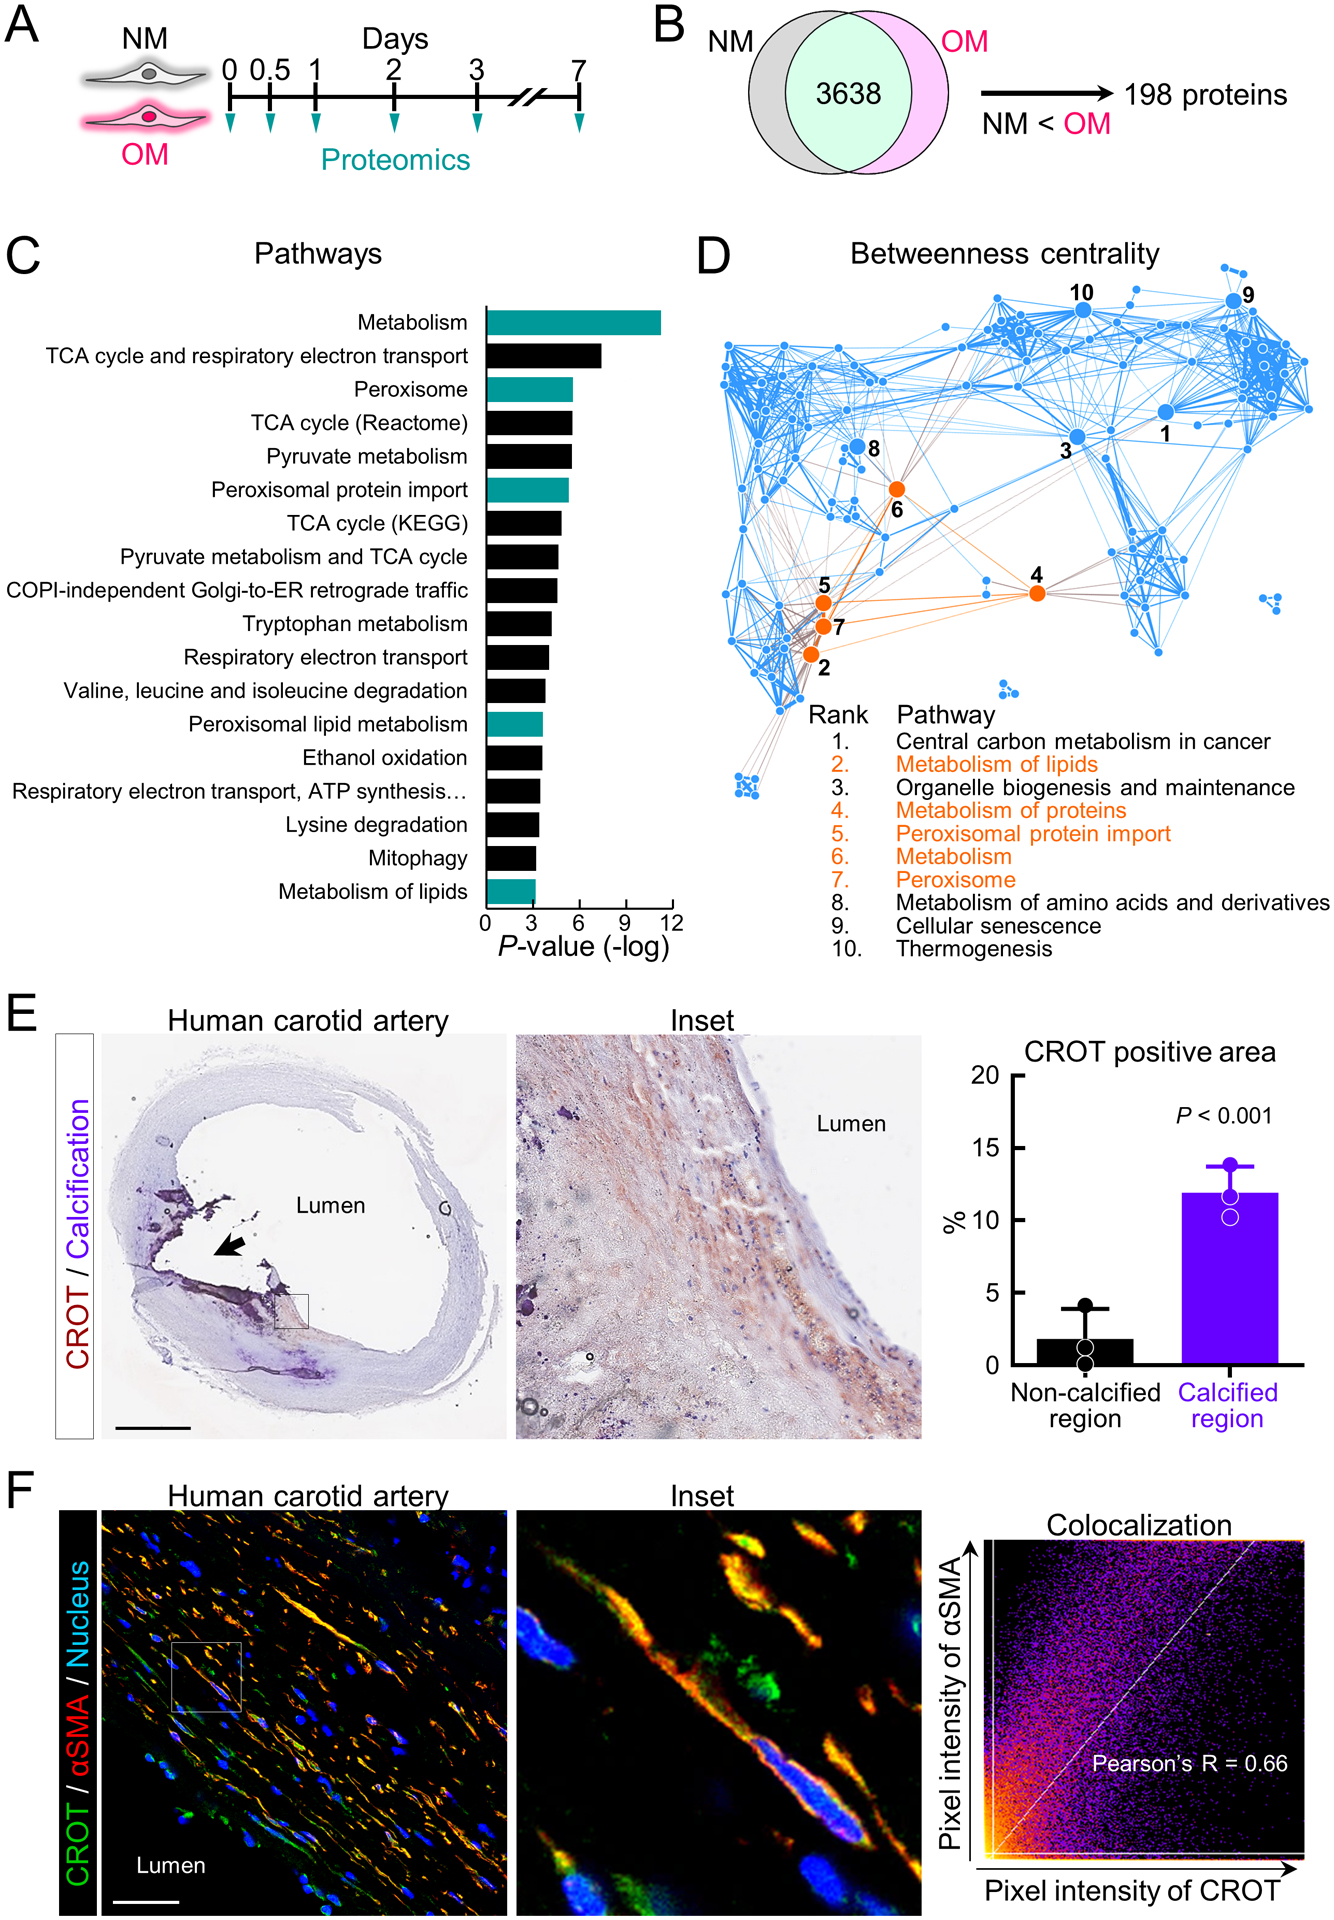
Human SMC CROT increased in osteogenic differentiation and in calcified human carotid artery regions. (A) Cartoon outline calcifying human vascular SMCs proteomic analysis. Proteomics data of each timepoint were combined for this analysis. (B) Cartoon outlining identification of human vascular SMCs proteins increased in OM. (C) Top ranked OM enriched pathways using KEGG, BioCarta and Reactome databases. Pathways including CROT were highlighted (turquoise color). (D) Pathway network using all pathways (P<0.05) obtained through pathway enrichment analysis of proteins increased in OM. Top 10 pathways for high betweenness centrality marked with ranked number. Pathways including CROT were highlighted (orange). (E) Representative image of immunohistochemistry for CROT in calcified human carotid artery was shown (CROT, red-brown color, calcification, purple color, scale bar, 2 mm). Black arrow indicates macro calcification region. CROT positive area enlarged (inset). Quantified CROT positive area in non-calcified or calcified regions shown in right panel (n=3 donors, error bars are mean±SD, analyzed by Student’s t-test). (F) Representative image of CROT and αSMA immunofluorescence in calcified human carotid artery (CROT, green color, αSMA, red color, nucleus, blue color, scale bar, 20 μm). Representative enlarged image of CROT+/αSMA+ cells (inset). Correlation analysis of CROT with αSMA channel (right panel); n=3 donors.
To validate our SMC findings, we next performed ex vivo CROT immunohistochemistry in calcified human atherosclerotic plaques (n=3). In agreement with our in vitro data, immunoreactive CROT was increased around calcified regions of human arteries compared to non-calcified regions (Figure 1E). Significant colocalization of CROT and α-smooth muscle cell actin (αSMA) was observed by immunofluorescence in calcified human artery tissues (Figure 1F). These data validated increased CROT in calcifying human artery tissue SMC.
CROT inhibition reduced SMC calcification
To evaluate effects of CROT inhibition on vascular calcification, we performed two separate but complimentary assays, gene silencing and point mutation mediated CROT enzyme inactivity. We first inhibited CROT by siRNA in human SMCs. CROT siRNA efficiency was verified by label-free CROT targeted mass spectrometry using actin related protein 2 as an internal control for an unchanged protein following CROT siRNA incubation. CROT peptides (VLNDINQAK, amino acids 426–434; FQSGIGEK, 108–115) were increased in OM incubated with scrambled siRNA, and CROT protein levels were decreased in OM with CROT siRNA (Figure 2A and 2B, Supplemental figure I-B–D). We further validated these proteomics results showing reduced CROT following CROT siRNA incubation by quantitative real-time PCR (Figure 2C). Tissue-nonspecific alkaline phosphatase (TNAP) activity, a key regulator of OM-induced SMC calcification3, was suppressed by CROT siRNA in OM (Figure 2D). Using a cell proliferation assay, we observed that SMC hyperproliferation induced by osteogenic medium was suppressed by CROT siRNA (Supplemental figure II-A). Additionally, solute carrier family 20 member 1 (SLC20A1) that involved in a mineralization process22, was suppressed by CROT siRNA in OM (Supplemental figure II-B). We next assessed a fibrocalcific response in SMCs treated with CROT siRNA by two different methods, Alizarin red staining and OsteoSense680 near-infrared fluorescence.23 Alizarin red staining was decreased with CROT siRNA incubation in OM (Figure 2E). In agreement, confocal microscopy analysis of SMCs stained with OsteoSense680 and collagen CNA probe showed reduced fibrocalcific response when incubated in OM with CROT siRNA (Figure 2F). We validated reduced collagen secretion in SMCs treated with OM and CROT siRNA using a pro-collagen 1A1 ELISA (Figure 2F and Supplemental figure II-C).
Figure 2.
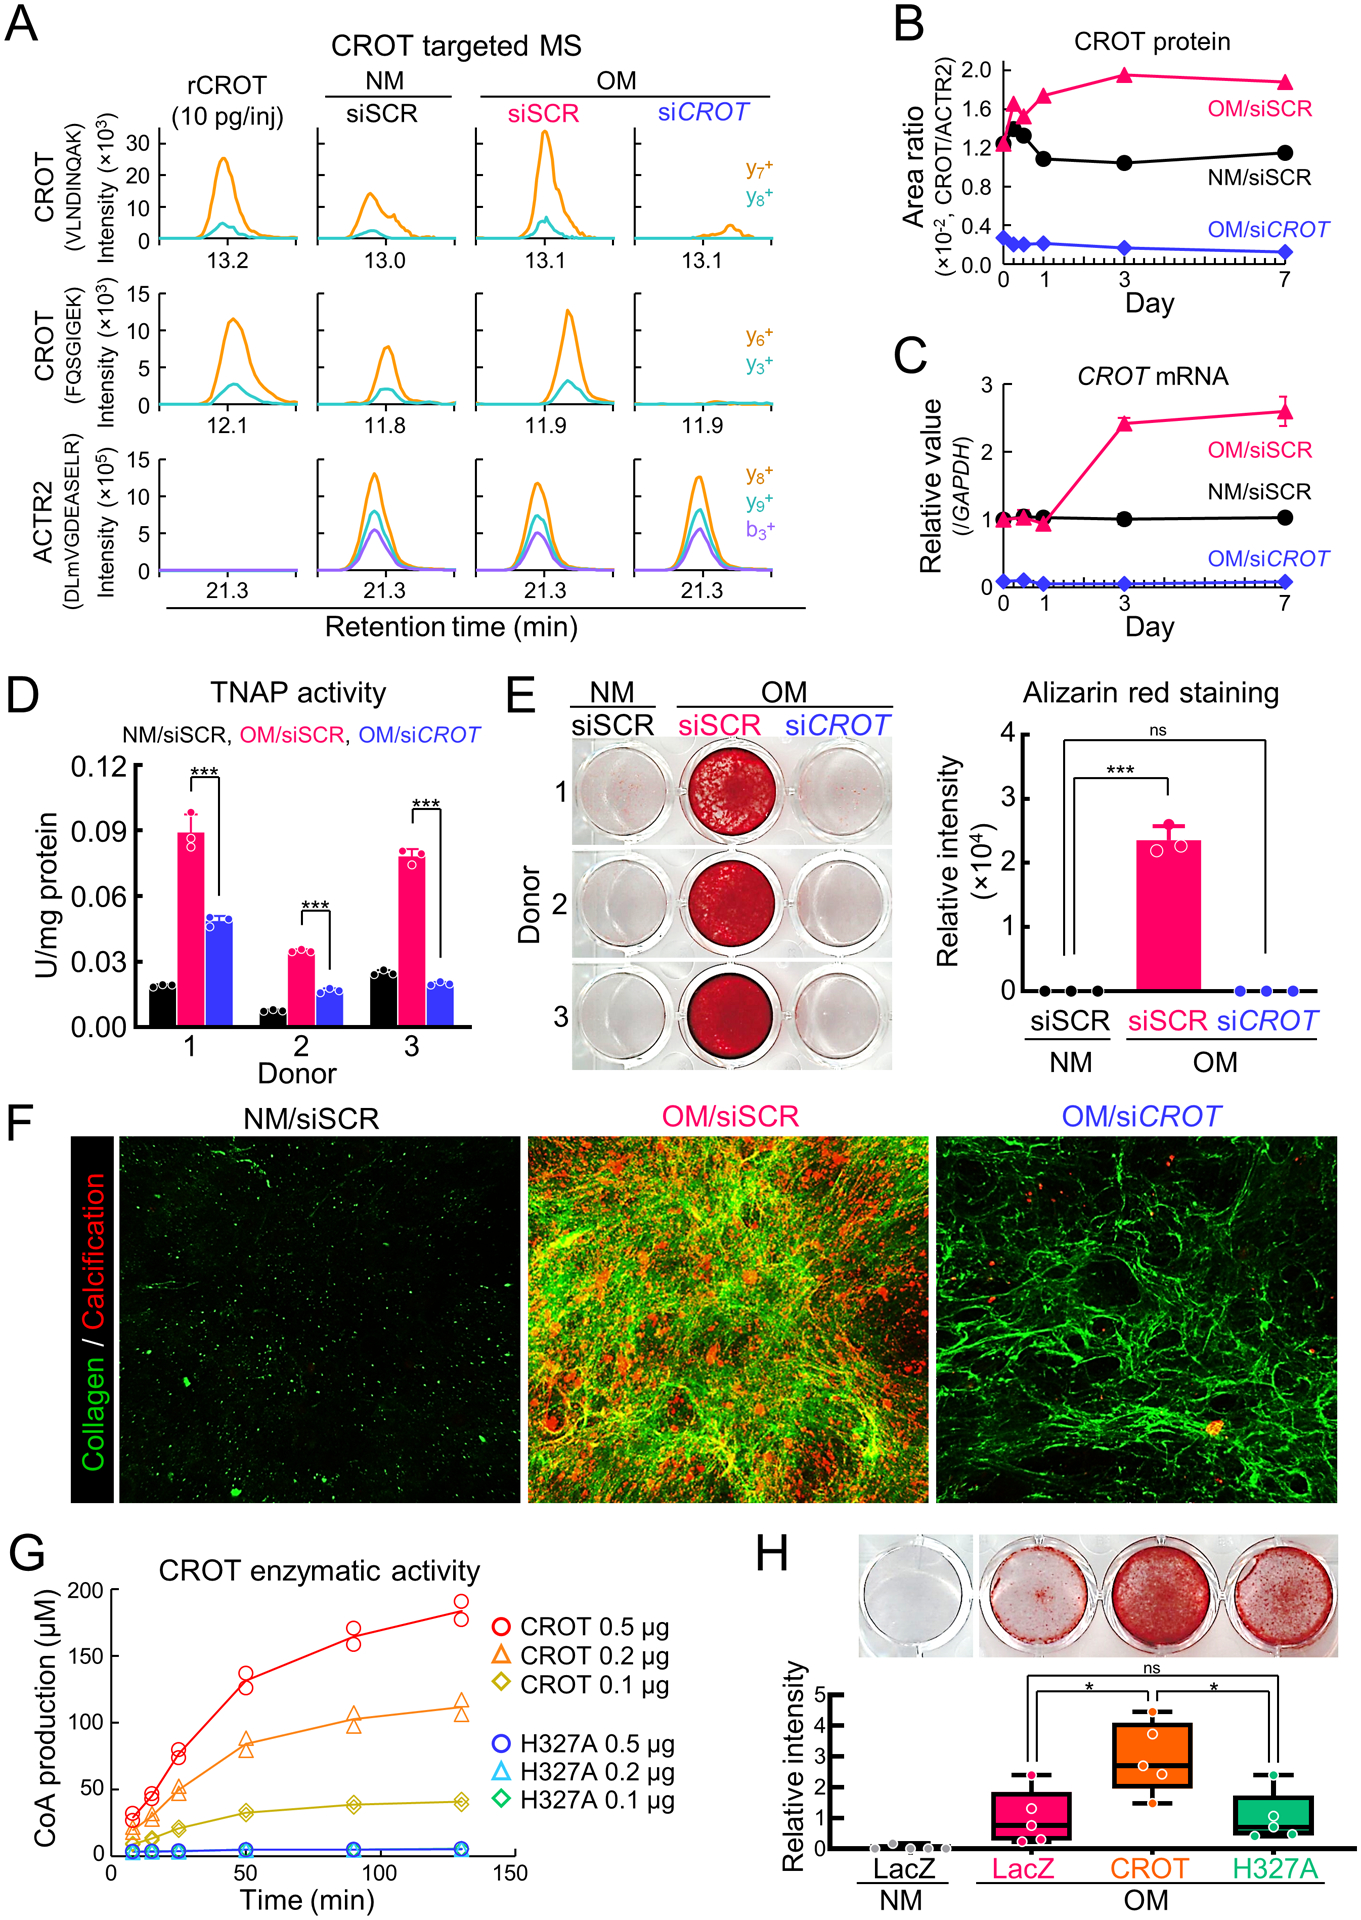
CROT inhibition reduced human vascular SMCs calcification. (A) Human vascular SMCs CROT targeted mass spectrometry (MS) incubated for three days in NM or OM with scrambled siRNA(siSCR) or CROT siRNA (siCROT). Two CROT peptides (VLNDINQAK and FQSGIGEK) and one negative control ACTR2 peptide (DLmVGDEASELR) used for the calculation of peak area ratio shown. Quantified y- and b-ion fragments color-labeled. Supplemental figure IB contains additional details. (B) Representative CROT targeted MS peak area ratio of CROT at day 0, 0.25, 0.5, 1, 3, and 7. (C) Representative CROT mRNA levels in human vascular SMCs at day 0, 0.5, 1, 3, and 7; 3 technical replicates, error bars are mean±SE. (D) TNAP activity in human vascular SMCs treated as in (A) for 14 days; n=3 donors, error bars are mean±SD, assessed by ANOVA with Tukey’s multiple comparison test, ***P<0.001. (E) Alizarin red stain and quantification for human vascular SMCs treated as in (A) for 21 days; n=3 donors, error bars are mean±SD, analyzed by ANOVA with Dunnett’s test (vs NM +siSCR), ***P<0.001, ns: not significant. (F) Representative collagen and calcification stained using CNA probe (green color) and OsteoSense680 (red color) For human vascular SMCs treated as in (A) for 21 days. (G) Enzymatic activity of unmodified CROT (CROT) and H327A point mutated CROT (H327A); n=2 replicates and 3 concentrations assessed. Mean values of CoA (μM) at each time point indicated by connected lines. (H) Alizarin red stain and quantification for human vascular SMCs transduced with LacZ, unmodified CROT, H327A CROT cultured for 14 days; n=5 donors, graphed as box-and-whiskers plots, analyzed by ANOVA with Tukey’s multiple comparison test, *P<0.05, ns: not significant.
We next evaluated effects of enzymatically inactivated CROT on SMC calcification. Human CROT catalytic active site has not been reported; therefore, we referred to information on mouse CROT structure.24 Based on sequence similarity between human and mouse CROT, we hypothesized that histidine 327 was part of a catalytic active site in human CROT. We generated human CROT in which histidine 327 was replaced with alanine (H327A-CROT) and assessed CROT fatty acid metabolism enzyme activity. H327A-CROT did not show CROT catalytic activity compared to unmodified CROT (Figure 2G). To evaluate effects of H327A-CROT on calcification, we overexpressed H327A-CROT in SMCs using an adenoviral vector. Alizarin red staining demonstrated reduced calcification in H327A-CROT overexpressing cells compared to unmodified CROT overexpressing SMCs (Figure 2H). These data demonstrate CROT is a novel fibrocalcific response contributing factor in human SMCs.
Proteomics network analysis revealed CROT silencing suppressed calcification by correcting mitochondrial dysfunction
To identify a mechanism through which CROT inhibition suppressed calcification in SMCs, we first performed a multiplexed high-dimensional clustering analysis using our custom made XINA software25,26 on the proteomics datasets of CROT siRNA suppressed SMC proteins. For each donor, protein levels in OM with scrambled siRNA and CROT siRNA were normalized to protein levels in NM with scrambled siRNA throughout the culture time course, converting three proteomics datasets into two (per donor) that were subsequently combined into a single dataset and analyzed by XINA. Using a time-dependent assessment from 3 to 21 days in culture, we identified 8 clusters through k-means clustering that best describe the time-dependent variation in both scrambled and CROT siRNA NM-normalized OM conditions (Figure 3A and 3B). Cluster #1 and #2 contained stable protein level patterns throughout the entire culture time course, so we defined those clusters as normal pattern clusters. We then defined clusters #3–8 as peak clusters (cluster #3 peak at day 3, cluster #4 peak at day 7, cluster #5 peak at day 14, clusters #6–8 peak at day 21). Next, we identified a total of 38 proteins that existed in peak clusters under OM with scrambled siRNA and in normal pattern clusters under OM with CROT siRNA (Figure 3B). The protein level pattern of these 38 proteins was altered by OM and restored by CROT siRNA, so we defined these proteins as restoration proteins. We also assessed early timepoints data sets (0hr, 6hr, 12hr, and 24hr), but no proteins were shared amongst the three donors. To reveal pathways that were restored by CROT siRNA, we performed enrichment analysis using restoration proteins. Enrichment analysis demonstrated most restored proteins were related to the citric acid cycle (88.14%) (Figure 3C and Supplemental table I), and that composition was similar to that of a mitochondrial protein set (Figure 3C). To clarify a relation among restoration proteins, mitochondrial proteins, and calcification related proteins27, we next performed pathway enrichment analysis using this protein data set. A significant association of restoration proteins with mitochondrial and calcification proteins/pathways was observed (Figure 3D, Supplemental materials, and Supplemental table I). We previously reported mitochondrial fragmentation increases TNAP activity and fibrocalcific response in vascular SMCs.5 Therefore, to validate if CROT silencing corrected calcification via restoring mitochondrial function as suggested by our proteomics analysis, we assessed SMC mitochondria under osteogenic conditions. To do this we used live cell confocal microscopy MitoTracker Red imaging that stains for mitochondrial membrane potential, a general marker of mitochondrial function. In addition, a mitochondrial membrane potential assay using tetramethylrhodamine ethyl ester (TMRE) reagent was performed. In agreement with our proteomics findings, CROT siRNA corrected mitochondrial dysfunction in OM, as mitochondria fragmentation and reduction of membrane potential were improved by CROT siRNA in calcifying human SMCs (Figure 3E and Supplemental figure II-E).
Figure 3.
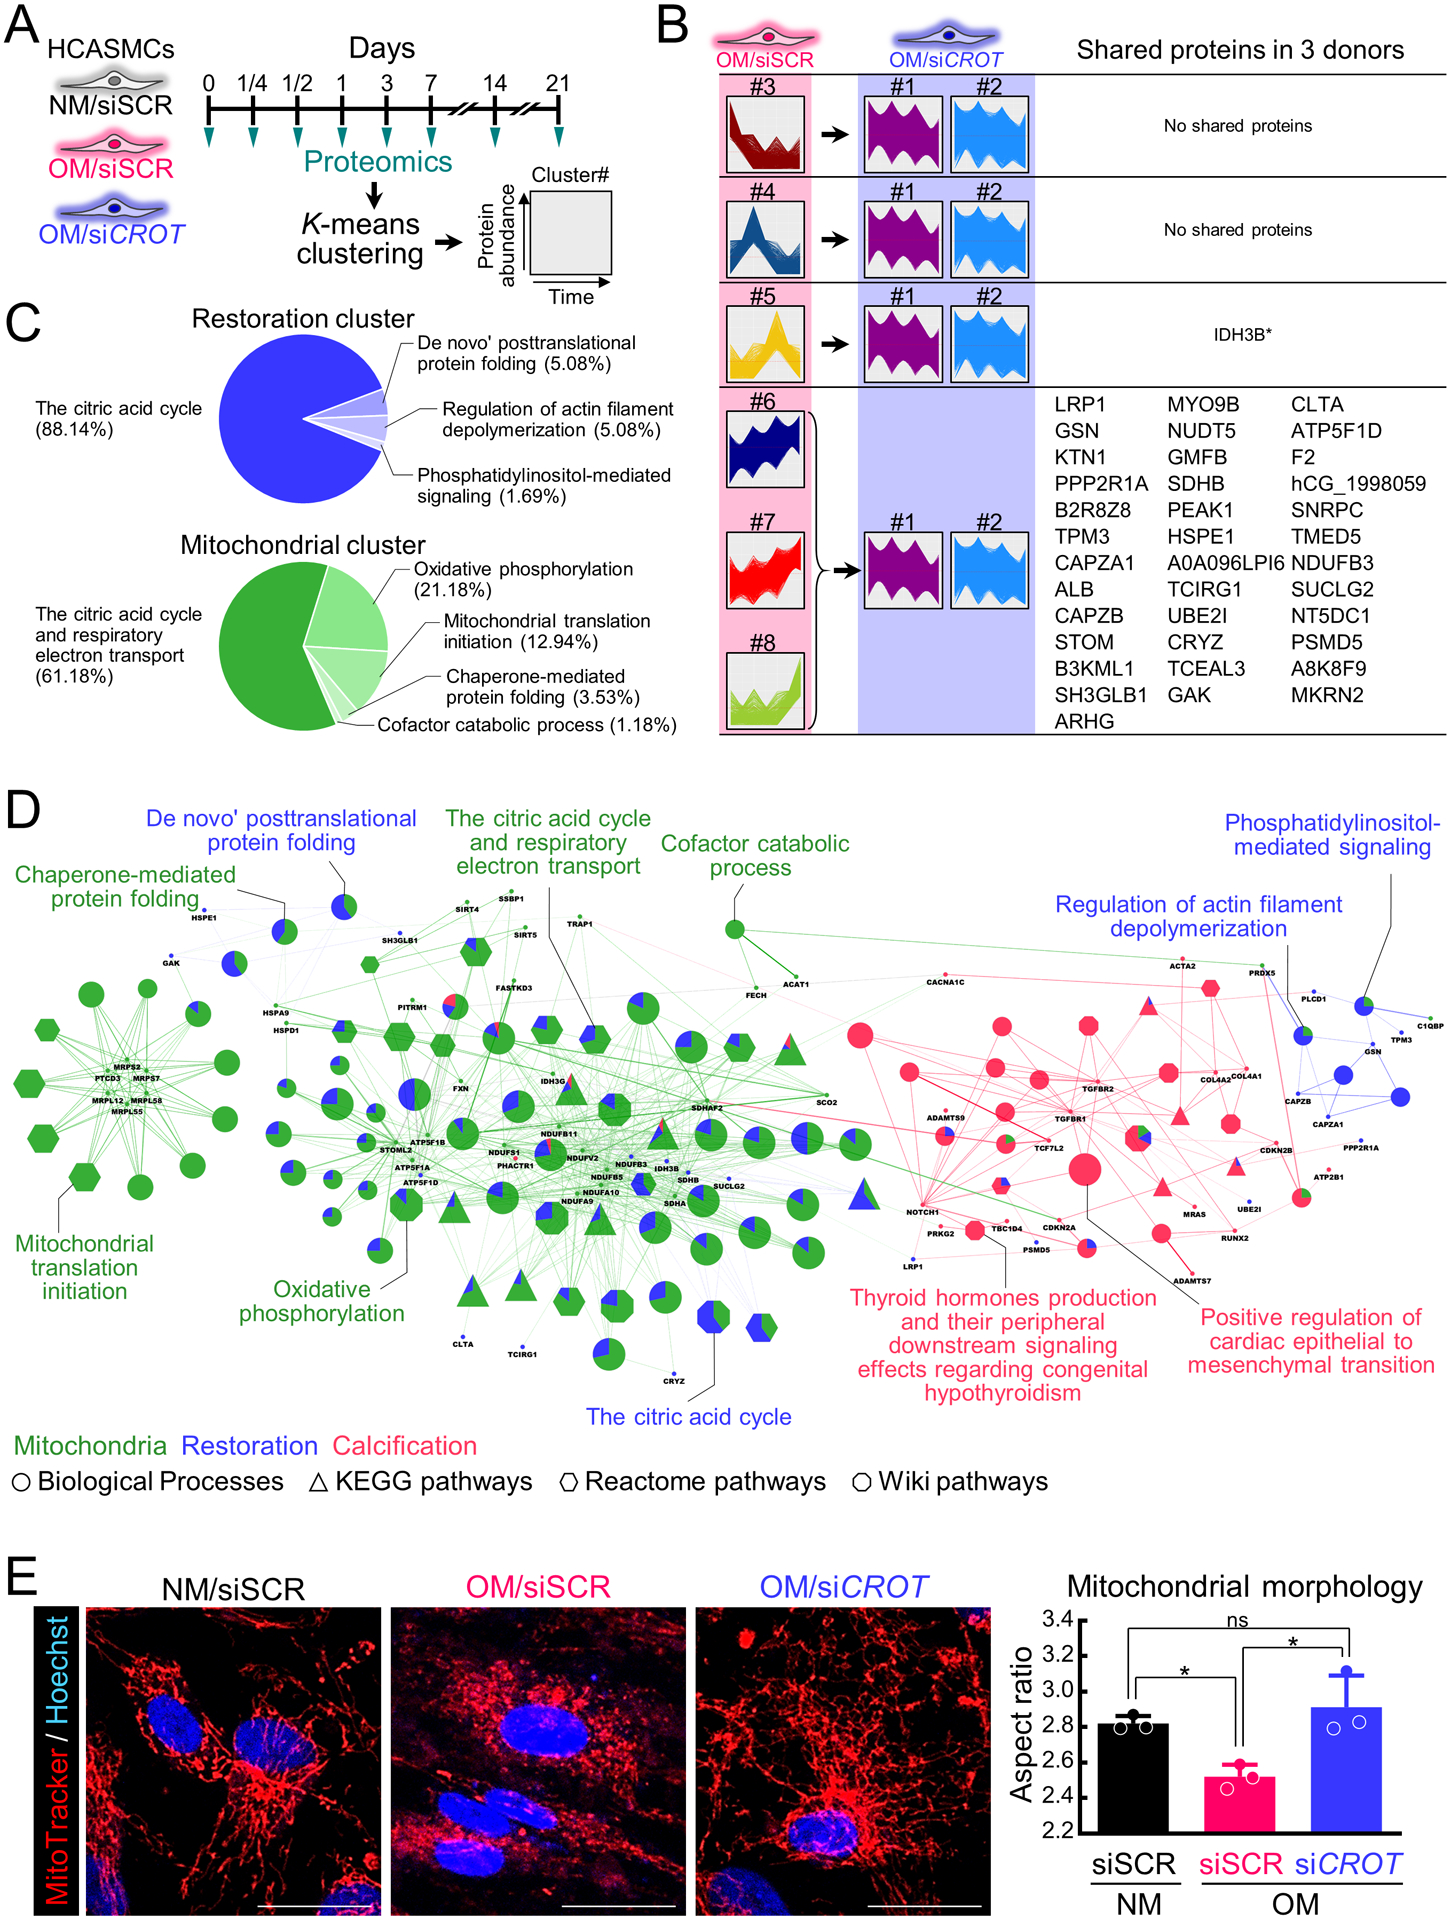
Human vascular SMCs CROT inhibition corrected an OM-disturbed mitochondrial proteome and mitochondrial fragmentation. (A) Cartoon illustrating proteomics analysis of human vascular SMCs treated with NM or OM and incubated with scrambled siRNA (siSCR) or CROT siRNA (siCROT) and assessed at day 0, 1/4, 1/2, 1, 3, 7, 14, and 21. (B) Proteins detected through all time points, conditions, and donors normalization by NM +siSCR. Proteins classified into 8 clusters (cluster #1-#8) through K-means clustering based on time-dependent expression pattern. Clusters #1-#2 and #3-#8 were defined as normal pattern clusters and peak clusters, respectively. Proteins peak clusters under OM with siSCR incubation and in a normal pattern cluster under OM with siCROT incubation are listed. Proteins that showed a same cluster transition pattern through all 3 donors also listed (IDH3B was observed in 2 donors). Listed proteins defined as siCROT restoration proteins. (C) Gene ontology (GO) and bioprocess (BP) were analyzed analysis using 35 restoration proteins (blue pie chart) and 35 mitochondrial proteins (green pie chart). Percentage of top ranked GO terms shown. (D) Functionally grouped network of enriched pathways/GO and BP terms for mitochondrial proteins (green color), siCROT restoration proteins (blue color) and calcification-related proteins (red color) shown. GO and BP terms represented as nodes (KEGG: triangle, Reactome: hexagon, Wiki: octagon). Size of each node indicates significance of enrichment, and edges reflect degree of connectivity and grouping between terms. Node color of pathways/GO and BP terms annotation shows proportion of proteins from each cluster. Proteins shared between pathways/GO and BP terms shown as nodes with corresponding name. (E) Live cell MitoTracker Red confocal images for human vascular SMCs treated as in (A) for 14 days (mitochondria, red color, nucleus, blue color). Scale bars are 10 μm. Quantified mitochondrial aspect ratio (right panel); n=3 donors, error bars are mean±SD, analyzed by ANOVA with Tukey’s multiple comparison test, *P<0.05, ns: not significant.
CROT silencing increased human SMC EPA
As CROT catalyzes transfer of fatty acyl groups between CoA and carnitine, a fatty acid metabolic process, and mitochondria are key regulators of fatty acid metabolism via β-oxidation of fatty acids that contributes to mitochondrial dysfunction, we next assessed fatty acids in human SMCs. CROT silencing increased free fatty acids in in human SMCs (Figure 4A), a finding that is consistent with a role of CROT in fatty acid metabolism. Lipidomics analysis by gas chromatography-mass spectrometry demonstrated CROT siRNA increased select fatty acids including a vascular calcification inhibitor9, EPA (Figure 4B–C, Supplemental figure III and IV, Supplemental file III). Taken together these data support a novel mechanism through which CROT inhibition reduced fatty acid metabolism, increasing EPA, and correcting mitochondrial dysfunction that in turn suppressed SMC TNAP activity and fibrocalcific response in OM.
Figure 4.
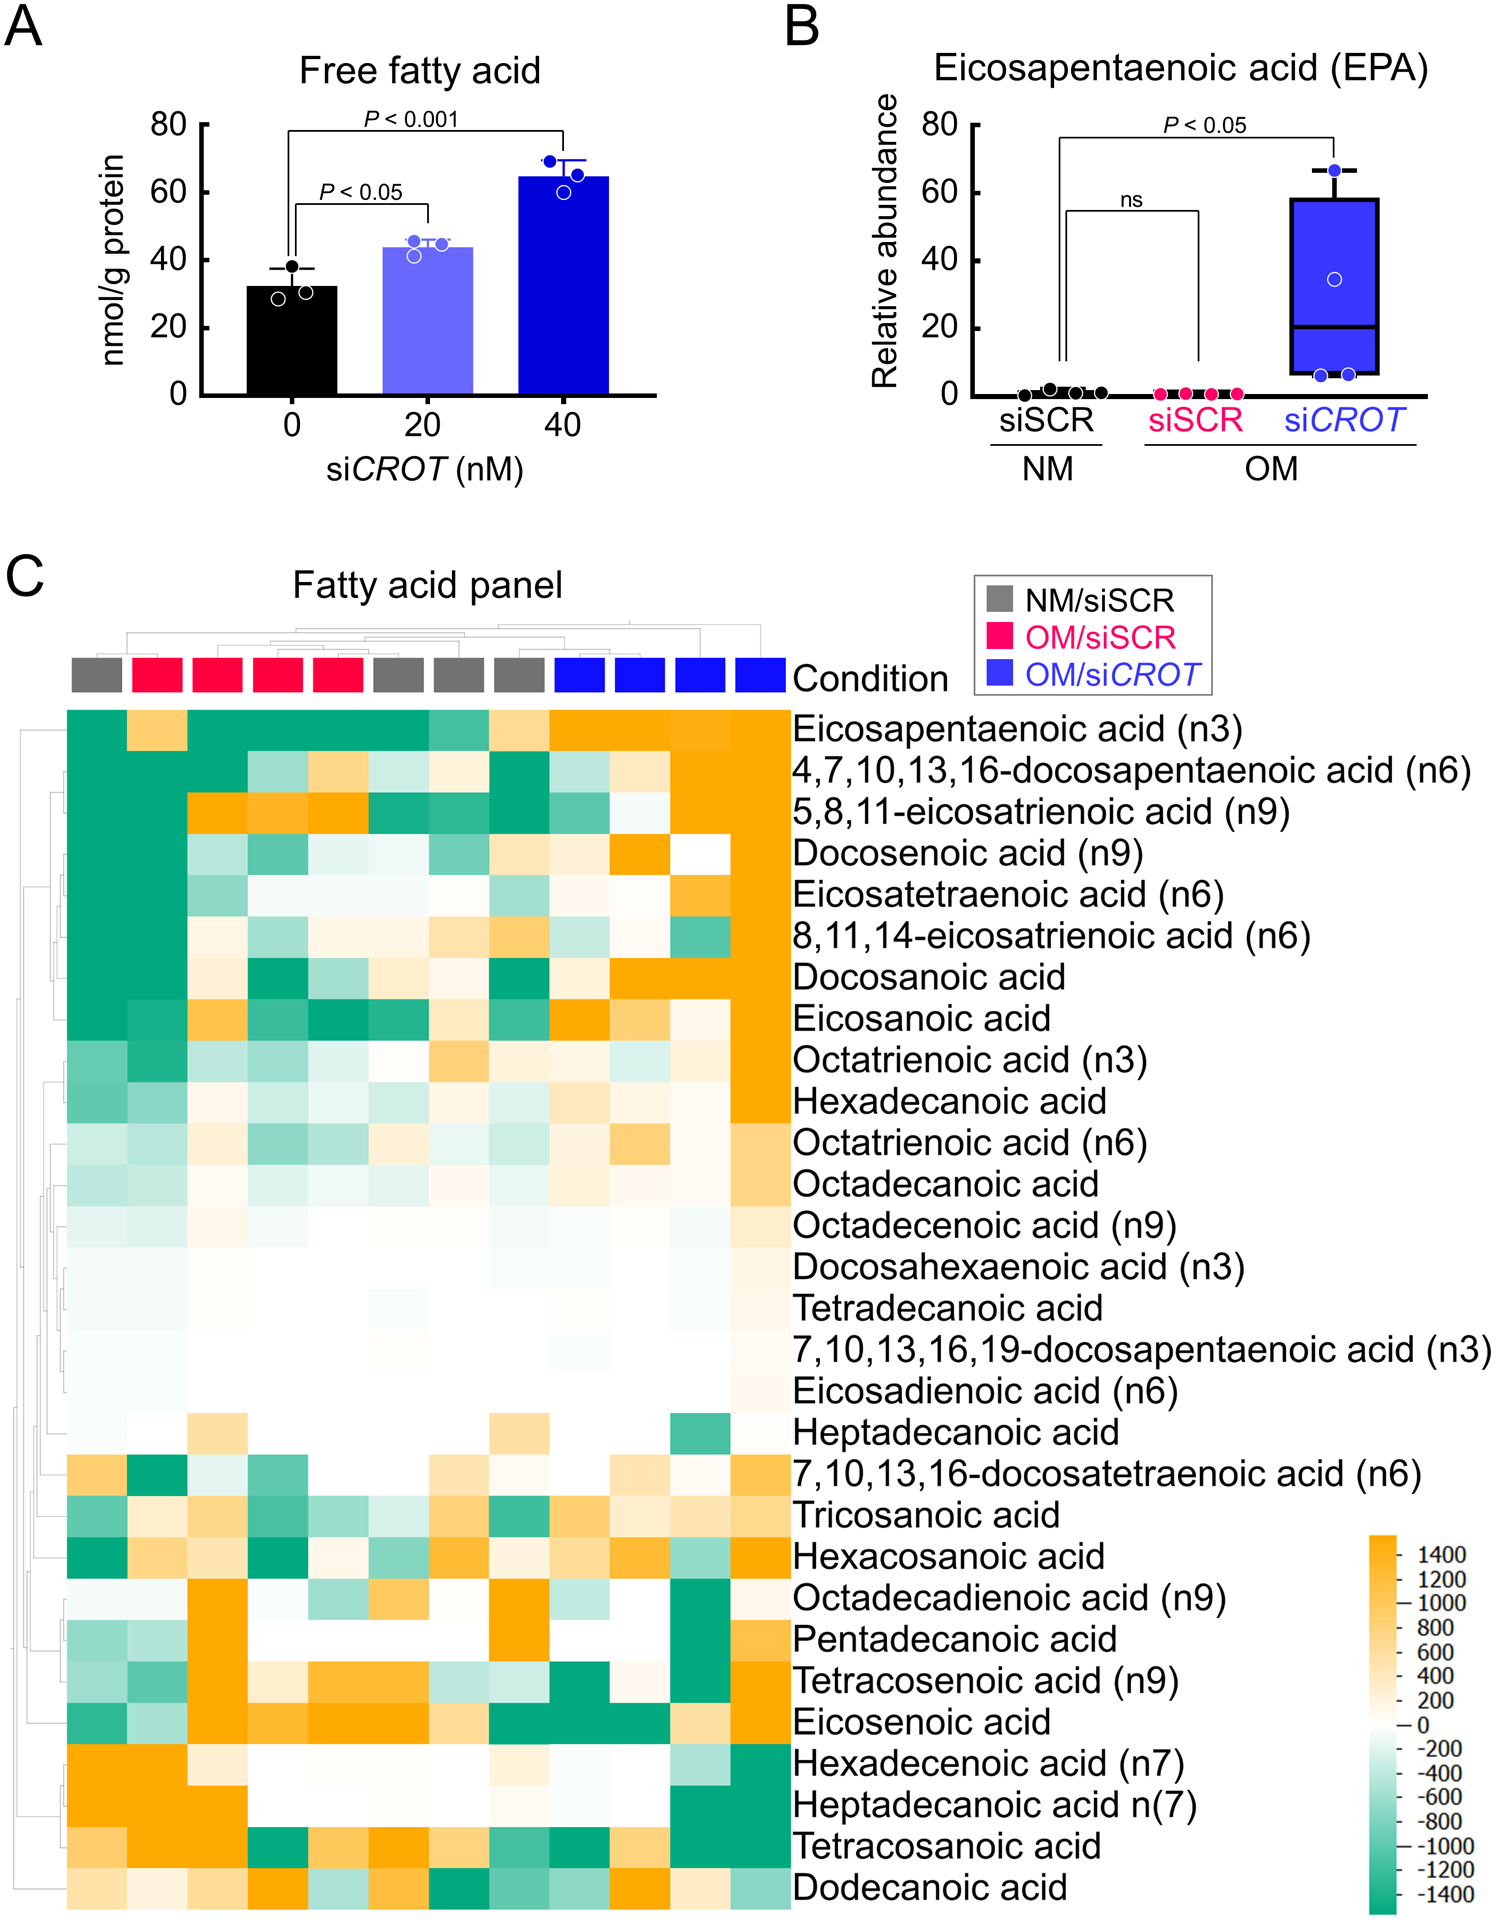
CROT inhibition increased EPA in human vascular SMCs. (A) Total free fatty acid quantification for human vascular SMCs treated with CROT siRNA; n=3 donors, error bars are mean±SD, analyzed by ANOVA with Dunnett’s test (vs 0 nM siCROT). (B) EPA concentrations in human vascular SMCs treated with NM + scrambled siRNA (siSCR) OM +siSCR, or OM+CROT siRNA (siCROT) for 3 days; n=4 donors, graphed as box-and-whiskers plots, analyzed by ANOVA with Dunn’s multiple comparison test. (C) Lipidomics heat map of fatty acid concentrations in human vascular SMCs treated as in (B). Each column represents each experimental condition (NM +siSCR, gray color, OM+siSCR, magenta color, OM +siCROT, blue color); and donor; n=4 donors/condition). Each row represents a different listed fatty acid. Color in heat map reflect concentrations of fatty acids (high, yellow color, low, green color).
Crot deficiency reduced cardiovascular calcification in atherosclerotic mice
To evaluate effects of CROT inhibition on cardiovascular calcification in vivo, we made Crot deficient (Crot−/−) mice by removing Crot exon 3 with a CRISPR-Cas9 method (Figure 5A, Supplemental figure V-A). Exon 3 includes a Crot start codon, thereby its deletion should prevent Crot translation. Indeed, Crot−/− mice did not have Crot protein, validated by Western blot analysis (Figure 3A). Gross anatomy, body weight, plasma total cholesterol and triglyceride levels were not altered by Crot deficiency (Supplemental figure V-B and -C). We next assessed effects of Crot deficiency in low-density lipoprotein receptor (Ldlr)-deficient (Ldlr−/−) mice on a high-fat, high-cholesterol diet, a condition that induces vascular calcification.3 We made Crot−/−Ldlr−/− double deficient mice by crossing Crot−/− mice with Ldlr−/− mice. No significant alterations were observed in body appearance, body weight, liver weight, plasma aspartate aminotransferase, alanine aminotransferase, glucose, or plasma and liver tissue cholesterol and triglyceride concentrations in Crot−/−Ldlr−/− mice compared to Crot+/+Ldlr−/− mice (Figure 5B–D and Supplemental figure V-D). Vascular calcification was evaluated following 15 weeks high-fat, high-cholesterol diet feeding. In vivo live imaging of OsteoSense680 demonstrated that accumulation of hydroxyapatite on the bifurcation of carotid artery was attenuated in Crot−/−Ldlr−/− mice compared to Crot+/+Ldlr−/− mice (Figure 5E). Furthermore, OsteoSense680 near-infrared fluorescence in aortas of Crot−/−Ldlr−/− mice was significantly lower than that of Crot+/+Ldlr−/− mice (Figure 5F). Using near-infrared fluorescence imaging, we also observed a decrease of OsteoSense680 signal in carotid arteries of Crot−/−Ldlr−/− mice, ex vivo (Figure 5E, Supplemental figure VI-A–B). Histological analysis of aortic arch assessed by von Kossa staining corroborated our imaging results and demonstrated that plaque area and calcification were significantly reduced in Crot−/−Ldlr−/− mice (Figure 5G, Supplemental figure VII). A significant reduction was still observed when calcification area was normalized by plaque area (Supplemental figure VII-B), indicating that the decrease of calcification in Crot−/−Ldlr−/− mice is not merely a result of plaque area reduction. In addition, macrophage accumulation was reduced in Crot−/−Ldlr−/− mice (Supplemental figure VIII), demonstrating CROT inhibition reduced inflammation-associated pathways in Crot−/−Ldlr−/− mice. To assess impact of Crot deficiency on bone density, we performed micro-CT scanning of femur bones from Crot+/+Ldlr−/− and Crot−/−Ldlr−/− mice on a high-fat, high-cholesterol diet for 15 weeks. Micro-CT analysis of femurs revealed similar bone structure and mass at cortical shaft and cancellous regions of distal femurs (Figure 6A, Supplemental table II). Crot deficiency did not alter femur cortical and trabecular bone volume (Figure 6B), bone thickness (Figure 6C), bone tissue density (Figure 6D), or specific bone surface (Figure 6E). These data demonstrate CROT is a novel inducer of vascular calcification in vivo, and that CROT inhibition suppressed vascular calcification without altering bone density in atherosclerotic mice.
Figure 5.
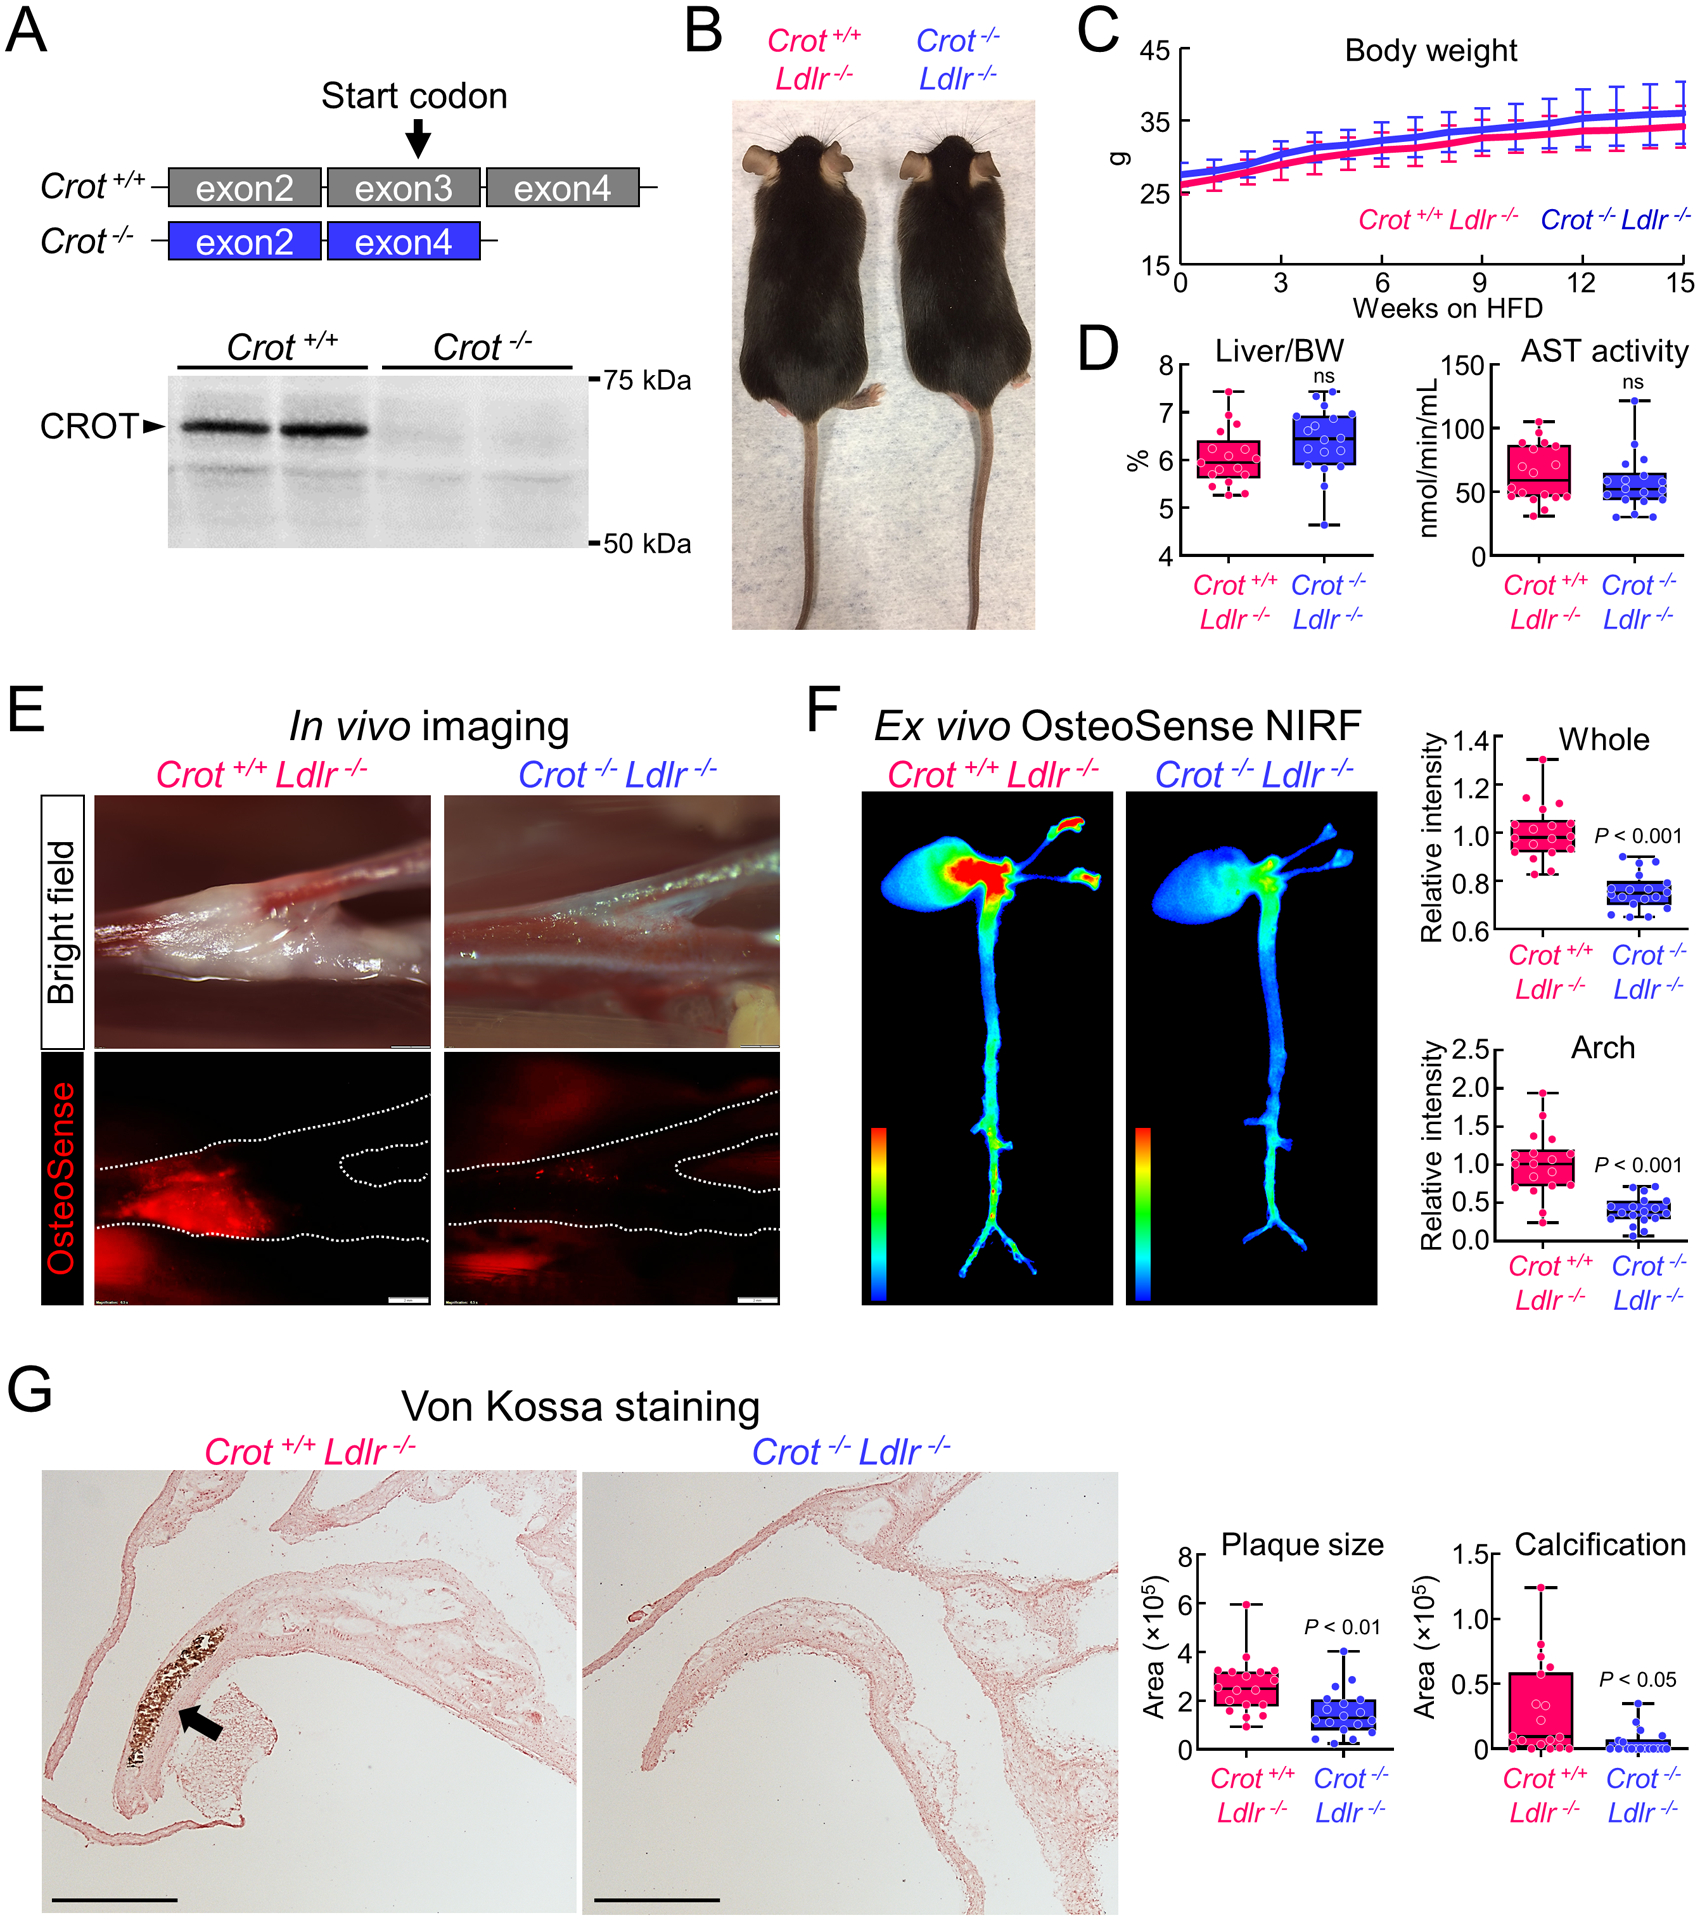
Crot deficiency reduced cardiovascular calcification in Ldlr−/− mice fed a high fat, high cholesterol (HFHC) diet. (A) Cartoon showing Crot-deficient mice strategy eliminating exon3 containing a Crot start codon. Representative anti-Crot liver Western blot shown for 4th generation backcrossed mice. (B) Representative photos of Crot+/+Ldlr−/− (left) and Crot−/−Ldlr−/− (right) mice. (C) Body weight for Crot+/+Ldlr−/− and Crot−/−Ldlr−/− mice from 0 to 15 weeks on HFHC diet; n=18 mice/group, error bars are mean±SD. (D) Liver weight normalized to body weight (BW) (left panel) and plasma AST activity level (right panel) for Crot+/+Ldlr−/− and Crot−/−Ldlr−/− mice fed HFHC diet for 15 weeks; n=18 mice/group, graphed as box-and-whiskers plots, analyzed by Student’s t-test, ns: not significant. (E) In vivo imaging of OsteoSense680 in carotid artery bifurcation area (bright field: upper, OsteoSense680: bottom panel). Crot+/+Ldlr−/− and Crot−/−Ldlr−/− mice were fed HFHC diet for 15 weeks. Carotid artery traced shown with a dotted line in bottom panel. (F) Ex vivo near-infrared fluorescence (NIRF) of OsteoSense680EX in mouse cardiovascular tissue. Heat map images represent intensity of OsteoSense680EX (high, red color, low, blue color) in cardiovascular tissue of Crot+/+Ldlr−/− and Crot−/−Ldlr−/− mice fed HFHC diet for 15 weeks. Quantified Relative intensity of OsteoSense 680EX in whole image and arch region (right upper and right bottom panel, respectively); n=18 mice/group, graphed box-and-whiskers plots, analyzed by Student’s t-test. (G) Representative von Kossa stain images in aortic arch region of Crot+/+Ldlr−/− and Crot−/−Ldlr−/− mice fed HFHC diet for 15 weeks. Calcified region stained black-brown color (arrow), scale bars represent 2 mm. Plaque area and calcification area quantification graphed as box-and-whiskers plots, n=18 mice/group, analyzed by Student’s t-test.
Figure 6.
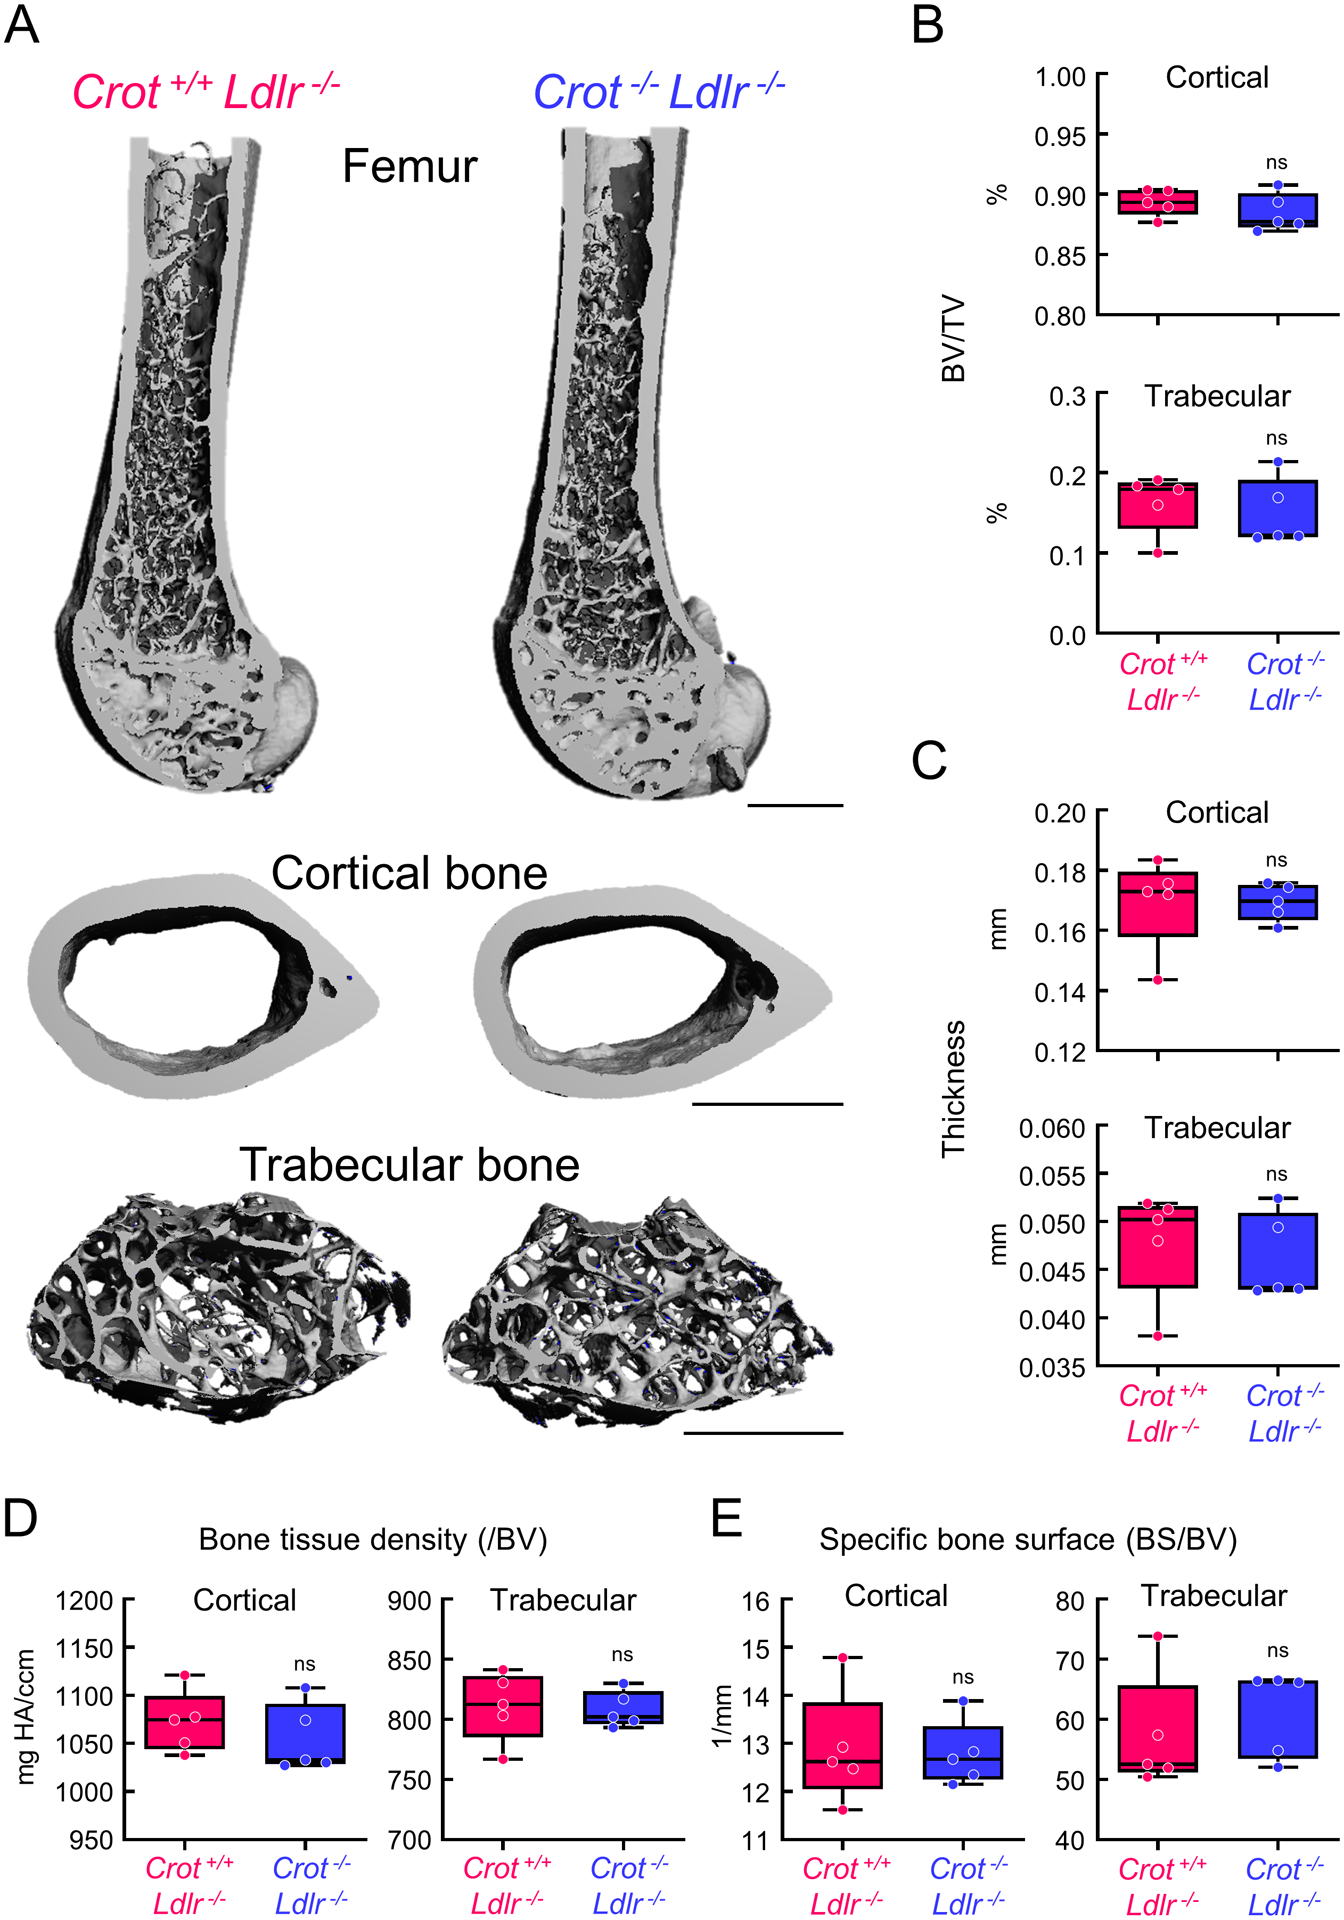
Micro-computed tomography (micro-CT) validated similar bone density in Crot+/+Ldlr−/− and Crot−/−Ldlr−/− mice. (A) Representative 3-dimensional images of mice femurs and cortical and trabecular bone regions from Crot+/+Ldlr−/− and Crot−/−Ldlr−/− mice were fed HFHC diet for 15 weeks, scale bars represent 1 mm. (B) Percentage of bone volume (BV) in total volume (TV); 5=mice/group, graphed as box-and-whiskers plots, analyzed by Student’s t-test, ns indicates not significant. (C) Quantified thickness of cortical and trabecular bone; n=5 mice/group, graphed as box-and-whiskers plots, analyzed by Student’s t-test. (D) Bone tissue density normalized by bone volume (BV); n=5 mice/group, graphed as box-and-whiskers plots, analyzed by Student’s t-test. (E) Quantified Bone surface (BS) in bone volume (BV); n=5 mice/group, graphed as box-and-whiskers plots, analyzed by Student’s t-test.
We present a working model for the mechanistic role of CROT in vascular calcification (Supplemental Figure IX). CROT metabolizes select fatty acids in peroxisomes, allowing medium chain fatty acids to traffic from peroxisomes to mitochondria where they are further metabolized by β-oxidation. Increased CROT activity likely increased fatty acid trafficking to mitochondria inducing mitochondrial dysfunction and fragmentation. Additionally, increased CROT activity may reduce EPA by increasing select fatty acid metabolism. Dysfunctional mitochondria promote TNAP activity5 which induced vascular calcification. CROT inhibition, reduced select fatty acid metabolism, that attenuated mitochondria dysfunction and increased EPA in SMCs, leading to reduced TNAP activity and vascular calcification.
Discussion
Our study has several novel findings, including: (1) identifying increased CROT in calcified human vascular cells and atherosclerotic plaques; (2) CROT inhibition attenuated calcification in human SMCs and atherosclerotic mice; (3) CROT inhibition mechanistically suppressed a fibrocalcific response via altering fatty acid metabolism and correcting mitochondria dysfunction. Thus, we identify CROT as a novel vascular calcification contributing factor and support anti-fibrocalcific therapeutic potential of CROT inhibition.
Vascular SMC phenotype changes are generally observed with progression of atherosclerosis, hypertension, and neointimal formation.27–30 Mitochondrial dysfunction-mediated cardiovascular cell phenotype changes associate with atherosclerotic vascular calcification and valvular calcification, and are opposite to mitochondrial morphology changes observed in calcifying bone osteoblasts.5,31 Our present study demonstrated several pathways associated with mitochondrial and peroxisomal metabolism were altered in calcifying SMCs. Importantly, CROT was observed in most highly-ranked pathways that had high betweenness centrality, a means of assessing interconnectivity between pathways that distinguished calcifying SMCs from control cells. Future studies using an unbiased proteomics and network pathway screening method presented here may identify additional regulators of ectopic calcification in other tissues, including heart valves. Calcification of heart valve tissue is a major risk factor for heart failure with an estimated 102,700 deaths and 1.6 million global cases of calcific aortic valve disease in 2017.32 Whether CROT is involved in calcific aortic valve disease is unknown; although, decreased ω3-polyunsaturated fatty acid was associated with valvular calcification15, further supporting need for additional studies in this area.
Mouse CROT crystal structure, including complexed with a substrate, octanoyl-carnitine is reported.24 However, there are currently no reported human CROT structural studies that may assist in development of CROT small molecule inhibitors as potential anti-fibrocalcific drugs. High interspecies homology of CROT amino acid sequence exists that allowed us to determine histidine 327 as a key amino acid regulating human CROT enzyme activity.33 While beyond the scope of our present study, our amino acid catalytic site data provides a crucial initial step in identifying novel specific inhibitors of human CROT. Importantly, we did not observe any negative pathology such as fatty liver or other noticeable metabolic defects in Crot-deficient mice. As CROT is a member of a carnitine acyltransferase family of proteins, identifying specific CROT inhibitors will be an important step to avoiding unwanted effects of nonspecific inhibition within this protein family that may result in undesired metabolic complications. MicroRNA miR-33, located within sterol regulator element binding protein, reduces CROT.34 Interpretation of miR-33 studies in relation to CROT and cardiovascular disease is extremely difficult given numerous targets of miR-33 exist, including key genes involved in lipid metabolism and insulin signaling pathways. Little is known about genetic CROT variants in human disease. Of potential related interest, CROT-rs2214930 gene variant showed no significant differences in serum total cholesterol, triglycerides, body mass, and blood pressure in a small study of control and coronary artery disease patients.35 Sex differences in lipid and lipoprotein metabolisms can occur due hormonal effects and genes on the X-chromosome, and these may contribute to sex differences in cardiovascular disease risk in humans.20 In our initial study characterizing CROT inhibition in an atherosclerosis mouse model, we only used male mice to eliminate issues with sex differences impacting data interpretation. Although based on our in vitro calcification models using cells from males and females, whether CROT inhibition also suppresses vascular calcification in female animal models could be examined in future studies.
We found that total fatty acid levels increased in human SMCs incubated with CROT siRNA, a finding that is consistent with a known role of CROT in fatty acid metabolism.19 With lipidomics analysis, we identified this fatty acid increase was selective, notably with an increased ω3-polyunsaturated fatty acid, EPA following CROT siRNA incubation. EPA administration inhibits calcification in vitro9 and in warfarin-induced rat vascular calcification11 and spontaneous vascular calcification in klotho mutant mice.12 EPA may prevent β-catenin-induced SMC osteogenic differentiation through peroxisome proliferator-activated receptors.36 Our present study provides additional novel mechanistic findings supporting selectively altered fatty acid composition induced by CROT-deficiency that may function along with corrected mitochondrial dysfunction. Mitochondria are critical regulators of fatty acid β-oxidation, a process that may contribute to SMC phenotypic switching; although, this remains to be demonstrated. RvE1 a metabolite of EPA meditates benefits of EPA in human vasculature37; RvE1 reduced human SMC calcification in OM. We previously demonstrated that correcting mitochondrial dysfunction suppresses TNAP activity and cardiovascular cell calcification.5 CROT inhibition reduced TNAP activity and SMC calcification. While not excluding a role of fatty acid metabolites in this action, our data supports a critical mechanism through which CROT inhibition works to suppress SMC calcification is through mitochondrial-associated pathways. This is likely a key mechanistic step given that mitochondria are critical regulators of fatty acid β-oxidation, a process that may contribute to SMC phenotypic switching; although, this remains to be demonstrated. EPA also induces an anti-inflammatory response,38 as does suppressed mitochondrial fission,39 and macrophages contribute to vascular calcification.40 We found that CROT inhibition suppressed macrophage accumulation in atherosclerotic plaque, supporting a novel role of CROT in macrophage inflammation pathways.
In conclusion, our study identified CROT as a novel contributing factor in vascular calcification that could be inhibited in vivo to reduce vascular calcification without impacting bone mineralization, body mass, or plasma and liver tissue cholesterol and triglyceride concentrations. Thus, we established CROT inhibition as an attractive candidate in a search for anti-fibrocalcific response therapies, a major unmet medical need.
Supplementary Material
Highlights.
Unbiased proteomics and pathway network analysis identified CROT as a novel contributing factor in calcification that is increased in calcifying human vascular cells and tissues.
CROT siRNA and CROT histidine 327 to alanine point mutation-induced enzymatic inhibition reduced fibrocalcific response in vitro and CROT deficiency suppressed vascular calcification in atherosclerotic mice.
Mechanistically CROT inhibition likely functioned via altering fatty acid metabolism, increasing eicosapentaenoic acid concentrations, and correcting mitochondrial dysfunction in calcifying human smooth muscle cells.
Acknowledgements
We thank Galina Sukhova and Peter Libby for providing carotid endarterectomy specimens. Jennifer Wen, Anna Ha, and Andrew Mlynarchik for expert help with animal experiments.
Sources of Funding
This study was supported by a research grant from Kowa Company, Ltd. (Tokyo, Japan, to M.A.) and the National Institutes of Health grants (R01HL136431, R01HL147095, R01HL141917 to E.A.).
Abbreviations
- CROT
Carnitine O-octanoyltransferase
- EPA
eicosapentaenoic acid
- LDLR
Low-density lipoprotein receptor
- αSMA
Alpha smooth muscle cell actin
- SMC
Smooth muscle cell
Footnotes
Disclosures
T.O. and M.I. are employees of Kowa Company, Ltd and were visiting scientist at Brigham and Women’s Hospital when experiments included in this study were performed. Kowa Company, Ltd had no role in study design, data collection and analysis, decision to publish or preparation of the manuscript. All other authors declare no competing interests. E. A., M.I., M.A., T.O., are listed inventors on a patent application (#16/630,884) based on the results in the study that is issued to Brigham and Women’s Hospital.
References
- 1.Budoff MJ, Achenbach S, Blumenthal RS, Carr JJ, Goldin JG, Greenland P, Guerci AD, Lima JAC, Rader DJ, Rubin GD, Shaw LJ, Wiegers SE. Assessment of Coronary Artery Disease by Cardiac Computed Tomography. Circulation. 2006;114:1761–1791. doi: 10.1161/CIRCULATIONAHA.106.178458. [DOI] [PubMed] [Google Scholar]
- 2.Greenland P, LaBree L, Azen SP, Doherty TM, Detrano RC. Coronary Artery Calcium Score Combined With Framingham Score for Risk Prediction in Asymptomatic Individuals. JAMA. 2004;291:210–215. doi: 10.1001/jama.291.2.210. [DOI] [PubMed] [Google Scholar]
- 3.Goettsch C, Hutcheson JD, Aikawa M, Iwata H, Pham T, Nykjaer A, Kjolby M, Rogers MA, Michel T, Shibasaki M, Hagita S, Kramann R, Rader DJ, Libby P, Singh SA, Aikawa E. Sortilin Mediates Vascular Calcification via Its Recruitment Into Extracellular Vesicles. J Clin Invest. 2016;126:1323–1336. doi: 10.1172/JCI80851. [DOI] [PMC free article] [PubMed] [Google Scholar]
- 4.Rogers MA, Chen J, Nallamshetty S, Pham T, Goto S, Muehlschlegel JD, Libby P, Aikawa M, Aikawa E, Plutzky J. Retinoids Repress Human Cardiovascular Cell Calcification With Evidence for Distinct Selective Retinoid Modulator Effects. Arterioscler Thromb Vasc Biol. 2020;40:656–669. doi: 10.1161/ATVBAHA.119.313366. [DOI] [PMC free article] [PubMed] [Google Scholar]
- 5.Rogers MA, Maldonado N, Hutcheson JD, Goettsch C, Goto S, Yamada I, Faits T, Sesaki H, Aikawa M, Aikawa E. Dynamin-Related Protein 1 Inhibition Attenuates Cardiovascular Calcification in the Presence of Oxidative Stress. Circ Res. 2017;121:220–233. doi: 10.1161/CIRCRESAHA.116.310293. [DOI] [PMC free article] [PubMed] [Google Scholar]
- 6.Hutcheson JD, Goettsch C, Bertazzo S, Maldonado N, Ruiz JL, Goh W, Yabusaki K, Faits T, Bouten C, Franck G, Quillard T, Libby P, Aikawa M, Weinbaum S, Aikawa E. Genesis and Growth of Extracellular-Vesicle-Derived Microcalcification in Atherosclerotic Plaques. Nat Mater. 2016;15:335–343. doi: 10.1038/nmat4519. [DOI] [PMC free article] [PubMed] [Google Scholar]
- 7.Rogers MA, Buffolo F, Schlotter F, Atkins SK, Lee LH, Halu A, Blaser MC, Tsolaki E, Higashi H, Luther K, Daaboul G, Bouten CVC, Body SC, Singh SA, Bertazzo S, Libby P, Aikawa M, Aikawa E. Annexin A1-dependent tethering promotes extracellular vesicle aggregation revealed with single-extracellular vesicle analysis. Sci Adv. 2020;6:eabb1244. doi: 10.1126/sciadv.abb1244. [DOI] [PMC free article] [PubMed] [Google Scholar]
- 8.Kelly-Arnold A, Maldonado N, Laudier D, Aikawa E, Cardoso L, Weinbaum S. Revised Microcalcification Hypothesis for Fibrous Cap Rupture in Human Coronary Arteries. Proc Natl Acad Sci USA. 2013;110:10741–10746. doi: 10.1073/pnas.1308814110. [DOI] [PMC free article] [PubMed] [Google Scholar]
- 9.Abedin M, Lim J, Tang TB, Park D, Demer LL, Tintut Y. N-3 Fatty Acids Inhibit Vascular Calcification via the p38-mitogen-activated Protein Kinase and Peroxisome Proliferator-Activated Receptor-Gamma Pathways. Circ Res. 2006;98:727–729. doi: 10.1161/01.RES.0000216009.68958.e6. [DOI] [PubMed] [Google Scholar]
- 10.Schlemmer CK, Coetzer H, Claassen N, Kruger MC, Rademeyer C, van Jaarsveld L, Smuts CM. Ectopic Calcification of Rat Aortas and Kidneys Is Reduced With n-3 Fatty Acid Supplementation. Prostaglandins Leukot Essent Fatty Acids. 1998;59:221–227. doi: 10.1016/s0952-3278(98)90066-7. [DOI] [PubMed] [Google Scholar]
- 11.Kanai S, Uto K, Honda K, Hagiwara N, Oda H. Eicosapentaenoic Acid Reduces Warfarin-Induced Arterial Calcification in Rats. Atherosclerosis. 2011;215:43–51. doi: 10.1016/j.atherosclerosis.2010.12.001. [DOI] [PubMed] [Google Scholar]
- 12.Nakamura K, Miura D, Saito Y, Yunoki K, Koyama Y, Satoh M, Kondo M, Osawa K, Hatipoglu OF, Miyoshi T, Yoshida M, Morita H, Ito H. Eicosapentaenoic Acid Prevents Arterial Calcification in Klotho Mutant Mice. PLoS One. 2017;12:e0181009. doi: 10.1371/journal.pone.0181009. [DOI] [PMC free article] [PubMed] [Google Scholar]
- 13.Bittner DO, Goeller M, Zopf Y, Achenbach S, Marwan M. Early-onset Coronary Atherosclerosis in Patients With Low Levels of omega-3 Fatty Acids. Eur J Clin Nutr. 2020;74:651–656. doi: 10.1038/s41430-019-0551-5. [DOI] [PubMed] [Google Scholar]
- 14.Sekikawa A, Miura K, Lee S, Fujiyoshi A, Edmundowicz D, Kadowaki T, Evans RW, Kadowaki S, Sutton-Tyrrell K, Okamura T, et al. ERA JUMP Study Group. Long Chain n-3 Polyunsaturated Fatty Acids and Incidence Rate of Coronary Artery Calcification in Japanese Men in Japan and White Men in the USA: Population Based Prospective Cohort Study. Heart. 2014;100:569–573. doi: 10.1136/heartjnl-2013-304421. [DOI] [PMC free article] [PubMed] [Google Scholar]
- 15.Plunde O, Larsson SC, Artiach G, Thanassoulis G, Carracedo M, Franco-Cereceda A, Eriksson P, Bäck M. FADS1 (Fatty Acid Desaturase 1) Genotype Associates With Aortic Valve FADS mRNA Expression, Fatty Acid Content and Calcification. Circ Genom Precis Med. 2020;13:e002710. doi: 10.1161/CIRCGEN.119.002710. [DOI] [PMC free article] [PubMed] [Google Scholar]
- 16.Basatemur GL, Jørgensen HF, Clarke MCH, Bennett MR, Mallat Z. Vascular Smooth Muscle Cells in Atherosclerosis. Nat Rev Cardiol. 2019;16:727–744. doi: 10.1038/s41569-019-0227-9. [DOI] [PubMed] [Google Scholar]
- 17.van der Leij FR, Huijkman NC, Boomsma C, Kuipers JR, Bartelds B. Genomics of the Human Carnitine Acyltransferase Genes. Mol Genet Metab. 2000;71:139–153. doi: 10.1006/mgme.2000.3055. [DOI] [PubMed] [Google Scholar]
- 18.Farrell SO, Fiol CJ, Reddy JK, Bieber LL. Properties of Purified Carnitine Acyltransferases of Mouse Liver Peroxisomes. J Biol Chem. 1984;259:13089–13095. [PubMed] [Google Scholar]
- 19.Borgne FL, Mohamed AB, Logerot M, Garnier E, Demarquoy J. Changes in Carnitine Octanoyltransferase Activity Induce Alteration in Fatty Acid Metabolism. Biochem Biophys Res Commun. 2011;409:699–704. doi: 10.1016/j.bbrc.2011.05.068. [DOI] [PubMed] [Google Scholar]
- 20.Palmisano BT, Zhu L, Eckel RH, Stafford JM. Sex differences in lipid and lipoprotein metabolism. Mol Metab. 2018;15:45–55. doi: 10.1016/j.molmet.2018.05.008. [DOI] [PMC free article] [PubMed] [Google Scholar]
- 21.Perez-Riverol Y, Csordas A, Bai J, Bernal-Llinares M, Hewapathirana S, Kundu DJ, Inuganti A, Griss J, Mayer G, Eisenacher M, Pérez E, Uszkoreit J, Pfeuffer J, Sachsenberg T, Yilmaz S, Tiwary S, Cox J, Audain E, Walzer M, Jarnuczak AF, Ternent T, Brazma A, Vizcaíno JA. The PRIDE database and related tools and resources in 2019: improving support for quantification data. Nucleic Acids Res. 2019. January 8;47:D442–D450. doi: 10.1093/nar/gky1106. [DOI] [PMC free article] [PubMed] [Google Scholar]
- 22.Yang H, Curinga G, Giachelli CM, Elevated extracellular calcium levels induce smooth muscle cell matrix mineralization in vitro. Kidney Int. 2004;66:2293–9. doi: 10.1111/j.1523-1755.2004.66015.x. [DOI] [PubMed] [Google Scholar]
- 23.Aikawa E, Nahrendorf M, Sosnovik D, Lok VM, Jaffer FA, Aikawa M, Weissleder R. Multimodality Molecular Imaging Identifies Proteolytic and Osteogenic Activities in Early Aortic Valve Disease. Circulation. 2007;115:377–86. doi: 10.1161/CIRCULATIONAHA.106.654913. [DOI] [PubMed] [Google Scholar]
- 24.Jogl G, Hsiao Y-S, Tong L. Crystal Structure of Mouse Carnitine Octanoyltransferase and Molecular Determinants of Substrate Selectivity. J Biol Chem. 2005;280:738–744. doi: 10.1074/jbc.M409894200. [DOI] [PubMed] [Google Scholar]
- 25.Lee LH, Halu A, Morgan S, Iwata H, Aikawa M, Singh SA. XINA: A Workflow for the Integration of Multiplexed Proteomics Kinetics Data With Network Analysis. J Proteome Res. 2019;18:775–781. doi: 10.1021/acs.jproteome.8b00615. [DOI] [PubMed] [Google Scholar]
- 26.Goto S, Rogers MA, Blaser MC, Higashi H, Lee LH, Schlotter F, Body SC, Aikawa M, Singh SA, Aikawa E. Standardization of Human Calcific Aortic Valve Disease in vitro Modeling Reveals Passage-Dependent Calcification. Front Cardiovasc Med. 2019;6:49. doi: 10.3389/fcvm.2019.00049. [DOI] [PMC free article] [PubMed] [Google Scholar]
- 27.Rogers MA, Aikawa E. Cardiovascular Calcification: Artificial Intelligence and Big Data Accelerate Mechanistic Discovery. Nat Rev Cardiol. 2019;16:261–274. doi: 10.1038/s41569-018-0123-8. [DOI] [PubMed] [Google Scholar]
- 28.Campbell GR, Campbell JH. Smooth Muscle Phenotypic Changes in Arterial Wall Homeostasis: Implications for the Pathogenesis of Atherosclerosis. Exp Mol Pathol. 1985;42:139–162. doi: 10.1016/0014-4800(85)90023-1. [DOI] [PubMed] [Google Scholar]
- 29.Rzucidlo EM, Martin KA, Powell RJ. Regulation of Vascular Smooth Muscle Cell Differentiation. J Vasc Surg. 2007;45 Suppl A:A25–32. doi: 10.1016/j.jvs.2007.03.001. [DOI] [PubMed] [Google Scholar]
- 30.Cecchettini A, Rocchiccioli S, Boccardi C, Citti L. Vascular Smooth-Muscle-Cell Activation: Proteomics Point of View. Int Rev Cell Mol Biol. 2011;288:43–99. doi: 10.1016/B978-0-12-386041-5.00002-9. [DOI] [PubMed] [Google Scholar]
- 31.Yu EPK, Bennett MR. Mitochondrial DNA Damage and Atherosclerosis. Trends Endocrinol Metab. 2014;25:481–487. doi: 10.1016/j.tem.2014.06.008. [DOI] [PubMed] [Google Scholar]
- 32.Yadgir S, Johnson CO, Aboyans V, Adebayo OM, Adedoyin RA, Afarideh M, Alahdab F, Alashi A, Alipour V, Arabloo J. Global Burden of Disease Study 2017 Nonrheumatic Valve Disease Collaborators. Global, Regional, and National Burden of Calcific Aortic Valve and Degenerative Mitral Valve Diseases, 1990–2017. Circulation. 2020;141:1670–1680. doi: 10.1161/CIRCULATIONAHA.119.043391. [DOI] [PubMed] [Google Scholar]
- 33.Ferdinandusse S, Mulders J, IJlst L, Denis S, Dacremont G, Waterham HR, Wanders RJ. Molecular Cloning and Expression of Human Carnitine Octanoyltransferase: Evidence for Its Role in the Peroxisomal Beta-Oxidation of Branched-Chain Fatty Acids. Biochem Biophys Res Commun. 1999;263:213–218. doi: 10.1006/bbrc.1999.1340. [DOI] [PubMed] [Google Scholar]
- 34.Dávalos A, Goedeke L, Smibert P, Ramírez CM, Warrier NP, Andreo U, Cirera-Salinas D, Rayner K, Suresh U, Pastor-Pareja JC, Esplugues E, Fisher EA, Penalva LOF, Moore KJ, Suárez Y, Lai EC, Fernández-Hernando C. miR-33a/b Contribute to the Regulation of Fatty Acid Metabolism and Insulin Signaling. Proc Natl Acad Sci USA. 2011;108:9232–9237. doi: 10.1073/pnas.1102281108. [DOI] [PMC free article] [PubMed] [Google Scholar]
- 35.Demircan A, Coskunpinar E, Kanca D, Ozkara G, Yanar F, Kurnaz-Gomleksiz O, Bugra Z, Ozturk O, Aydogan HY. Role of SNPs of CPTIA and CROT genes in the carnitine-shuttle in coronary artery disease: a case-control study. Turkish Journal of Biochemistry. 2019;44. doi: 10.1515/tjb-2018-0546 [DOI] [Google Scholar]
- 36.Saito Y, Nakamura K, Miura D, Yunoki K, Miyoshi T, Yoshida M, Kawakita N, Kimura T, Kondo M, Sarashina T, Akagi S, Watanabe A, Nishii N, Morita H, Ito H. Suppression of Wnt Signaling and Osteogenic Changes in Vascular Smooth Muscle Cells by Eicosapentaenoic Acid. Nutrients. 2017;9:858. doi: 10.3390/nu9080858. [DOI] [PMC free article] [PubMed] [Google Scholar]
- 37.Serhan CN. Pro-resolving Lipid Mediators Are Leads for Resolution Physiology. Nature. 2014;510:92–101. doi: 10.1038/nature13479. [DOI] [PMC free article] [PubMed] [Google Scholar]
- 38.Carracedo M, Artiach G, Arnardottir H, Bäck M. The resolution of inflammation through omega-3 fatty acids in atherosclerosis, intimal hyperplasia, and vascular calcification. Semin Immunopathol. 2019;41:757–766. doi: 10.1007/s00281-019-00767-y. [DOI] [PMC free article] [PubMed] [Google Scholar]
- 39.Umezu R, Koga J, Matoba T, Katsuki S, Wang L, Hasuzawa N, Nomura M, Tsutsui H, Egashira K. Macrophage (Drp1) Dynamin-Related Protein 1 Accelerates Intimal Thickening After Vascular Injury. Arterioscler Thromb Vasc Biol. 2020;40:e214–e226. doi: 10.1161/ATVBAHA.120.314383. [DOI] [PubMed] [Google Scholar]
- 40.New SEP, Goettsch C, Aikawa M, Marchini JF, Shibasaki M, Yabusaki K, Libby P, Shanahan CM, Croce K, Aikawa E. Macrophage-derived Matrix Vesicles: An Alternative Novel Mechanism for Microcalcification in Atherosclerotic Plaques. Circ Res. 2013;113:72–77. doi: 10.1161/CIRCRESAHA.113.301036. [DOI] [PMC free article] [PubMed] [Google Scholar]
Associated Data
This section collects any data citations, data availability statements, or supplementary materials included in this article.