Abstract
Background
Tumor mutation burden (TMB) and immune microenvironment are important determinants of prognosis and immunotherapeutic efficacy for cancer patients. The aim of the present study was to develop an immune signature to effectively predict prognosis and immunotherapeutic response in patients with lung squamous cell carcinoma (LUSC).
Methods
TMB and immune microenvironment characteristics were comprehensively analyzed by multi-omics data in LUSC. The immune signature was further constructed and validated in multiple independent datasets by LASSO Cox regression analysis. Next, the value of immune signature in predicting the response of immunotherapy was evaluated. Finally, the possible mechanism of immune signature was also investigated.
Results
A novel immune signature based on 5 genes was constructed and validated to predict the prognosis of LUSC patients. These genes were filamin-C, Rho family GTPase 1, interleukin 4-induced gene-1, transglutaminase 2, and prostaglandin I2 synthase. High-risk patients had significantly poorer survival than low-risk patients. A nomogram was also developed based on the immune signature and tumor stage, which showed good application. Furthermore, we found that the immune signature had a significant correlation with immune checkpoint, microsatellite instability, tumor infiltrating lymphocytes, cytotoxic activity scores, and T-cell-inflamed score, suggesting low-risk patients are more likely to benefit from immunotherapy. Finally, functional enrichment and pathway analyses revealed several significantly enriched immune-related biological processes and metabolic pathways.
Conclusions
In the present study, we developed a novel immune signature that could predict prognosis and immunotherapeutic response in LUSC patients. The results not only help identify LUSC patients with poor survival, but also increase our understanding of the immune microenvironment and immunotherapy in LUSC.
Keywords: Lung squamous cell carcinoma (LUSC), tumor mutation burden (TMB), tumor microenvironment (TME), immune signature, prognosis
Introduction
Lung cancer is the 4th leading cause of cancer-associated death in the world, and 80% of lung cancer patients diagnosed with non-small cell lung cancer (NSCLC) (1). Lung squamous cell carcinoma (LUSC) is an important histological subtype of NSCLC, causing approximately 400,000 deaths per year worldwide (1,2). Currently, surgical resection and chemotherapy are the major treatment for NSCLC (2). The prognosis and overall survival (OS) rate for LUSC remain poor, which is mainly because many patients with LUSC have metastatic disease at diagnosis. In recent years, molecular targeted therapy and immunotherapy have significantly prolonged the survival time of patients with LUSC (3,4). Although immunotherapies have made great progress in treating LUSC, there are still many problems. Due to the highly tumor heterogeneity of LUSC patients, the clinical effects of immunotherapy vary widely among LUSC patients (5,6). Therefore, it is important to elucidate a more detailed molecular mechanism of immunotherapeutic response and to find more immunotherapeutic targets.
The principle of cancer immunotherapy is to harness the patient’s own immune system to treat cancer (7). The mechanism of cancer immune escape is complex, and involves tumor gene mutation, tumor-associated antigens, various immune cells, and the inflammatory microenvironment (8). Tumor gene mutation can produce tumor neoantigens that result in the immune system being unable to recognize and kill tumor cells (9). Several studies have reported tumor mutation burden (TMB) as a potential biomarker for immunotherapy in patients with NSCLC (10-13). In addition, the changes of the tumor microenvironment (TME) can also lead to immune system failure (14,15). Immune checkpoints are pivotal regulators of the immune escape, and immune checkpoint-based immunotherapy has become a promising treatment for patients with advanced NSCLC (3,6,16). Currently, the anti-cytotoxic T-lymphocyte-associated antigen 4 (anti-CTLA-4) agent, tremelimumab, and the anti-programmed cell death protein 1 (anti-PD-1) agent, nivolumab, have been used to treat LUSC in clinical practice (17-19). Therefore, how to accurately predict the prognosis of patients and the effect of immunotherapy warrant further research.
In the present study, we comprehensively analyzed tumor TMB and the immune microenvironment in LUSC. Furthermore, an immune signature was constructed and validated in multiple independent cohorts, and a reliable predictive nomogram model was developed to evaluate OS for LUSC patients. Importantly, we found that the immune signature could identify LUSC patients most likely to benefit from immunotherapy. Overall, our results suggest that the immune signature could serve as a potential biomarker to predict prognosis and immunotherapeutic effect in LUSC patients, and also has the potential to guide the personalized therapy of patients. We present the following article in accordance with the REMARK reporting checklist (available at http://dx.doi.org/10.21037/atm-21-463).
Methods
Multi-omics data preparation
The data of 535 LUSC samples and 90 normal samples of RNA-seq expression data, 562 LUSC samples of somatic mutation data, and corresponding clinical information were collected from The Cancer Genome Atlas (TCGA) database and used as the training dataset. Microarray datasets GSE19188, GSE29013, GSE30219, GSE73403, and GSE37745, including RNA expression data and clinical information, were also downloaded from the Gene Expression Omnibus (GEO) database and used to validate the datasets. The present study did not require ethical approval, because all data were downloaded from publicly databases. RNA expression data were preprocessed as follows: (I) LUSC patients with OS <30 days were not included in the present study; and (II) gene expression levels were quantified using the transcripts per million (TPM) method, and log2 (TPM+1) was used for further analysis. The study was conducted in accordance with the Declaration of Helsinki (as revised in 2013).
Somatic mutation analysis
The R package “maftools” was performed to analyze, summarize, and visualize the somatic mutation data of LUSC patients (20). We first described the mutation profiles of LUSC patients by using waterfall plot. The variant classification, variant type, and SNV (single nucleotide variants) class are also summarized. In addition, the TMB of each patient was further estimated.
TME and immune cell analysis
The ESTIMATE algorithm was first used to estimate immune score, stromal score, and estimate score based on the mRNA expression data (21). A lower immune score represents lower infiltration status of immune cells in tumor tissue. Furthermore, the infiltrating immune cells in the TME was calculated using the CIBERSORT algorithm (22). CIBERSORT calculates the proportions of 22 immune cell types, including T-cell types, naïve and memory B cells, plasma cells, natural killer (NK) cells, and myeloid subsets.
Identification of differentially expressed genes (DEGs)
According to the cut-off value of survival analysis, DEGs between low and high TMB, low and high immune score, and low and high stromal score were identified by using the R package “edgeR” (23,24). DEGs that met the criteria of false discovery rate (FDR) <0.05 and |log2 fold change| >1 were used for further analysis. Hub DEGs are the common intersection of 3 groups of DEGs (TMB group, immune score group, and stromal score group).
Construction and validation of the immune signature
Univariate Cox regression analysis was performed to screen the prognostic genes of LUSC patients among the hub DEGs with P<0.05 as the criterion. On the basis of these prognostic genes, the LASSO Cox regression analysis was performed to construct the immune signature for LUSC by using the R package “glmnet”. Next, the cut-off value of the risk score was determined by using the R package “survminer”. The survival difference was compared using the Kaplan-Meier (K-M) survival analysis combined with the log-rank test. The prognostic function of the immune signature was validated in the GSE19188, GSE29013, GSE30219, and GSE73403 datasets. Risk score was calculated with the same immune signature formula from TCGA dataset. The K-M method and receiver-operating characteristic (ROC) curves were used to evaluate and validate the predictive value of the immune signature.
Development and evaluation of the nomogram based on the immune signature
To construct a nomogram based on the immune signature, we first need to determine independent risk factors for patients with LUSC by using univariate and multivariate Cox regression analyses. According to the results of the multivariate Cox analysis, the nomogram was developed on the basis of independent risk factors using the R package “rms” to predict survival probability. The fitting degree of the nomogram was evaluated by calibrations. ROC curve analysis and the concordance index (C-index) were used to evaluate the predictive accuracy and discrimination ability of the nomogram, respectively.
Functional enrichment and pathway analyses
To study the molecular mechanisms potentially underlying the immune signature, Gene Ontology (GO) and Kyoto Encyclopedia of Genes and Genomes (KEGG) pathway enrichment analyses was performed using the R package “clusterProfiler” (25). Enrichment results satisfying a nominal P value <0.05 and an FDR <0.25 were considered to be statistically significant.
Statistical analysis
Statistical analysis was performed with R software (R Foundation for Statistical Computing, Vienna, Austria). Survival analysis was performed using the K-M method and the log-rank test in GraphPad Prism (GraphPad Software, San Diego, California, USA). Two-sided t-test was used to analyze the difference of continuous variables between 2 groups. P<0.05 was considered statistically significant.
Results
Tumor mutation analysis in LUSC
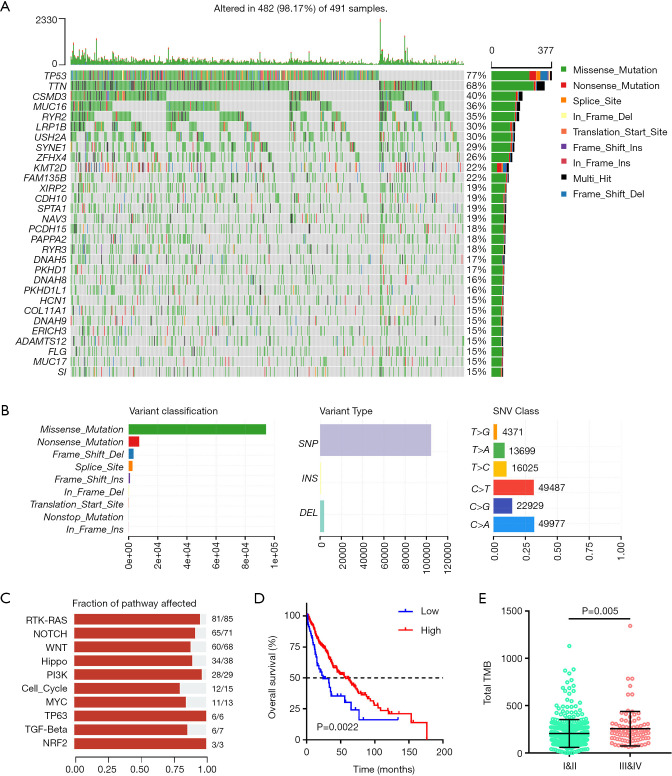
The somatic mutation profiles of LUSC patients were analyzed by using the R package “maftools”. The results showed that TP53 (77%), TTN (68%), CSMD3 (40%), MUC16 (36%), and RYR2 (35%) mutations were the top 5 mutated genes, and the TP53 mutation was the most mutated gene in LUSC patients (Figure 1A). As shown in Figure 1B, missense mutations, single-nucleotide polymorphisms, and C>T were the most common mutation variant classification, variant type, and SNV class in LUSC, respectively. In addition, the co-occurrence association between mutated genes are shown in Figure S1. Pathway enrichment analysis suggested that these mutated genes were significantly associated with the TP53, Ras, Notch, Wnt, and Hippo signaling pathways (Figure 1C). TMB is an important biomarker of response to immunotherapy in NSCLC. Furthermore, the TMB value was calculated and was used to analyze the correlation with OS and pathological stages. Patients with low TMB had significantly poorer survival than LUSC patients in the high TMB group (P<0.05) (Figure 1D). Finally, we also found that the TMB levels were positively associated with pathological stages (P<0.05) (Figure 1E).
Figure 1.
Summary of the LUSC mutation information. (A) Landscape of mutation profiles in LUSC; (B) classification of different mutation types; (C) pathway enrichment analysis of mutated genes; (D) Kaplan-Meier survival analysis of TMB; (E) TMB levels in different tumor stages. LUSC, lung squamous cell carcinoma; TMB, tumor mutation burden.
TME characterization analysis in LUSC
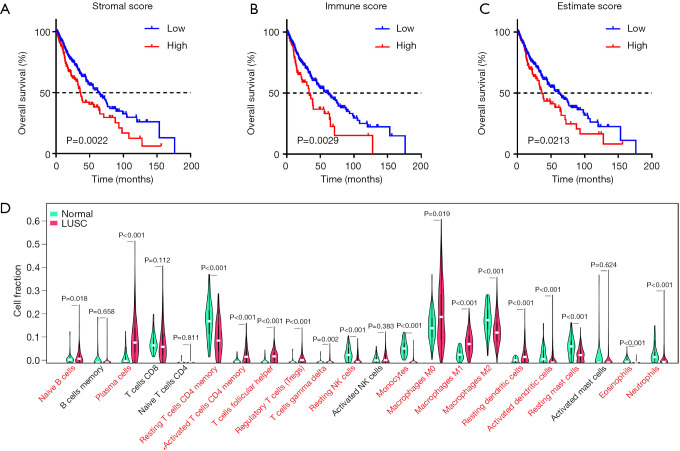
The stromal, immune, and ESTIMATE scores of the TME were calculated based on the mRNA expression profiles using the ESTIMATE algorithm. We first studied the prognostic role of stromal, immune, and ESTIMATE scores on LUSC patient outcomes. As shown in Figure 2A,B,C, lower stromal, immune, or ESTIMATE scores have a longer survival time than those with higher levels (P<0.05). Next, we investigated the relationship between TME scores and pathological stages. However, stromal, immune and ESTIMATE scores were not found to be significantly different in different pathological stages (Figure S2A,B,C). Immune cell infiltration is closely associated with cancer progression and clinical outcomes; therefore, we further analyzed immune cell difference to explore the TME in LUSC. The results of the CIBERSORT analysis suggested that there were significant differences for naïve B cells, plasma cells, resting memory T-cell CD4+, memory-activated T-cell CD4+, regulatory T cells (Tregs), T-cell gamma delta, resting NK cells, monocytes, macrophage M0, macrophage M1, macrophage M2, activated dendritic cells, and neutrophils (Figure 2D). In addition, we also found some of these immune cells have potential correlations (Figure S2D).
Figure 2.
Tumor microenvironment characterization analysis in LUSC. Kaplan-Meier survival analysis of stromal score (A), immune score (B), and ESTIMATE score (C). (D) Immune cell proportions in LUSC. NK, natural killer.
Construction of the immune signature for prognosis in LUSC
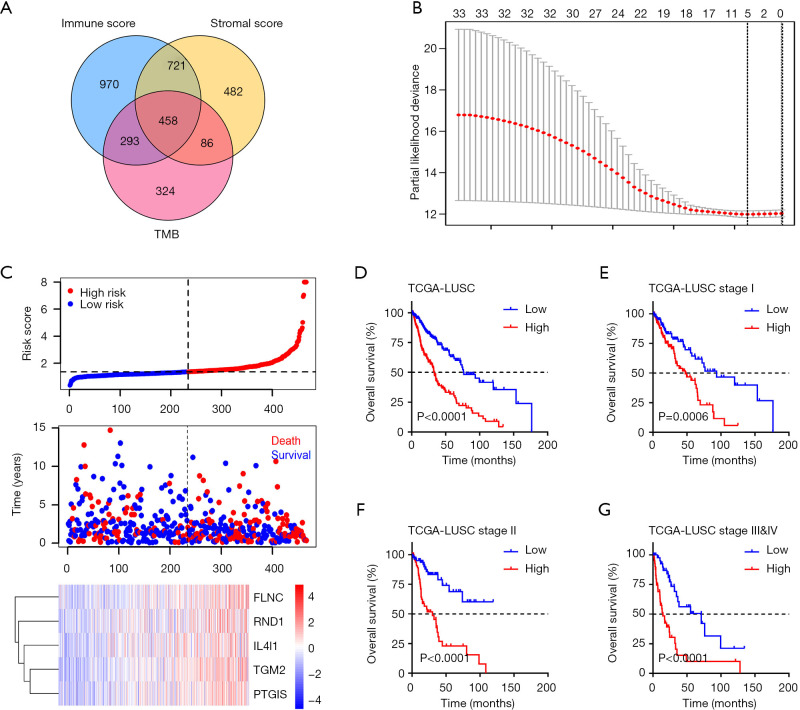
As TMB and TME play an important role in LUSC prognosis, the TME- and TMB-related immune signature was constructed. First, DEGs for TME and TMB were analyzed by using R package “edgeR”. A total of 1,748, 2,443, and 1,162 DEGs were identified for stromal score, immune score, and TMB, respectively (|log2Fold Change| >1 and P<0.05). Of these DEGs, 458 genes were identified as hub DEGs for further analysis (Figure 3A). Univariate Cox regression analysis was then performed to screen genes significantly associated with survival time. The 33 most significant genes were selected with the criterion of P<0.05. Next, LASSO Cox analysis identified 5 hub genes [filamin-C (FLNC), Rho GTPase 1 (RND1), interleukin 4-induced gene 1 (IL4I1), transglutaminase 2 (TGM2), and prostaglandin I2 (PTGIS)], which were used to construct the immune signature according to the coefficients (Figure 3B). The risk score of each patient was calculated by immune signature, and all patients were divided into 2 groups (low risk and high risk) according to the median risk score. The distributions of risk score, survival time, and 5-gene mRNA expression of all LUSC patients are shown in the Figure 3C. We found that the low-risk group had a significantly better prognostic outcome than the patients in the high-risk group (P<0.0001) (Figure 3D). In addition, we also analyzed the prognosis of patients at each tumor stage separately. A similar result was confirmed; low-risk patients have a longer survival time than high-risk patients (all P<0.001) (Figure 3E,F,G).
Figure 3.
Immune signature constructed for the prognosis of LUSC. (A) Identification of hub differentially expressed genes; (B) LASSO Cox analysis; (C) Distribution of the risk score, survival data, and the mRNA expression of immune signature; (D) Kaplan-Meier survival analysis of the immune signature. Kaplan-Meier survival analysis of the immune signature in stage I (E), stage II (F), stages III and IV (G).
Validation of immune signature in multiple GEO LUSC cohorts
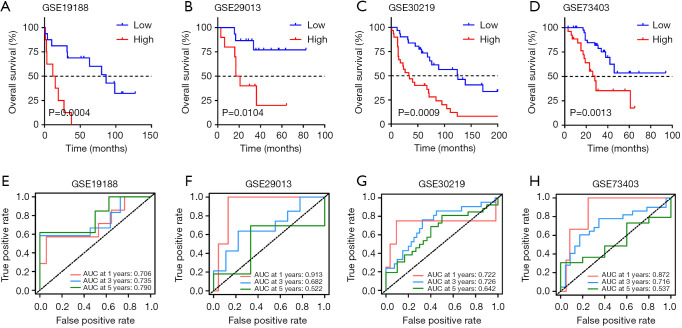
To validate whether the immune signature had similar prognostic value among different LUSC populations, the prediction performance of the immune signature was evaluated in 4 independent GEO LUSC cohorts. For the validation data for patients with LUSC, the GSE19188, GSE29013, GSE30219, and GSE73403 datasets included 24, 25, 61, and 69 patients, respectively. As shown in Figure 4A,B,C,D, consistent with the result of TCGA training cohort, the K-M survival curves of 4 independent GEO cohorts all suggested that high-risk patients have significantly poorer prognosis than low-risk patients (GSE19188: P=0.0004, GSE29013: P=0.0104, GSE30219: P=0.0009, and GSE73403: P=0.0013). The area under curve (AUC) for 1-, 3-, 5-year OS were 0.706, 0.735, and 0.790, respectively (Figure 4E). In addition, we also found that the AUCs for 1- and 3-year OS were relatively high, while the AUCs for 5-year OS was low in the GSE29013, GSE30219, and GSE73403 cohorts (Figure 4F,G,H). Although the sample size was small, our immune signature clearly distinguished low- and high-risk patients.
Figure 4.
Validation of the immune signature in multiple Gene Expression Omnibus lung squamous cell carcinoma cohorts. (A–D) Kaplan–Meier survival analysis of immune signature in the GSE19188, GSE29013, GSE30219, and GSE73403 datasets. (E-H) Time-dependent receiver-operating characteristic analysis of immune signature in the GSE19188, GSE29013, GSE30219, and GSE73403 datasets. AUC: area under curve.
Development of a nomogram based on immune signature
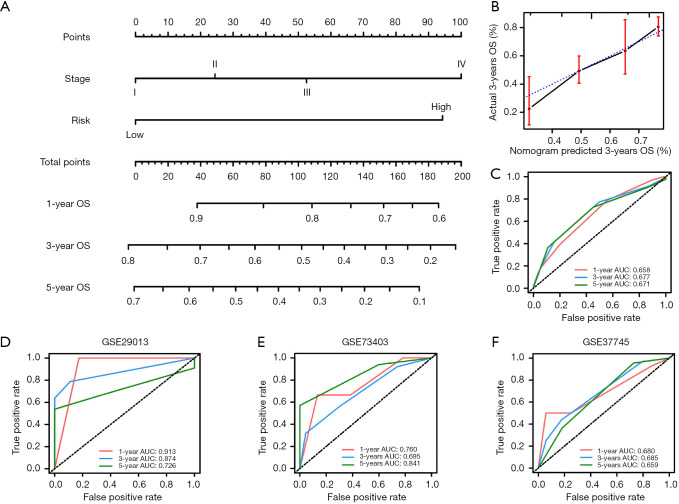
The independent clinical prognostic risk factors were first determined using univariate and multivariate Cox analyses. As shown in Table 1, univariate Cox analysis suggested that tumor stage and risk score were significantly associated with OS. The results of the multivariate Cox analysis suggested that the risk score of the immune signature was an independent prognostic factors for OS (Table 1). Furthermore, as tumor stage is an important indicator for prognosis, the prognostic nomogram was constructed by integrating the risk score and tumor stage. The nomogram plot showed that the risk point of the immune signature was found to be similar to tumor stage (Figure 5A). The calibration plot showed good performance between the outcomes predicted by the nomogram and actual observations (Figure 5B). The C-index for the nomogram was 0.696 with 1000 bootstrap replicates. The AUCs of the nomogram for 1-, 3-, and 5-year OS were: 0.658, 0.677, and 0.671, respectively. Finally, we applied the same method to validate the nomogram in 3 independent GEO cohorts. The AUCs for 1-, 3-, and 5-year OS were: 0.913, 0.874, and 0.726, respectively for the GSE29013 cohort; 0.760, 0.695, and 0.841, respectively, for the GSE73403 cohort; and 0.680, 0.685, and 0.659, respectively, for the GSE37745 cohort (Figure 5D,E,F). Therefore, these results indicate that our nomogram could be used to accurately predict OS in LUSC patients.
Table 1. Univariate and multivariate Cox regression analysis in The Cancer Genome Atlas lung squamous cell carcinoma.
| Variables | Univariate analysis | Multivariate analysis | |||
|---|---|---|---|---|---|
| HR (95% CI) | P value | HR (95% CI) | P value | ||
| Age (≥60/<60 years) | 1.147 (0.756–1.741) | 0.518 | 1.310 (0.805–2.130) | 0.277 | |
| Sex (male/female) | 1.140 (0.806–1.612) | 0.458 | 1.357 (0.915–2.014) | 0.129 | |
| Stage (III + IV/I + II) | 1.680 (1.199–2.352) | 0.002 | 1.163 (0.672–2.013) | 0.589 | |
| TNM_T (3+4/1+2) | 1.753 (1.249–2.460) | 0.001 | 1.268 (0.757–2.126) | 0.367 | |
| TNM_M (M1/M0) | 1.965 (0.624–6.194) | 0.249 | 1.640 (0.496–5.422) | 0.417 | |
| TNM_N (≥1/0) | 1.279 (0.948–1.727) | 0.107 | 1.297 (0.898–1.873) | 0.165 | |
| Risk (high/low) | 2.705 (1.981–3.694) | <0.001 | 2.786 (1.975–3.931) | <0.001 | |
CI, confidence interval; HR, hazard ratio.
Figure 5.
Development of a nomogram based on immune signature. (A) Development of a nomogram to predict overall survival (OS). (B) Calibration curve of the OS of lung squamous cell carcinoma patients. (C) Time-dependent receiver-operating characteristic curves of the nomogram comparing 1-, 3-, and 5-year OS. (D,E,F) Time-dependent ROC curves of the nomogram comparing 1-, 3-, and 5-year OS in the GSE29013, GSE73403, and GSE37745 datasets, respectively. AUC, area under curve; OS, overall survival.
Immune signature predicted immunotherapeutic benefits in LUSC
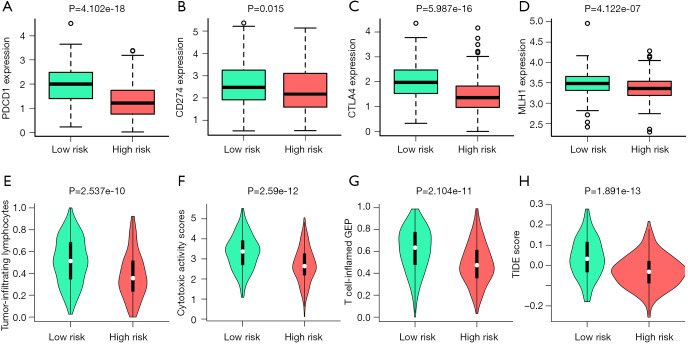
Immunotherapy has become an important therapeutic method for LUSC patients. To evaluate the predictive ability of the immune signature for the effect of immunotherapy, we explored the correlation between the immune signature and the expression of immune checkpoints, the fraction of immune cells, and other immunotherapy biomarkers in LUSC. As shown in Figure 6A,B,C, the expressions of PDCD1, CD274, and CTLA-4 significantly increased in the low-risk group compared with the high-risk group, indicating a potentially enhanced effect of corresponding antibodies in patients with a low-risk score. MLH1, a key protein involved in DNA mismatch repair, was closely related to immunotherapy (26,27). Interestingly, the expression level of the MLH1 gene was also significantly decreased in the patients with a high-risk score (Figure 6D). We further analyzed the immunotherapy-related biomarkers in TCGA LUSC cohort. Patients with a high-risk score were characterized by significantly lower tumor-infiltrating lymphocytes and cytotoxic activity scores (Figure 6E, F). The T cell-inflamed gene expression profile (GEP) was used and showed a higher inflamed score in the low-risk group (Figure 6G). The tumor immune dysfunction and exclusion (TIDE) score was also significantly higher in the low-risk group compared with the high-risk group (Figure 6H).
Figure 6.
Immune signature predicted the immunotherapeutic benefits in lung squamous cell carcinoma. (A,B,C,D) mRNA expression of PDCD1, CD274, CTLA-4, and MLH1 in the low-risk and high-risk groups. (E) Distribution of tumor-infiltrating lymphocytes. (F) Distribution of cytotoxic activity scores. (G) Distribution of T-cell-inflamed GEP. (H) Distribution of TIDE score. GEP, gene expression profile; TIDE, tumor immune dysfunction and exclusion.
Functional enrichment and pathway analyses
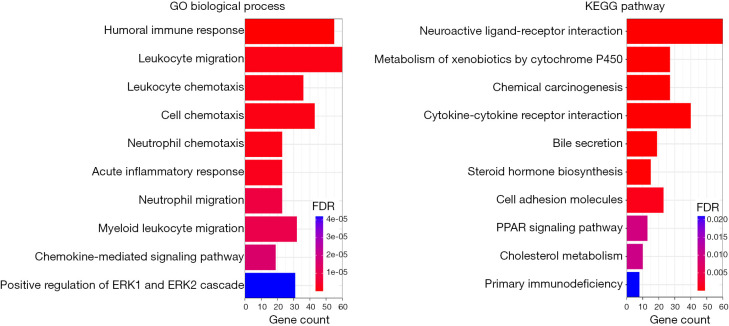
To better understand the molecular mechanism of immune signature in LUSC, functional enrichment analysis was performed based on GO biological process and KEGG pathway gene sets by using “clusterProfiler” in R package. As expected, DEGs were found to be enriched in immune-related biological processes, such as leukocyte migration and chemotaxis, neutrophil chemotaxis, chemokine-mediated signaling pathway, and the positive regulation of the ERK1 and ERK2 cascade (Figure 7A). These biological processes suggest that they have a positive role in the enrichment of tumor-associated immunity. Furthermore, the KEGG pathway analysis showed that the immune signature was significantly associated with the metabolism of xenobiotic by cytochrome P450, cytokine–cytokine receptor interaction, bile secretion, the peroxisome proliferators-activated receptor (PPAR) signaling pathway, and cholesterol metabolism (Figure 7B). We speculated that metabolic pathways may be the intermediate link between tumor cells and immune cells, therefore influence tumor progression.
Figure 7.
Functional enrichment and pathway analyses. (A) GO biological process enrichment analysis of the immune signature; (B) KEGG pathway enrichment analysis of the immune signature. KEGG, Kyoto Encyclopedia of Genes and Genomes; GO, Gene Ontology.
Discussion
In the present study, we comprehensively analyzed TMB and TME in LUSC. We found that tumor mutation and immune microenvironment play an important role in the progression and prognosis of LUSC. Furthermore, we constructed and validated an immune signature based on 5 genes (FLNC, RND1, IL4I1, TGM2, and PTGIS), which was able to predict the prognosis and immunotherapeutic response for LUSC patients. The immune signature showed that patients with a high-risk score had a significantly poor prognostic outcome than those with a low-risk score at each tumor stage. Multiple independent GEO datasets demonstrated that the nomogram that integrated the immune signature with tumor stage gave the best performance in predicting the survival of LUSC patients. Furthermore, patients with a low-risk score had a potentially high response rate to immunotherapy. Finally, functional enrichment and pathway analyses suggested several significantly enriched immunological biological processes and various metabolism pathways, which might help to explain the potential molecular mechanisms of the immune signature.
Currently, it is widely accepted that tumorigenesis is the result of the gradual accumulation of gene mutations. As gene mutation plays an important role in tumors, it is also a biomarker and drug target for diagnosis and therapy (28). In the present study, the mutation variant classification, variant type, and SNV class of LUSC patients were summarized. The missense mutation is the most common mutation variant classification. We also found that TP53 mutation (77%) as the most mutated gene in LUSC patients. Additionally, mutated genes were enriched in the TP53, Ras, Notch, Wnt, and Hippo signaling pathways, which are potential drug targets for LUSC treatment. Furthermore, high TMB could induce the creation of neoantigens and is associated with increased tumor immunogenicity and response to immunotherapy. For this reason, TMB has been considered a predictive biomarker for immunotherapy efficacy. In TCGA LUSC dataset, TMB levels were significantly associated with tumor stages. Patients with low TMB had significantly poorer survival than LUSC patients with high TMB.
Gene mutation can also lead to the change of TME that results in the immune system being unable to recognize and kill tumor cells (29). Tumor-infiltrating immune cells are important parts of the TME, and can promote or inhibit tumor formation and development (30). We found that high stromal, immune, or ESTIMATE scores were significantly correlated with poor survival in TCGA LUSC patients. In addition, the relative proportions of immune cells were further investigated. B cells, plasma cells, memory-activated CD4+ T cells, Tregs, and macrophage M1 are increased in tumor tissues compared with normal tissues, while resting memory CD4+ T cells, NK cells, macrophage M2, and neutrophils are significantly decreased. These results suggest that the differences in tumor-infiltrating immune cells contribute to LUSC growth, progression, and invasion.
Most of the 5 genes in the immune signature have been reported to be involved in cancer progression. FLNC, a member of the actin-binding filamin protein family, is associated with lymphatic invasion and metastasis (31). FLNC is an important component of the cytoskeleton, and plays a role in cell adhesion and migration (32). However, to date, the role and mechanism of FLNC in lung cancer have not been demonstrated. The Rho GTPase family belongs to the RAS superfamily that is involved in cancer formation and progression (33). A recent study demonstrated that Rho GTPase 1 (RND1) restrains the activation of Ras–mitogen-activated protein kinase signaling pathway and tumor initiation and progression, which is a highly activated oncogenic pathway involved in the progression of lung cancer. Nevertheless, the effect of RND1 in lung cancer has not been reported. Interleukin 4-induced gene1 (IL4I1), which encodes the secreted L‐amino acid oxidase protein, was first detected in B lymphocytes (34). As IL4I1 is widely expressed in tumor-associated macrophages and T lymphocytes, it is associated with immune escape (35). Transglutaminase 2 (TGM2) exerts multiple physiological functions and is associated with cancer cell survival and metastatic behavior (36). It has been reported that TGM2 promotes the migration and invasion of lung cancer cells (37). The expression of PTGIS was found to be correlated with lung cancer patient survival (38). In a mouse model, the transgenic overexpression of PTGIS significantly decreased lung tumor formation and tumor burden (39,40).
Immunotherapy has achieved some success in the treatment of NSCLC, including LUSC and lung adenocarcinoma. However, only a proportion of patients benefit from immunotherapy. Therefore, understanding the mechanism of the varied therapeutic responses to immunotherapy is critical to improving personal diagnoses and precision medicine. PD-L1 expression is an important biomarker that can predict the response to anti-PD-1/PD-L1 therapies. CTLA-4 is critical for the control of CD4+ T cell function and is primarily involved in the priming phase of immune response. In the present study, we studied the correlation between the immune signature and other immunotherapeutic biomarker to evaluate the predictive ability of the immune signature for LUSC immunotherapy. We found that the expressions of PDCD1, CD274, and CTLA-4 were significantly increased in the low-risk group compared with the high-risk group, indicating a potentially enhanced effect of corresponding antibodies in patients with a low-risk score. In addition, patients with a low-risk score were characterized by a significantly higher tumor-infiltrating lymphocytes and cytotoxic activity scores. Therefore, patients with a low-risk score could derive more benefit from immunotherapy than patients with a high-risk score.
However, the present study has some limitations. First, the data for evaluating immunotherapy were download from TCGA dataset, instead of the real immunotherapy cohort. Second, the sample size of the present study was relatively small, and the immune signature needs larger sample sizes to increase its reliability. Third, immune signature-related functional experiments are needed to elucidate the molecular mechanism. Therefore, future research is still needed to address these issues.
Conclusions
In the present study, we developed and validated an immune signature to effectively predict survival and immunotherapeutic response in patients with LUSC. Our immune signature may help to guide personalized medicine for LUSC patients.
Supplementary
The article’s supplementary files as
Acknowledgments
Funding: This study was supported by the Natural Science Foundation Grant (No. 82072567).
Ethical Statement: The authors are accountable for all aspects of the work in ensuring that questions related to the accuracy or integrity of any part of the work are appropriately investigated and resolved. The study was conducted in accordance with the Declaration of Helsinki (as revised in 2013).
Footnotes
Reporting Checklist: The authors have completed the REMARK reporting checklist. Available at http://dx.doi.org/10.21037/atm-21-463
Conflicts of Interest: All authors have completed the ICMJE uniform disclosure form (available at http://dx.doi.org/10.21037/atm-21-463). The authors have no conflicts of interest to declare
References
- 1.Chen Z, Fillmore CM, Hammerman PS, et al. Non-small-cell lung cancers: a heterogeneous set of diseases. Nat Rev Cancer 2014;14:535-46. 10.1038/nrc3775 [DOI] [PMC free article] [PubMed] [Google Scholar]
- 2.Reck M, Rabe KF. Precision Diagnosis and Treatment for Advanced Non-Small-Cell Lung Cancer. N Engl J Med 2017;377:849-61. 10.1056/NEJMra1703413 [DOI] [PubMed] [Google Scholar]
- 3.Camidge DR, Doebele RC, Kerr KM. Comparing and contrasting predictive biomarkers for immunotherapy and targeted therapy of NSCLC. Nat Rev Clin Oncol 2019;16:341-55. 10.1038/s41571-019-0173-9 [DOI] [PubMed] [Google Scholar]
- 4.Skoulidis F, Heymach JV. Co-occurring genomic alterations in non-small-cell lung cancer biology and therapy. Nat Rev Cancer 2019;19:495-509. 10.1038/s41568-019-0179-8 [DOI] [PMC free article] [PubMed] [Google Scholar]
- 5.Doroshow DB, Sanmamed MF, Hastings K, et al. Immunotherapy in Non-Small Cell Lung Cancer: Facts and Hopes. Clin Cancer Res 2019;25:4592-602. 10.1158/1078-0432.CCR-18-1538 [DOI] [PMC free article] [PubMed] [Google Scholar]
- 6.Vansteenkiste J, Wauters E, Reymen B, et al. Current status of immune checkpoint inhibition in early-stage NSCLC. Ann Oncol 2019;30:1244-53. 10.1093/annonc/mdz175 [DOI] [PubMed] [Google Scholar]
- 7.Wei SC, Duffy CR, Allison JP. Fundamental Mechanisms of Immune Checkpoint Blockade Therapy. Cancer Discov 2018;8:1069-86. 10.1158/2159-8290.CD-18-0367 [DOI] [PubMed] [Google Scholar]
- 8.Anichini A, Perotti VE, Sgambelluri F, et al. Immune Escape Mechanisms in Non Small Cell Lung Cancer. Cancers (Basel) 2020;12:3605. 10.3390/cancers12123605 [DOI] [PMC free article] [PubMed] [Google Scholar]
- 9.Anagnostou V, Smith KN, Forde PM, et al. Evolution of Neoantigen Landscape during Immune Checkpoint Blockade in Non-Small Cell Lung Cancer. Cancer Discov 2017;7:264-76. 10.1158/2159-8290.CD-16-0828 [DOI] [PMC free article] [PubMed] [Google Scholar]
- 10.Hellmann MD, Nathanson T, Rizvi H, et al. Genomic Features of Response to Combination Immunotherapy in Patients with Advanced Non-Small-Cell Lung Cancer. Cancer Cell 2018;33:843-52.e4. 10.1016/j.ccell.2018.03.018 [DOI] [PMC free article] [PubMed] [Google Scholar]
- 11.Sholl LM, Hirsch FR, Hwang D, et al. The Promises and Challenges of Tumor Mutation Burden as an Immunotherapy Biomarker: A Perspective from the International Association for the Study of Lung Cancer Pathology Committee. J Thorac Oncol 2020;15:1409-24. 10.1016/j.jtho.2020.05.019 [DOI] [PMC free article] [PubMed] [Google Scholar]
- 12.Wang Z, Duan J, Cai S, et al. Assessment of Blood Tumor Mutational Burden as a Potential Biomarker for Immunotherapy in Patients With Non-Small Cell Lung Cancer With Use of a Next-Generation Sequencing Cancer Gene Panel. JAMA Oncol 2019;5:696-702. 10.1001/jamaoncol.2018.7098 [DOI] [PMC free article] [PubMed] [Google Scholar]
- 13.Gandara DR, Paul SM, Kowanetz M, et al. Blood-based tumor mutational burden as a predictor of clinical benefit in non-small-cell lung cancer patients treated with atezolizumab. Nat Med 2018;24:1441-8. 10.1038/s41591-018-0134-3 [DOI] [PubMed] [Google Scholar]
- 14.Schoenhals JE, Seyedin SN, Anderson C, et al. Uncovering the immune tumor microenvironment in non-small cell lung cancer to understand response rates to checkpoint blockade and radiation. Transl Lung Cancer Res 2017;6:148-58. 10.21037/tlcr.2017.03.06 [DOI] [PMC free article] [PubMed] [Google Scholar]
- 15.Murciano-Goroff YR, Warner AB, Wolchok JD. The future of cancer immunotherapy: microenvironment-targeting combinations. Cell Res 2020;30:507-19. 10.1038/s41422-020-0337-2 [DOI] [PMC free article] [PubMed] [Google Scholar]
- 16.Topalian SL, Taube JM, Anders RA, et al. Mechanism-driven biomarkers to guide immune checkpoint blockade in cancer therapy. Nat Rev Cancer 2016;16:275-87. 10.1038/nrc.2016.36 [DOI] [PMC free article] [PubMed] [Google Scholar]
- 17.Ferrara R, Imbimbo M, Malouf R, et al. Single or combined immune checkpoint inhibitors compared to first-line platinum-based chemotherapy with or without bevacizumab for people with advanced non-small cell lung cancer. Cochrane Database Syst Rev 2020;12:CD013257. [DOI] [PMC free article] [PubMed] [Google Scholar]
- 18.Hussaini S, Chehade R, Boldt RG, et al. Association between immune-related side effects and efficacy and benefit of immune checkpoint inhibitors - A systematic review and meta-analysis. Cancer Treat Rev 2021;92:102134. 10.1016/j.ctrv.2020.102134 [DOI] [PubMed] [Google Scholar]
- 19.Hu-Lieskovan S, Lisberg A, Zaretsky JM, et al. Tumor Characteristics Associated with Benefit from Pembrolizumab in Advanced Non-Small Cell Lung Cancer. Clin Cancer Res 2019;25:5061-8. 10.1158/1078-0432.CCR-18-4275 [DOI] [PMC free article] [PubMed] [Google Scholar]
- 20.Mayakonda A, Lin DC, Assenov Y, et al. Maftools: efficient and comprehensive analysis of somatic variants in cancer. Genome Res 2018;28:1747-56. 10.1101/gr.239244.118 [DOI] [PMC free article] [PubMed] [Google Scholar]
- 21.Yoshihara K, Shahmoradgoli M, Martinez E, et al. Inferring tumour purity and stromal and immune cell admixture from expression data. Nat Commun 2013;4:2612. 10.1038/ncomms3612 [DOI] [PMC free article] [PubMed] [Google Scholar]
- 22.Newman AM, Liu CL, Green MR, et al. Robust enumeration of cell subsets from tissue expression profiles. Nat Methods 2015;12:453-7. 10.1038/nmeth.3337 [DOI] [PMC free article] [PubMed] [Google Scholar]
- 23.Robinson MD, McCarthy DJ, Smyth GK. edgeR: a Bioconductor package for differential expression analysis of digital gene expression data. Bioinformatics 2010;26:139-40. 10.1093/bioinformatics/btp616 [DOI] [PMC free article] [PubMed] [Google Scholar]
- 24.McCarthy DJ, Chen Y, Smyth GK. Differential expression analysis of multifactor RNA-Seq experiments with respect to biological variation. Nucleic Acids Res 2012;40:4288-97. 10.1093/nar/gks042 [DOI] [PMC free article] [PubMed] [Google Scholar]
- 25.Yu G, Wang LG, Han Y, et al. clusterProfiler: an R package for comparing biological themes among gene clusters. OMICS 2012;16:284-7. 10.1089/omi.2011.0118 [DOI] [PMC free article] [PubMed] [Google Scholar]
- 26.Germano G, Lamba S, Rospo G, et al. Inactivation of DNA repair triggers neoantigen generation and impairs tumour growth. Nature 2017;552:116-20. 10.1038/nature24673 [DOI] [PubMed] [Google Scholar]
- 27.Dudley JC, Lin MT, Le DT, et al. Microsatellite Instability as a Biomarker for PD-1 Blockade. Clin Cancer Res 2016;22:813-20. 10.1158/1078-0432.CCR-15-1678 [DOI] [PubMed] [Google Scholar]
- 28.McGranahan N, Swanton C. Clonal Heterogeneity and Tumor Evolution: Past, Present, and the Future. Cell 2017;168:613-28. 10.1016/j.cell.2017.01.018 [DOI] [PubMed] [Google Scholar]
- 29.Nicoś M, Krawczyk P, Crosetto N, et al. The Role of Intratumor Heterogeneity in the Response of Metastatic Non-Small Cell Lung Cancer to Immune Checkpoint Inhibitors. Front Oncol 2020;10:569202. 10.3389/fonc.2020.569202 [DOI] [PMC free article] [PubMed] [Google Scholar]
- 30.Lei X, Lei Y, Li JK, et al. Immune cells within the tumor microenvironment: Biological functions and roles in cancer immunotherapy. Cancer Lett 2020;470:126-33. 10.1016/j.canlet.2019.11.009 [DOI] [PubMed] [Google Scholar]
- 31.Goldmann WH. Intermediate filaments and cellular mechanics. Cell Biol Int 2018;42:132-8. 10.1002/cbin.10879 [DOI] [PubMed] [Google Scholar]
- 32.Knyazeva A, Khudiakov A, Vaz R, et al. FLNC Expression Level Influences the Activity of TEAD-YAP/TAZ Signaling. Genes (Basel) 2020;11:1343. 10.3390/genes11111343 [DOI] [PMC free article] [PubMed] [Google Scholar]
- 33.Svensmark JH, Brakebusch C. Rho GTPases in cancer: friend or foe? Oncogene 2019;38:7447-56. 10.1038/s41388-019-0963-7 [DOI] [PubMed] [Google Scholar]
- 34.Molinier-Frenkel V, Prevost-Blondel A, Castellano F. The IL4I1 Enzyme: A New Player in the Immunosuppressive Tumor Microenvironment. Cells 2019;8:757. 10.3390/cells8070757 [DOI] [PMC free article] [PubMed] [Google Scholar]
- 35.Castellano F, Molinier-Frenkel V. An Overview of l-Amino Acid Oxidase Functions from Bacteria to Mammals: Focus on the Immunoregulatory Phenylalanine Oxidase IL4I1. Molecules 2017;22:2151. 10.3390/molecules22122151 [DOI] [PMC free article] [PubMed] [Google Scholar]
- 36.Huang L, Xu AM, Liu W. Transglutaminase 2 in cancer. Am J Cancer Res 2015;5:2756-76. [PMC free article] [PubMed] [Google Scholar]
- 37.Lee HT, Huang CH, Chen WC, et al. Transglutaminase 2 Promotes Migration and Invasion of Lung Cancer Cells. Oncol Res 2018;26:1175-82. 10.3727/096504018X15149761920868 [DOI] [PMC free article] [PubMed] [Google Scholar]
- 38.Cathcart MC, Gray SG, Baird AM, et al. Prostacyclin synthase expression and epigenetic regulation in nonsmall cell lung cancer. Cancer 2011;117:5121-32. 10.1002/cncr.26168 [DOI] [PubMed] [Google Scholar]
- 39.Keith RL, Miller YE, Hudish TM, et al. Pulmonary prostacyclin synthase overexpression chemoprevents tobacco smoke lung carcinogenesis in mice. Cancer Res 2004;64:5897-904. 10.1158/0008-5472.CAN-04-1070 [DOI] [PubMed] [Google Scholar]
- 40.Keith RL, Miller YE, Hoshikawa Y, et al. Manipulation of pulmonary prostacyclin synthase expression prevents murine lung cancer. Cancer Res 2002;62:734-40. [PubMed] [Google Scholar]
Associated Data
This section collects any data citations, data availability statements, or supplementary materials included in this article.
Supplementary Materials
The article’s supplementary files as


