Abstract
Background
Tumor mutational burden (TMB) is widely regarded as a predictor of response to immunotherapy. Few researchers have focused on the activity and prognosis of TMB in endometrial cancer (EC) and immune cells. Our study aimed to identify the prognostic role of TMB in EC.
Methods
We downloaded transcriptome data from The Cancer Genome Atlas (TCGA) database. Kaplan-Meier analysis with log-rank test was conducted to assess the difference in overall survival (OS) between the high and low TMB groups. The “CIBERSORT” scripts were performed to evaluate the immune compositions of EC patients. Cox regression analysis and survival analysis were used to verify the prognostic value prognosis of TMB.
Results
We obtained the single nucleotide mutation data for 529 EC patients. A missense mutation was the most common mutation type. TMB was associated with survival outcome, tumor grades, and pathological types. We identified 10 hub TMB-related signature and found that elevated T-cell subsets infiltrating density in the high TMB group revealed improved survival outcomes. According to Kaplan-Meier analysis, T cells gamma delta and T cells regulatory were prognostic immune cells in EC samples. Moreover, many top gene set enrichment analysis (GSEA) results, including amino sugar and nucleotide sugar metabolism, nucleotide excision repair, or p53 signaling pathway, were enriched significantly with TMB level as phenotype.
Conclusions
TMB is an important prognostic factor for EC, and TMB-related genes may be potential therapeutic targets for EC.
Keywords: Endometrial cancer (EC), immune cells, tumor mutational burden (TMB)
Introduction
Endometrial cancer (EC) is the most common female reproductive tract malignancies in developed nations with an increasing incidence. It was estimated that 63,230 new cases and 11,350 deaths resulting from EC occurred in 2018 (1,2). EC has become a serious disease that threatens women’s health and quality of life, increasing the disease risk and medical burden on society. The majority of women with EC are in the early stage of the disease with a good prognosis after surgery therapy alone (2). However, about 15% of patients with EC are diagnosed with high-risk factors, and women with high-risk factors have an increased risk of distant metastasis and tumor-related death (3,4). As an independent organ, tumor formation means the complex evolution of neoplastic cells, immune cells, extracellular matrix, and tumor vasculature (5).
The clinical successes of chimeric antigen receptor T cell and immune checkpoint blockade therapies represent a milestone in cancer immunotherapy (6). Immunotherapy has become an essential treatment for advanced-stage cancers (2,7-9). The immune cells can play opposing roles in developing tumors: promotion of tumor progression versus clearance of neoplastic cells (6). And progressive results have been achieved. In many malignant tumors, immunotherapy is designed to induce type I inflammation and enhance cytotoxic T cells, type 1 T helper cells and type M1 macrophages to eliminate tumor cells (10,11). Indoleamine 2,3-dioxygenase (IDO) has been identified to interfere with tumor lymphatic endothelial cell infiltration and is associated with poor survival prognosis in EC (12). In recent years, the development of IDO inhibitors has shown preliminary therapeutic promise in cancer therapy (13). Since CD8+ T cells are the major direct effector of cytotoxic responses to cancer cells, after PD-1 blockade in lung cancer patients, PD-1 and CD8+ T cells expanded, these changes are considered to be the result of effective antitumor immunity, and tumor CD8+, T cell infiltration, correlates with positive clinical outcome (14,15).
The tumor immune microenvironment mainly refers to the microenvironment associated with immune cells (16). Pierini et al. has found that regulatory T cells (Treg) in the immune microenvironment have the ability to immune tolerance and suppress conventional T cells and other immune cells (such as natural killer cells and B lymphocytes) (17). Zhao indicated that Treg could secrete vascular endothelial growth factor A (VEGFA) and promote angiogenesis in a hypoxic environment, providing tumor cells with abundant nutrients (18). Morrison demonstrated that tumor stem cells are resistant to cytotoxic T lymphocytes’ effects and can escape immune recognition and cytotoxic T cell-mediated killing by low expression of major histocompatibility complex-I (19).
TMB, as a predictor of response to immunotherapy, refers to the total number of somatic coding mutations, gene insertion, base substitutions, and deletion errors detected per million bases (20). At present, the mechanism of the prediction of TMB tumor immune response is not fully understood. It is generally believed that the higher the TMB is, the more new antigens will be produced; that is, the body’s immunogenicity will increase, allowing tumor-specific T cells to recognize the new antigens and eventually produce an immune response (21-23). Previous reports have explored the role of TMB in immunotherapy (24). In metastatic colorectal carcinoma (mCRC), TMB is an important independent biomarker for mCRC with high microsatellite instability, which can stratify the possibility of patients responding to immune checkpoint inhibitors (ICPIs) (25). In melanoma patients, high TMB may be associated with the long-term clinical benefit of ICPIs (26). In patients with breast cancer, tumors with favorable immune-infiltrate and high TMB are correlated with prolonged survival (27). Besides, many tumor samples with mismatch repair (MMR) deficient respond more strongly to immunotherapy, which may be due to their high TMB (28).
In recent years, with the development of the sequencing technique, mutation data for different tumors can be downloaded from public databases such as The Cancer Genome Atlas (TCGA) and Gene Expression Omnibus (GEO) databases. Many of these data resources were explored to identify the relationship between cancer and immune microenvironment and prognosis. However, few researchers have focused on the activity and prognosis of TMB in EC and immune cells; our study aimed to identify the prognostic role of TMB in EC.
We present the following article in accordance with the MDAR checklist (available at http://dx.doi.org/10.21037/atm-20-6049).
Methods
The study was conducted in accordance with the Declaration of Helsinki (as revised in 2013).
Multi-omics data progress and acquisition
We downloaded transcriptome data (529 EC cases, Workflow Type: HTseq-FPKM) from the TCGA database. In addition, through the Genomic Data Commons (GDC) tool, we can obtain the corresponding clinical characteristics of patients, including sex, age, tumor grade and clinical stage, and patients’ important status with follow-up.
TMB assessment and prognosis analysis in EC
In this study, TMB is defined as (total count of variants)/(the whole length of exons), in which base deletion, insertion, or substitution is considered as a variable (29). Using Practical Extraction and Report Language (Perl) scripts to run on JAVA software (30). The number of genomic changes in 529 EC patients was extracted, and the extracted TMB data were revealed in table online (https://cdn.amegroups.cn/static/public/atm-20-6049-1.pdf). The patients’ clinical information was obtained from the TCGA database (Table 1). Patients were divided into high TMB group and low TMB group according to the cutoff value of median TMB data.
Table 1. Clinical characteristic of 529 EC patients from TCGA cohort.
| Characteristics | Number of cases (%) |
|---|---|
| Age | |
| <60 years | 174 (32.89) |
| ≥60 years | 352 (66.54) |
| Not available | 3 (0.57) |
| Gender | |
| Female | 529 (100.00) |
| Race | |
| White | 361 (68.24) |
| Asian | 20 (3.78) |
| Black or Africa | 106 (20.03) |
| American Indian or Alaska native | 3 (0.57) |
| Native Hawaiian or other pacific islanders | 8 (1.51) |
| Not available | 31 (5.86) |
| Histological grade | |
| G1 | 97 (18.34) |
| G2 | 118 (22.31) |
| G3 | 305 (57.66) |
| Not available | 9 (1.70) |
| Stage | |
| I | 330 (62.38) |
| II | 51 (9.64) |
| III | 121 (22.87) |
| IV | 27 (5.10) |
| Survival status | |
| Death | 86 (16.26) |
| Survival | 443 (83.74) |
| Pathological type | |
| Endometrioid adenocarcinoma | 396 (74.86) |
| Serous cystadenocarcinoma | 111 (20.98) |
| Other types | 22 (4.16) |
EC, endometrial cancer; TCGA, The Cancer Genome Atlas.
Differential methods were selected to analyze TMB groups and pathway analysis
We used “limma” package to conduct the differentially expressed genes (DEGs) analysis with |log (fold change) >1.5| and false discovery rate (FDR) <0.05 (31). We selected the “org.Hs.eg.db” package to transferred gene symbols into Entrez ID. Using “clusterProfiler”, “ggplot2”, and “enrichplot” packages to conducted the Kyoto Encyclopedia of Genes and Genomes (KEGG) and Gene Ontology (GO) analysis of DEGs. Then, we downloaded the gene set enrichment analysis (GSEA) software and worked it on the JAVA platform. TMB data were selected as the phenotype, and then downloaded “c2.cp.kegg.v6.2.symbols.gmt gene sets” from the Molecular Signatures Database database (MSigDB).
Identifying hub TMB related signatures
We used the “survival” installation package and univariate Cox analysis to find prognostic genes DEGs with P<0.05. Then, the hub independent risk signature was identified using multivariate Cox analysis. The forest plot showed the hazard ratio (HR) of hub TMB-related genes.
CIBERSORT
First, using the “limma” package to normalized transcriptome profiles of EC patients. Next, we performed the “CIBERSORT” scripts to assess the immune compositions of EC patients (table online: https://cdn.amegroups.cn/static/public/atm-20-6049-2.xlsx) (32). We considered that the selected samples were usable when P<0.05.
Infiltrating immune cells prognostic analysis in EC
We integrated these data and calculated 22 important immune cells from 529 samples for analysis based on the immune cell survival data. Univariate Cox regression analysis was used to evaluate the prognostic value of immune cells. In high TMB and low TMB, Kaplan-Meier analysis was conducted to assess differential progression, recurrence, and survival outcomes.
Statistical analysis
Students’ t-test was conducted for continuous variables. The Chi-square test was used to study the categorical variables. The comparison between the two groups uses the Wilcoxon rank-sum test. Our data analysis was performed in R software (version 3.6.1). To assess the difference in overall survival (OS) between the two levels, we performed a Kaplan-Meier analysis with a log-rank test. At the same time, we further analyzed the relationship between several clinical variables and TMB. The Wilcoxon rank-sum test was performed to compare the clinical characteristics between the two groups, and the Kruskal-Wallis test was preferred to compare the clinical characteristics among three or more groups. Statistical significance was defined as P value <0.05.
Results
Genome-wide mutation maps in patients with EC
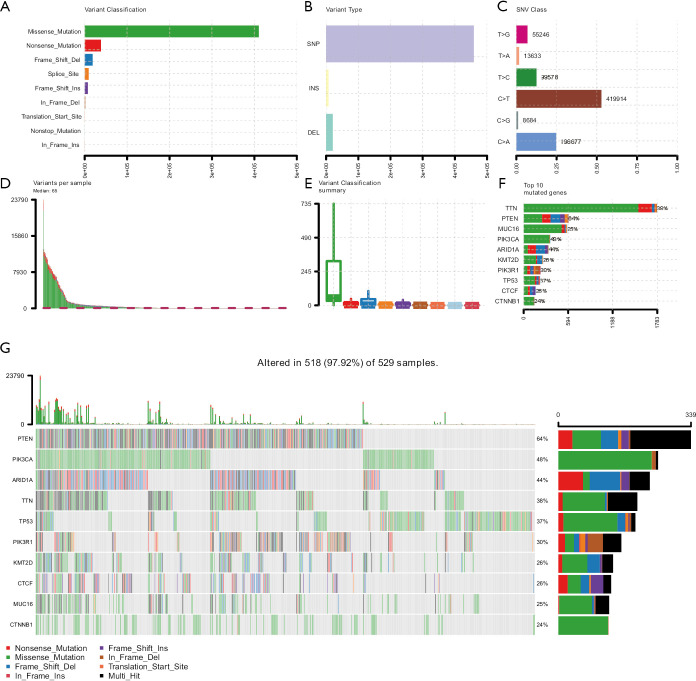
We obtained the single nucleotide mutation data for 529 EC patients from the TCGA database. Different types of mutations were classified into different groups. Missense mutations were the most common mutation types (Figure 1A). Single nucleotide polymorphism (SNP) was more frequent than insertions and deletions (Figure 1B), and C>T was the most common type of single-nucleotide variant (SNV) (Figure 1C). We also used waterfall plots to show mutation information for each gene for each patient. Then, we counted the number of base mutations in each person, and mutation types were also shown in the box plot (Figure 1D,E). The top 10 mutated signatures in EC patients exhibited a descending order in a horizontal histogram. These mutated signatures include PTEN (64%), PIK3CA (48%), ARID1A (44%), TTN (38%), TP53 (37%), PIK3R1 (30%), KMT2D (26%), CTCF (26%), MUC16 (25%), CTNNB1 (24%) (Figure 1F). Other detailed mutation information was revealed in the waterfall plot (Figure 1G). Different colors represented different types of mutations. Clinical characteristic of 529 EC patients from TCGA cohort is showed in Table 1.
Figure 1.
Tumor mutation profile in EC samples. (A) A missense mutation is the most common mutations in variant classifications. (B) Invariant types, SNP account for a larger proportion than insertion and deletion. (C) In the SNV class, C>T exhibited more frequently than other types. (D,E,F) Tumor mutation burden in each sample and top ten mutated genes in endometrial cancer. (G) The landscape of mutation in EC samples. The waterfall plot was used to show the mutation information of each gene in each sample. The different color box below the waterfall plot represents various mutation types. The barplot was conducted to show the number of mutation burden. EC, endometrial cancer; SNP, single-nucleotide polymorphism; SNV, single-nucleotide variant.
TMB was associated with survival outcome, tumor grades, and pathological types
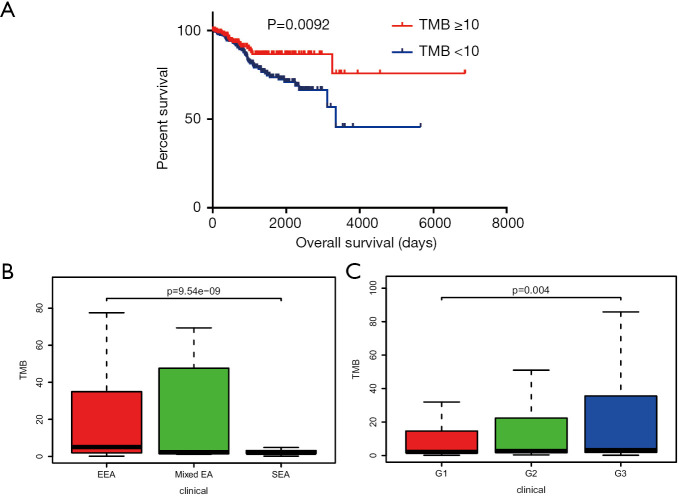
The groups were classified into the high TMB group by the chosen value of TMB ≥10 and classified into the low TMB group by the selected value of TMB <10. High TMB correlated with better prognosis days with Kaplan-Meier analysis with log-rank test (P=0.0092) (Figure 2A). We also observed that TMB in different pathological types of EC has significant differences (Figure 2B). For the correlation between tumor grade and TMB, we revealed that high-grade tumor grade with high TMB (Figure 2C).
Figure 2.
Prognostic analysis of TMB and correlation with clinical characteristics. (A) Higher TMB level indicated a better OS with P=0.0092. (B) TMB level in different pathological types with P=9.54e−09. (C) Higher TMB level associated with advanced tumor grades with P=0.004. TMB, tumor mutation burden; OS, overall survival; EEA, endometrioid endometrial adenocarcinoma; mixed EA, mixed sendometrial adenocarcinoma; SEA, serous endometrial adenocarcinoma.
Gene expression profiles in high and low TMB groups
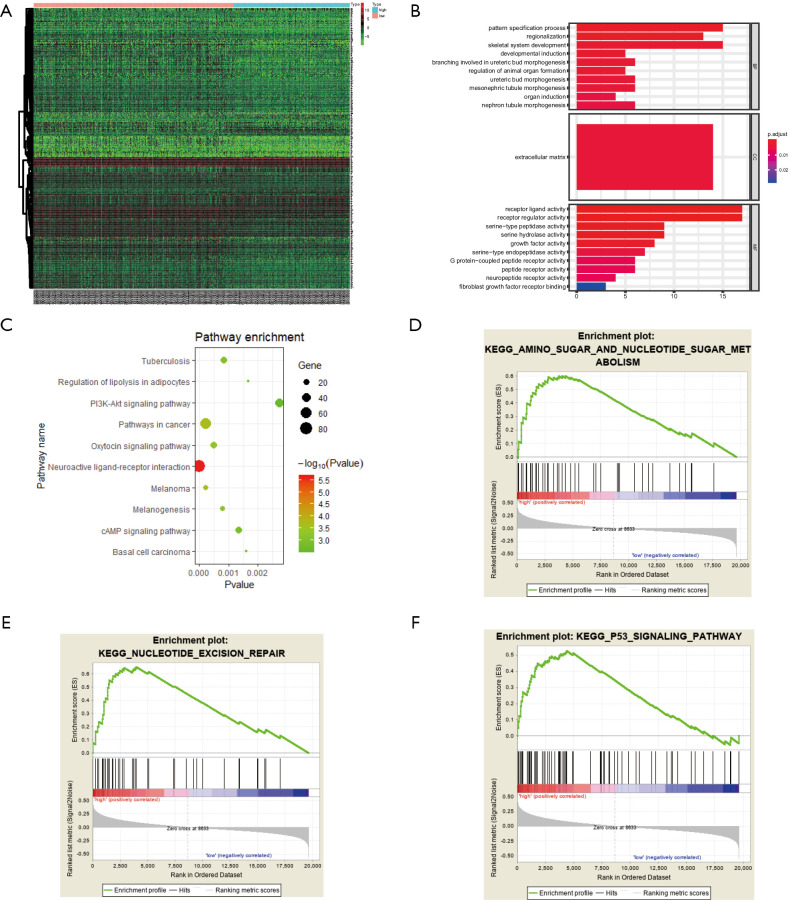
We selected the top 160 DEGs between two groups in the heatmap, where we could obtain that the in high TMB groups has decreased genome expression level (Figure 3A). Pattern specification process, regionalization, skeletal system development were enriched in the biological process. In the cellular component category, these TMB-related genes were mainly involved in the extracellular matrix. And in the molecular function group, these differential genes participated in receptor ligand activity, receptor regular activity, serine-type peptidase activity and serine hydrolase activity (Figure 3B). KEGG enriched results indicated that different genes might be correlated with other pathways (Figure 3C, Table 2). Moreover, many top GSEA results, including amino sugar and nucleotide sugar metabolism, nucleotide excision repair, or p53 signaling pathway were enriched significantly with TMB level as phenotype (Figure 3D,E,F).
Figure 3.
Enrichment analysis of differential expression genes in high TMB and low TMB groups. (A) Heatmap shows the top 160 differentially expressed genes with |log (FC) >1.5| and FDR <0.05. (B,C) GO and KEGG enriched results displayed that these differentially expressed genes may be related to tuberculosis, regulation of lipolysis in adipocytes, pattern specification process, PI3K-Akt signaling pathway, and other functional pathways. (D,E,F) GSEA showed the top TMB-related signaling axis, including amino sugar and nucleotide sugar metabolism, nucleotide excision repair, or p53 signaling pathway with FDR <0.25. TMB, tumor mutation burden; KEGG, Kyoto Encyclopedia of Genes and Genomes; GO, Gene Ontology.
Table 2. KEGG pathway analysis for differential genes.
| Description | BgRatio | P | Padjust |
|---|---|---|---|
| Neuroactive ligand-receptor interaction | 9/278 | 2.39E−06 | 0.00032 |
| Pathways in cancer | 8/397 | 0.00023 | 0.01046 |
| Melanoma | 4/71 | 0.00023 | 0.01046 |
| Oxytocin signaling pathway | 5/158 | 0.00049 | 0.16899 |
| Melanogenesis | 4/100 | 0.0008 | 0.01946 |
| Tuberculosis | 5/179 | 0.00086 | 0.01946 |
| cAMP signaling pathway | 5/199 | 0.001358 | 0.02541 |
| Basal cell carcinoma | 3/55 | 0.0016 | 0.02541 |
| Regulation of lipolysis in adipocytes | 3/56 | 0.00168 | 0.02541 |
| PI3K-Akt signaling pathway | 6/342 | 0.00273 | 0.03518 |
| Wnt signaling pathway | 4/143 | 0.00285 | 0.03518 |
| Hippo signaling pathway | 4/154 | 0.00368 | 0.0365 |
| mTOR signaling pathway | 4/154 | 0.00368 | 0.03645 |
| MAPK signaling pathway | 5/255 | 0.00387 | 0.03645 |
| JAK-STAT signaling pathway | 4/158 | 0.00403 | 0.03645 |
| ECM-receptor interaction | 3/82 | 0.00474 | 0.03699 |
| Vitamin digestion and absorption | 2/24 | 0.00475 | 0.03699 |
| Taste transduction | 3/83 | 0.0049 | 0.03699 |
| Salmonella infection | 3/86 | 0.00539 | 0.0386 |
| Protein digestion and absorption | 3/90 | 0.00609 | 0.04059 |
KEGG, Kyoto Encyclopedia of Genes and Genomes.
Identification and evaluation of 10 TMB-related signature
Based on 160 DEGs (table online: https://cdn.amegroups.cn/static/public/atm-20-6049-3.pdf), we further selected ten prognostic signatures related to TMB. The ten independent risk signatures with P<0.05 using a multivariate regression model (Figure 4). The HR, with a 95% confidence interval, was shown in the forest plot. We also plotted time-dependent ROC curves of TMB and ten genes for predicting 1-, 3-, and 5-year survival of endometrial cancer (Figure S1).
Figure 4.
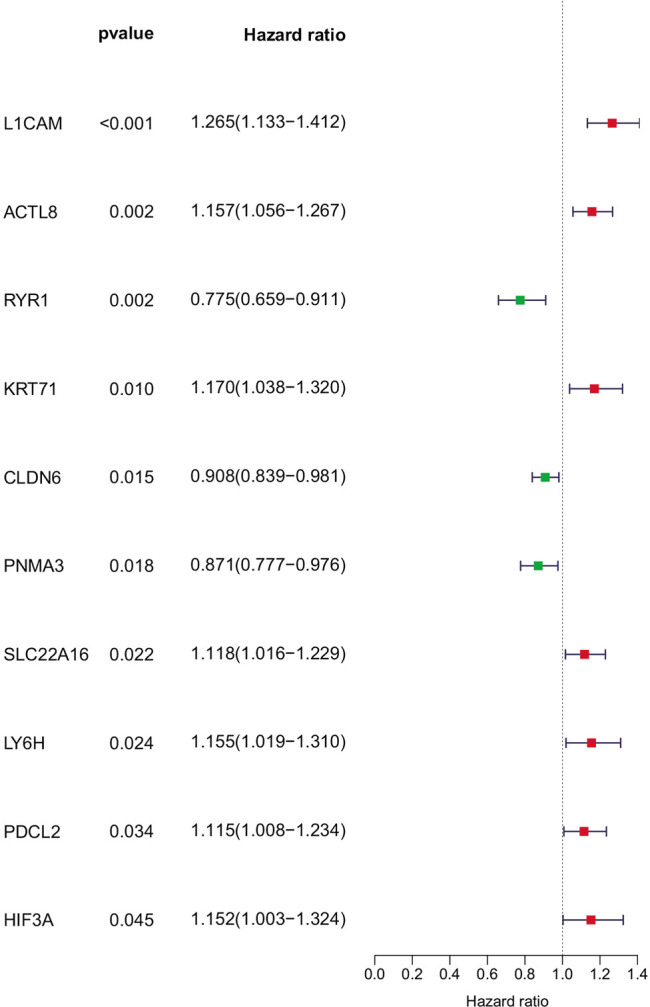
TMB-related signatures were shown in the forest plot. The multivariate Cox regression method was employed to calculate the 95% confidence interval (95% CI) of the hazard ratio for each TMB-related signature and was shown in the forest plot. TMB, tumor mutation burden.
Inferred immune cell fractions between two TMB groups
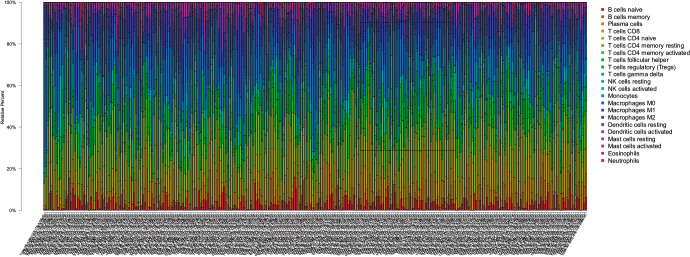
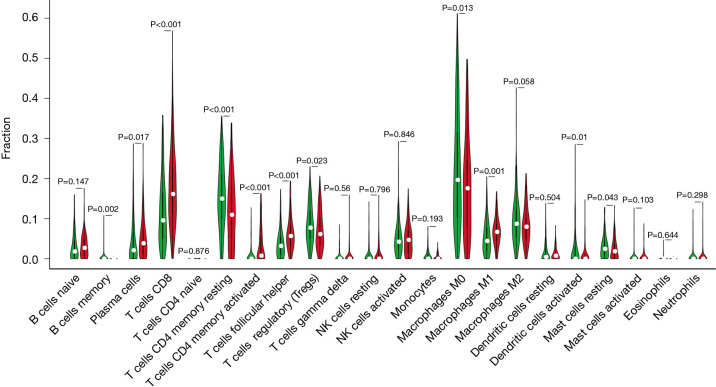
According to the CIBERSORT method, we deserved proportions of 22 immune cells in patients and showed the results in a bar plot, in which different colors represented different cell subsets (Figure 5). Moreover, we obtained that activated CD4+ T cells (P<0.001), plasma cells, and CD8+ T cells (P<0.001) exhibited higher infiltrating levels in the high TMB group by Wilcoxon rank-sum test. However, memory resting CD4+ T cell (P<0.001) and macrophages M0 (P<0.013) showed higher infiltrating levels in the low TMB group. No significant difference was found in naive B cells, resting NK cells, and activated NK cells between the high and low groups of TMB. However, T cells follicular helper is occupied more proportions (P<0.001) in the high TMB group, the total fraction of T cells follicular helper account for low component (Figure 6).
Figure 5.
The CIBERSORT algorithm summarizes the evaluation scores of 22 immune cell subtypes. In the bar plot, each bar chart represents the proportion of each immune cell in each patient. Different types of color annotations on the right represent 22 types of immune cells.
Figure 6.
Twenty-two immune cell infiltrates between low TMB and high TMB groups. The Wilcoxon rank-sum test showed that the infiltration levels of B cell memory, T cells CD8 and T cells CD4 memory resting were higher in the high TMB group than that in the low TMB group. TMB, tumor mutation burden.
Elevated T-cell subsets infiltrating density in the high TMB group revealed improved survival outcomes
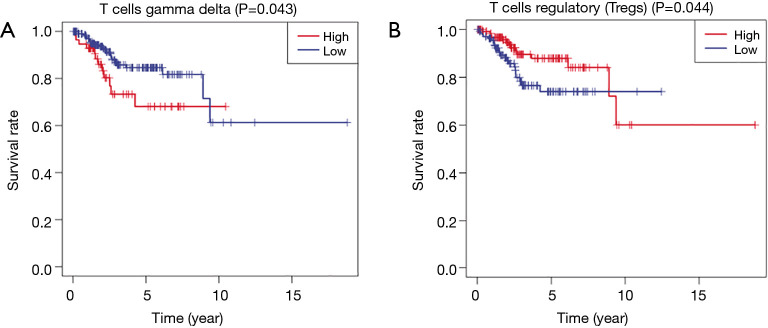
In view of the difference in the infiltration abundance of immune cells in different TMB groups, we analyzed the relationship between TMB-related immune cells and prognosis value. According to Kaplan-Meier analysis, T cells gamma delta and T cells regulatory were prognostic immune cells in EC samples. It is worth noting that T cells regulatory in the high TMB group had higher infiltrating abundance associated with improved survival rate (Figure 7).
Figure 7.
Kaplan-Meier analysis revealed that T cells’ lower infiltration level correlated with poor survival outcomes (P=0.044).
Discussion
It is well known that growing tumor tissue contains tumor-infiltrating lymphocytes (TILs), and they have no effect on tumor elimination in vivo. Still, they can exert effector functions when removed from the immunosuppressive environment (33). The immune system plays a significant role in promoting and/or suppressing tumor progression, called cancer immunoediting. The immunoediting consists of three steps: elimination, equilibrium, and escape (34). In the past few decades, significant advances have been revealed in understanding how tumors escape the immune system, which led to new approaches to reduce tumor immune escape to eliminate tumors (33).
Promising results also have been obtained in immunotherapy (35). A comprehensive combination of adaptive and innate immunotherapeutic approaches can have a potent antitumor effect in a mouse melanoma model (36). Moreover, immunotherapy has been increasingly used in lung cancer patients. Programmed cell death ligand 1 (PD-L1) as a newly found immunoregulatory molecule, interacting with its receptor, PD-1, inhibits cytotoxic immune response and exerts antitumor immune response (37-39). The emergence of ICPI has also changed some tumors’ treatment and has become a split-new standard of therapy (40,41).
Although immunotherapy has achieved encouraging results, only a small percentage of people have benefited (42). Therefore, the research aims to search for predictive biomarkers for a better immune response (43). Densities of CD8+ T cells decreased along with the tumor progresses in colorectal cancer, indicating that intratumoral immune signatures can act as potential markers predicting OS (44).
Tumor mutational burden (TMB) is a new predictive marker of the immune response; in recent years, studies have shown that there is a linear relationship between the effectiveness of PD-1 inhibitors and TMB expression in a variety of solid tumors (45). Colorectal cancer patients treated with surgery followed by chemotherapy had a better prognosis with TMB-high (46). In our study, the high TMB group is correlated with OS, tumor grades, and pathological tumor types, which is in accordance with results in some other malignancies where high TMB was prone to induce local immune recognition and bring improved prognosis (47).
In recent years, researchers have an increasing interest in immune cell infiltration in tumor immunotherapy. TILs, which play an important role in immune surveillance and killing cancer cells in the lung cancer microenvironment, mainly include tumor-infiltrating T cells, natural killer cells, and tumor-infiltrating B lymphocytes (48). MMR deficiency patients with EC showed higher levels of CD8+ T cells, Tregs, and PD-1+ immune cells (49). Patients with EC with POLE mutations and microsatellite instability have higher TILs and PD-L1 expression levels than microsatellite stable tumors (50).
We observed that, compared with the low TMB group, activated CD4+ T cell, plasma cells, and CD8+ T cell exhibited more abundant density in the high TMB group. Keane had observed that CD4+ TILs distinguished patients with different 5-year OS in diffuse large B-cell lymphoma (51). Fernández et al. found that changes in circulating inflammatory plasma-cells that can affect reality to the allergen (52). Donnem et al. reported that CD8+ TILs density has a prognostic impact on non-small cell lung cancer (53). In EC, regulatory T cells’ expression might mediate T cell immune suppression within the cancer milieu and thus correlate with EC progression (54).
Based on KEGG and GO analysis, we selected DEGs, and we further selected ten TMB-related signatures using a multivariate regression model, including ACRL8, CLDN6, HIF3A, PDCL2, KRT71, L1CAM, ACTL8, SLC22A16, RYR1, PNMA3. HIF3A is a member of the transcription regulator family of hypoxia inducible factors (HIF), and many factors can affect target genes related to inflammation, cancer, and adipose tissue dysfunction (55). Recent research has shown that HIF3A can be a prognostic marker for prostate cancer (56). And Zhang et al. revealed that upregulated HIF3A expression promotes the progression of ovarian cancer (57). CLDN6 has a lower expression level in gastric cancer patients and is associated with age, distant metastasis, lymph node metastasis, and pathological staging showing as a potential biomarker (58). ACTL8 plays a key role in the metastasis, invasion, and poor prognosis of colorectal cancer (59). Similarly, in head and neck squamous cell carcinoma, ACTL8 may serve as a potential therapeutic target and prognostic marker (60).
In the present study, the proportion of immune cells in each patient was calculated according to the CIBERSORT method, which can be more convenient and save material resources in large-scale analysis of samples. Although we have obtained some results by analyzing biological information, a larger sample size of clinical research is needed to validate TMB potential correlation with immune infiltrates. Basic experiments verifying the association between ten immune genes signature and immune infiltrates should also be taken into consideration.
Conclusions
TMB is an important prognostic factor for EC, and TMB-related genes may be potential therapeutic targets for EC.
Supplementary
The article’s supplementary files as
Acknowledgments
Funding: This work was supported by the National Natural Science Foundation of China (grant numbers 8197, 4409).
Ethical Statement: The authors are accountable for all aspects of the work in ensuring that questions related to the accuracy or integrity of any part of the work are appropriately investigated and resolved. The study was conducted in accordance with the Declaration of Helsinki (as revised in 2013).
Footnotes
Reporting Checklist: The authors have completed the Materials Design Analysis Reporting (MDAR) checklist for authors. Available at http://dx.doi.org/10.21037/atm-20-6049
Peer Review File: Available at http://dx.doi.org/10.21037/atm-20-6049
Conflicts of Interest: All authors have completed the ICMJE uniform disclosure form (Available at http://dx.doi.org/10.21037/atm-20-6049). The authors have no conflicts of interest to declare.
References
- 1.Chen W, Zheng R, Zhang S, et al. Report of cancer incidence and mortality in China, 2010. Ann Transl Med 2014;2:61. [DOI] [PMC free article] [PubMed] [Google Scholar]
- 2.Bray F, Ferlay J, Soerjomataram I, et al. Global cancer statistics 2018: GLOBOCAN estimates of incidence and mortality worldwide for 36 cancers in 185 countries. CA Cancer J Clin 2018;68:394-424. 10.3322/caac.21492 [DOI] [PubMed] [Google Scholar]
- 3.Greven KM, Randall M, Fanning J, et al. Patterns of failure in patients with stage I, grade 3 carcinoma of the endometrium. Int J Radiat Oncol Biol Phys 1990;19:529-34. 10.1016/0360-3016(90)90477-2 [DOI] [PubMed] [Google Scholar]
- 4.de Boer SM, Powell ME, Mileshkin L, et al. Adjuvant chemoradiotherapy versus radiotherapy alone for women with high-risk endometrial cancer (PORTEC-3): final results of an international, open-label, multicentre, randomised, phase 3 trial. Lancet Oncol 2018;19:295-309. 10.1016/S1470-2045(18)30079-2 [DOI] [PMC free article] [PubMed] [Google Scholar]
- 5.Junttila MR, De Sauvage FJ. Influence of tumour micro-environment heterogeneity on therapeutic response. Nature 2013;501:346-54. 10.1038/nature12626 [DOI] [PubMed] [Google Scholar]
- 6.Yang Y. Cancer immunotherapy: harnessing the immune system to battle cancer. J Clin Invest 2015;125:3335-7. 10.1172/JCI83871 [DOI] [PMC free article] [PubMed] [Google Scholar]
- 7.Brooks RA, Fleming GF, Lastra RR, et al. Current recommendations and recent progress in endometrial cancer. CA Cancer J Clin 2019;69:258-79. 10.3322/caac.21561 [DOI] [PubMed] [Google Scholar]
- 8.Morrison AH, Byrne KT, Vonderheide RH. Immunotherapy and Prevention of Pancreatic Cancer. Trends Cancer 2018;4:418-28. 10.1016/j.trecan.2018.04.001 [DOI] [PMC free article] [PubMed] [Google Scholar]
- 9.Odunsi K. Immunotherapy in ovarian cancer. Ann Oncol 2017;28:viii1-7. [DOI] [PMC free article] [PubMed]
- 10.Mellman I, Coukos G, Dranoff G. Cancer immunotherapy comes of age. Nature 2011;480:480-9. 10.1038/nature10673 [DOI] [PMC free article] [PubMed] [Google Scholar]
- 11.Wolf MT, Ganguly S, Wang TL, et al. A biologic scaffold-associated type 2 immune microenvironment inhibits tumor formation and synergizes with checkpoint immunotherapy. Sci Transl Med 2019;11:eaat7973. 10.1126/scitranslmed.aat7973 [DOI] [PMC free article] [PubMed] [Google Scholar]
- 12.de Jong RA, Kema IP, Boerma A, et al. Prognostic role of indoleamine 2,3-dioxygenase in endometrial carcinoma. Gynecol Oncol 2012;126:474-80. 10.1016/j.ygyno.2012.05.034 [DOI] [PubMed] [Google Scholar]
- 13.Moon YW, Hajjar J, Hwu P, et al. Targeting the indoleamine 2,3-dioxygenase pathway in cancer. J Immunother Cancer 2015;3:51. 10.1186/s40425-015-0094-9 [DOI] [PMC free article] [PubMed] [Google Scholar]
- 14.Kamphorst AO, Pillai RN, Yang S, et al. Proliferation of PD-1+ CD8 T cells in peripheral blood after PD-1-targeted therapy in lung cancer patients. Proc Natl Acad Sci U S A 2017;114:4993-8. 10.1073/pnas.1705327114 [DOI] [PMC free article] [PubMed] [Google Scholar]
- 15.Zuazo M, Arasanz H, Fernández-Hinojal G, et al. Functional systemic CD4 immunity is required for clinical responses to PD-L1/PD-1 blockade therapy. EMBO Mol Med 2019;11:e10293. 10.15252/emmm.201910293 [DOI] [PMC free article] [PubMed] [Google Scholar]
- 16.Binnewies M, Roberts EW, Kersten K, et al. Understanding the tumor immune microenvironment (TIME) for effective therapy. Nat Med 2018;24:541-50. 10.1038/s41591-018-0014-x [DOI] [PMC free article] [PubMed] [Google Scholar]
- 17.Pierini A, Alvarez M, Negrin RS. NK. Cell and CD4+FoxP3+ Regulatory T Cell Based Therapies for Hematopoietic Stem Cell Engraftment. Stem Cells Int 2016;2016:9025835. 10.1155/2016/9025835 [DOI] [PMC free article] [PubMed] [Google Scholar]
- 18.Zhao D, Pan C, Sun J, et al. VEGF drives cancer-initiating stem cells through VEGFR-2/Stat3 signaling to upregulate Myc and Sox2. Oncogene 2015;34:3107-19. 10.1038/onc.2014.257 [DOI] [PubMed] [Google Scholar]
- 19.Morrison BJ, Steel JC, Morris JC. Reduction of MHC-I expression limits T-lymphocyte-mediated killing of Cancer-initiating cells. BMC Cancer 2018;18:469. 10.1186/s12885-018-4389-3 [DOI] [PMC free article] [PubMed] [Google Scholar]
- 20.Samstein RM, Lee CH, Shoushtari AN, et al. Tumor mutational load predicts survival after immunotherapy across multiple cancer types. Nat Genet 2019;51:202-6. 10.1038/s41588-018-0312-8 [DOI] [PMC free article] [PubMed] [Google Scholar]
- 21.Carbone DP, Reck M, Paz-Ares L, et al. First-Line Nivolumab in Stage IV or Recurrent Non-Small-Cell Lung Cancer. N Engl J Med 2017;376:2415-26. 10.1056/NEJMoa1613493 [DOI] [PMC free article] [PubMed] [Google Scholar]
- 22.Roszik J, Haydu LE, Hess KR, et al. Novel algorithmic approach predicts tumor mutation load and correlates with immunotherapy clinical outcomes using a defined gene mutation set. BMC Med 2016;14:168. 10.1186/s12916-016-0705-4 [DOI] [PMC free article] [PubMed] [Google Scholar]
- 23.Hellmann MD, Nathanson T, Rizvi H, et al. Genomic Features of Response to Combination Immunotherapy in Patients with Advanced Non-Small-Cell Lung Cancer. Cancer Cell 2018;33:843-852.e4. 10.1016/j.ccell.2018.03.018 [DOI] [PMC free article] [PubMed] [Google Scholar]
- 24.Goodman AM, Kato S, Bazhenova L, et al. Tumor Mutational Burden as an Independent Predictor of Response to Immunotherapy in Diverse Cancers. Mol Cancer Ther 2017;16:2598-608. 10.1158/1535-7163.MCT-17-0386 [DOI] [PMC free article] [PubMed] [Google Scholar]
- 25.Schrock AB, Ouyang C, Sandhu J, et al. Tumor mutational burden is predictive of response to immune checkpoint inhibitors in MSI-high metastatic colorectal cancer. Ann Oncol 2019;30:1096-103. 10.1093/annonc/mdz134 [DOI] [PubMed] [Google Scholar]
- 26.Snyder A, Makarov V, Merghoub T, et al. Genetic basis for clinical response to CTLA-4 blockade in melanoma. N Engl J Med 2014;371:2189-99. 10.1056/NEJMoa1406498 [DOI] [PMC free article] [PubMed] [Google Scholar]
- 27.Thomas A, Routh ED, Pullikuth A, et al. Tumor mutational burden is a determinant of immune-mediated survival in breast cancer. Oncoimmunology 2018;7:e1490854. 10.1080/2162402X.2018.1490854 [DOI] [PMC free article] [PubMed] [Google Scholar]
- 28.Le DT, Uram JN, Wang H, et al. PD-1 Blockade in Tumors with Mismatch-Repair Deficiency. N Engl J Med 2015;372:2509-20. 10.1056/NEJMoa1500596 [DOI] [PMC free article] [PubMed] [Google Scholar]
- 29.Zhang C, Shen L, Qi F, et al. Multi-omics analysis of tumor mutation burden combined with immune infiltrates in bladder urothelial carcinoma. J Cell Physiol 2020;235:3849-63. 10.1002/jcp.29279 [DOI] [PubMed] [Google Scholar]
- 30.Goodswen SJ, Gondro C, Watson-Haigh NS, et al. FunctSNP: an R package to link SNPs to functional knowledge and dbAutoMaker: a suite of Perl scripts to build SNP databases. BMC Bioinformatics 2010;11:311. 10.1186/1471-2105-11-311 [DOI] [PMC free article] [PubMed] [Google Scholar]
- 31.Ritchie ME, Phipson B, Wu D, et al. limma powers differential expression analyses for RNA-sequencing and microarray studies. Nucleic Acids Res 2015;43:e47. 10.1093/nar/gkv007 [DOI] [PMC free article] [PubMed] [Google Scholar]
- 32.Newman AM, Liu CL, Green MR, et al. Robust enumeration of cell subsets from tissue expression profiles. Nat Methods 2015;12:453-7. 10.1038/nmeth.3337 [DOI] [PMC free article] [PubMed] [Google Scholar]
- 33.Drake CG, Jaffee E, Pardoll DM. Mechanisms of immune evasion by tumors. Adv Immunol 2006;90:51-81. 10.1016/S0065-2776(06)90002-9 [DOI] [PubMed] [Google Scholar]
- 34.Schreiber RD, Old LJ, Smyth MJ. Cancer immunoediting: integrating immunity's roles in cancer suppression and promotion. Science 2011;331:1565-70. 10.1126/science.1203486 [DOI] [PubMed] [Google Scholar]
- 35.Voeller J, Erbe AK, Slowinski J, et al. Combined innate and adaptive immunotherapy overcomes resistance of immunologically cold syngeneic murine neuroblastoma to checkpoint inhibition. J Immunother Cancer 2019;7:344. 10.1186/s40425-019-0823-6 [DOI] [PMC free article] [PubMed] [Google Scholar]
- 36.Rakhmilevich AL, Felder M, Lever L, et al. Effective Combination of Innate and Adaptive Immunotherapeutic Approaches in a Mouse Melanoma Model. J Immunol 2017;198:1575-84. 10.4049/jimmunol.1601255 [DOI] [PMC free article] [PubMed] [Google Scholar]
- 37.Osmani L, Askin F, Gabrielson E, et al. Current WHO guidelines and the critical role of immunohistochemical markers in the subclassification of non-small cell lung carcinoma (NSCLC): Moving from targeted therapy to immunotherapy. Semin Cancer Biol 2018;52:103-9. 10.1016/j.semcancer.2017.11.019 [DOI] [PMC free article] [PubMed] [Google Scholar]
- 38.Lastwika KJ, Wilson W, 3rd, Li QK, et al. Control of PD-L1 Expression by Oncogenic Activation of the AKT-mTOR Pathway in Non-Small Cell Lung Cancer. Cancer Res 2016;76:227-38. 10.1158/0008-5472.CAN-14-3362 [DOI] [PubMed] [Google Scholar]
- 39.Facchinetti F, Marabelle A, Rossi G, et al. Moving Immune Checkpoint Blockade in Thoracic Tumors beyond NSCLC. J Thorac Oncol 2016;11:1819-36. 10.1016/j.jtho.2016.05.027 [DOI] [PubMed] [Google Scholar]
- 40.Planchard D, Popat S, Kerr K, et al. Metastatic non-small cell lung cancer: ESMO Clinical Practice Guidelines for diagnosis, treatment and follow-up. Ann Oncol 2018;29:iv192-237. 10.1093/annonc/mdy275 [DOI] [PubMed] [Google Scholar]
- 41.Ghosh A, Barba P, Perales MA. Checkpoint inhibitors in AML: are we there yet? Br J Haematol 2020;188:159-67. 10.1111/bjh.16358 [DOI] [PMC free article] [PubMed] [Google Scholar]
- 42.Jia H, Truica CI, Wang B, et al. Immunotherapy for triple-negative breast cancer: Existing challenges and exciting prospects. Drug Resist Updat 2017;32:1-15. 10.1016/j.drup.2017.07.002 [DOI] [PubMed] [Google Scholar]
- 43.Camidge DR, Doebele RC, Kerr KM. Comparing and contrasting predictive biomarkers for immunotherapy and targeted therapy of NSCLC. Nat Rev Clin Oncol 2019;16:341-55. 10.1038/s41571-019-0173-9 [DOI] [PubMed] [Google Scholar]
- 44.Church SE, Galon J. Regulation of CTL Infiltration Within the Tumor Microenvironment. Adv Exp Med Biol 2017;1036:33-49. 10.1007/978-3-319-67577-0_3 [DOI] [PubMed] [Google Scholar]
- 45.Yarchoan M, Hopkins A, Jaffee EM. Tumor Mutational Burden and Response Rate to PD-1 Inhibition. N Engl J Med 2017;377:2500-1. 10.1056/NEJMc1713444 [DOI] [PMC free article] [PubMed] [Google Scholar]
- 46.Lee DW, Han SW, Bae JM, et al. Tumor Mutation Burden and Prognosis in Patients with Colorectal Cancer Treated with Adjuvant Fluoropyrimidine and Oxaliplatin. Clin Cancer Res 2019;25:6141-7. 10.1158/1078-0432.CCR-19-1105 [DOI] [PubMed] [Google Scholar]
- 47.Hellmann MD, Ciuleanu TE, Pluzanski A, et al. Nivolumab plus Ipilimumab in Lung Cancer with a High Tumor Mutational Burden. N Engl J Med 2018;378:2093-104. 10.1056/NEJMoa1801946 [DOI] [PMC free article] [PubMed] [Google Scholar]
- 48.Ye L, Zhang F, Li H, et al. Circulating Tumor Cells Were Associated with the Number of T Lymphocyte Subsets and NK Cells in Peripheral Blood in Advanced Non-Small-Cell Lung Cancer. Dis Markers 2017;2017:5727815. 10.1155/2017/5727815 [DOI] [PMC free article] [PubMed] [Google Scholar]
- 49.Asaka S, Yen TT, Wang TL, et al. T cell-inflamed phenotype and increased Foxp3 expression in infiltrating T-cells of mismatch-repair deficient endometrial cancers. Mod Pathol 2019;32:576-84. 10.1038/s41379-018-0172-x [DOI] [PMC free article] [PubMed] [Google Scholar]
- 50.Howitt BE, Shukla SA, Sholl LM, et al. Association of Polymerase e-Mutated and Microsatellite-Instable Endometrial Cancers with Neoantigen Load, Number of Tumor-Infiltrating Lymphocytes, and Expression of PD-1 and PD-L1. JAMA Oncol 2015;1:1319-23. 10.1001/jamaoncol.2015.2151 [DOI] [PubMed] [Google Scholar]
- 51.Sato Y, Bolzenius JK, Eteleeb AM, et al. CD4+ T cells induce rejection of urothelial tumors after immune checkpoint blockade. JCI Insight 2018;3:e121062. 10.1172/jci.insight.121062 [DOI] [PMC free article] [PubMed] [Google Scholar]
- 52.Fernández TD, Gómez E, Doña I, et al. Differential Plasma-cell evolution is linked with Dermatophagoides pteronyssinus immunotherapy response. Sci Rep 2015;5:14482. 10.1038/srep14482 [DOI] [PMC free article] [PubMed] [Google Scholar]
- 53.Donnem T, Hald SM, Paulsen EE, et al. Stromal CD8+ T-cell Density—A Promising Supplement to TNM Staging in Non-Small Cell Lung Cancer. Clin Cancer Res 2015;21:2635-43. 10.1158/1078-0432.CCR-14-1905 [DOI] [PubMed] [Google Scholar]
- 54.Bellone S, Centritto F, Black J, et al. Polymerase ε (POLE) ultra-mutated tumors induce robust tumor-specific CD4+ T cell responses in endometrial cancer patients. Gynecol Oncol 2015;138:11-7. 10.1016/j.ygyno.2015.04.027 [DOI] [PMC free article] [PubMed] [Google Scholar]
- 55.Makino Y, Cao R, Svensson K, et al. Inhibitory PAS domain protein is a negative regulator of hypoxia-inducible gene expression. Nature 2001;414:550-4. 10.1038/35107085 [DOI] [PubMed] [Google Scholar]
- 56.Bjerre MT, Strand SH, Nørgaard M, et al. Aberrant DOCK2, GRASP, HIF3A and PKFP Hypermethylation has Potential as a Prognostic Biomarker for Prostate Cancer. Int J Mol Sci 2019;20:1173. 10.3390/ijms20051173 [DOI] [PMC free article] [PubMed] [Google Scholar]
- 57.Zhang C, Liu J, Zhang Y, et al. LINC01342 promotes the progression of ovarian cancer by absorbing microRNA-30c-2-3p to upregulate HIF3A. J Cell Physiol 2020;235:3939-49. 10.1002/jcp.29289 [DOI] [PubMed] [Google Scholar]
- 58.Gao F, Li M, Xiang R, et al. Expression of CLDN6 in tissues of gastric cancer patients: Association with clinical pathology and prognosis. Oncol Lett 2019;17:4621-5. 10.3892/ol.2019.10129 [DOI] [PMC free article] [PubMed] [Google Scholar]
- 59.Han Q, Sun ML, Liu WS, et al. Upregulated expression of ACTL8 contributes to invasion and metastasis and indicates poor prognosis in colorectal cancer. Onco Targets Ther 2019;12:1749-63. 10.2147/OTT.S185858 [DOI] [PMC free article] [PubMed] [Google Scholar]
- 60.Li B, Zhu J, Meng L. High expression of ACTL8 is poor prognosis and accelerates cell progression in head and neck squamous cell carcinoma. Mol Med Rep 2019;19:877-84. [DOI] [PMC free article] [PubMed] [Google Scholar]
Associated Data
This section collects any data citations, data availability statements, or supplementary materials included in this article.
Supplementary Materials
The article’s supplementary files as


