

Abstract
Although protein synthesis is a conserved and essential cellular function, it is often regulated in a cell-type-specific manner to influence cell fate, growth and homeostasis. Most methods used to measure protein synthesis depend on metabolically labeling large numbers of cells with radiolabeled amino acids or amino acid analogs. Because these methods typically depend on specialized growth conditions, they have been largely restricted to yeast, bacteria and cell lines. Application of these techniques to investigating protein synthesis within mammalian systems in vivo has been challenging. The synthesis of O-propargyl-puromycin (OP-Puro), an analog of puromycin that contains a terminal alkyne group, has facilitated the quantification of protein synthesis within individual cells in vivo. OP-Puro enters the acceptor site of ribosomes and incorporates into nascent polypeptide chains. Incorporated OP-Puro can be detected through a click-chemistry reaction that links it to a fluorescently tagged azide molecule. In this protocol, we describe how to administer OP-Puro to mice, obtain cells of interest (here, we use bone marrow cells) just 1 h later, and quantify the amount of protein synthesized per hour by flow cytometry on the basis of OP-Puro incorporation. We have used this approach to show that hematopoietic stem cells (HSCs) exhibit an unusually low rate of protein synthesis relative to other hematopoietic cells, and it can be easily adapted to quantify cell-type-specific rates of protein synthesis across diverse mammalian tissues in vivo. Measurement of protein synthesis within bone marrow cells in a cohort of six mice can be achieved in 8–10 h.
Introduction
Protein synthesis has long been thought of as a housekeeping process that is performed similarly by most cells. This is because traditional assays used to measure protein synthesis require metabolic labeling of large numbers of cultured cells or depend on analyzing entire organs or tumors1-4. Thus, measurement of protein synthesis has typically been done without regard to cell-type-specific differences in protein synthesis and has not been tractable for studying rare cells that cannot be maintained in vitro, such as somatic stem cells5. To circumvent this roadblock, a strategy based on the use of OP-Puro (Fig. 1) to label nascent polypeptide chains was developed to quantify protein synthesis within single cells in vivo6,7.
Fig. 1 ∣. Molecular structure of OP-Puro.
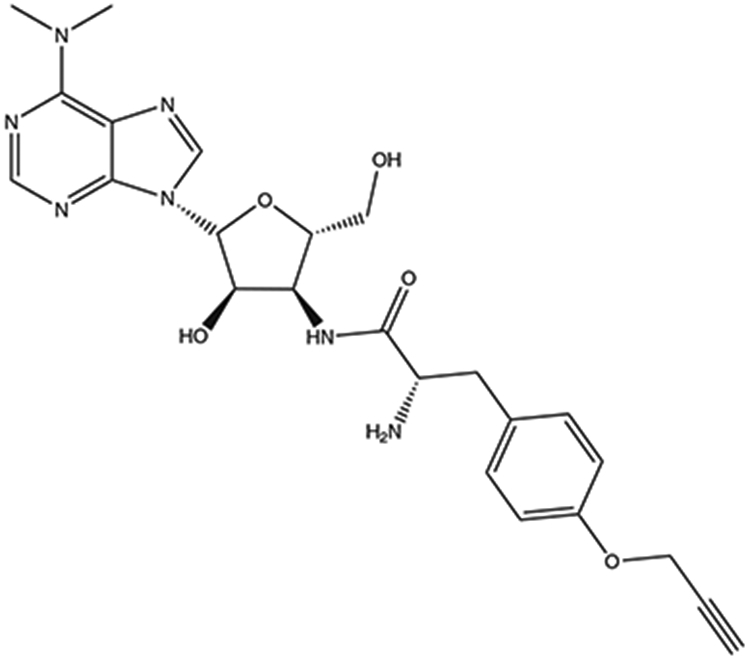
OP-Puro is an analog of puromycin with a terminal alkyne group.
OP-Puro is an analog of puromycin that contains a terminal alkyne group6. Similar to puromycin, OP-Puro is an aminoacyl-tRNA analog that enters the acceptor site of ribosomes, is incorporated into nascent polypeptide chains and halts translation elongation. Incorporated OP-Puro can be detected by performing an azide–alkyne cycloaddition, a type of click-chemistry reaction8 that covalently links it to a fluorescently tagged azide molecule. OP-Puro can be administered directly to tissue culture cells, intact tissues and whole organisms, including mice. 1 h after administration, cells can be obtained, and the amount of protein synthesized per hour in individual cells in vivo can be assessed by fluorescence microscopy6 or quantified by flow cytometry on the basis of OP-Puro incorporation7,9.
Overview of the procedure
In this article, we provide a detailed protocol for assessing overall protein synthesis within single cells in adult tissues on the basis of quantification of OP-Puro incorporation by flow cytometry (see Fig. 2 for a schematic summary of the Procedure). We exemplify our approach by studying HSCs and restricted myeloid progenitors, but this protocol can be adapted to investigate other types of hematopoietic or non-hematopoietic cells isolated from distinct tissues. Depending on the cell type of interest, moderate to advanced flow cytometric expertise may be required.
Fig. 2 ∣. Overview of key steps in the procedure to measure protein synthesis in vivo on the basis of OP-Puro incorporation.

OP-Puro is administered directly to mice via an i.p. injection (49.5 mg/kg; Steps 3–5). Exactly 1 h after injection, the mice are euthanized and the cells of interest (in this case, bone marrow cells) are obtained (Steps 6–24). Isolated cells are immunostained with a cocktail of antibodies against cell-surface proteins that enable detection of cell types of interest, in this case HSCs and restricted myeloid progenitor cells (CMPs/GMPs/MEPs; Steps 25–33). Appropriate single-color controls must be made (Steps 26 and 30). After immunostaining, cells are fixed and permeabilized before an azide–alkyne cycloaddition is performed to fluorescently label peptides with incorporated OP-Puro (Steps 34–49). Finally, OP-Puro incorporation is assessed by flow cytometry, and the MFI of OP-Puro in each cell is used as a relative measurement of protein synthesized per hour (Steps 50–65). BM, bone marrow.
Briefly, an 8—12-week-old C57BL/6 mouse is administered an i.p. injection of OP-Puro (49.5 mg/kg; Steps 3 and 4). A control mouse is injected with vehicle only (Step 5). Exactly 1 h later, the mice are sacrificed, and bone marrow is rapidly extracted by flushing the femurs and tibias from each mouse with a needle and syringe (Steps 6–20). Equal numbers of cells are then immunostained with a combination of antibodies against cell-surface antigens to identify the cell type of interest (Steps 25–33). In our example, these are CD150+CD48−Lineage−Sca-1+ckit+ (CD150+CD48−LSK) HSCs10, CD34+CD16/32−/lowCD127−Lineage−Sca-1−ckit+ common myeloid progenitors (CMPs)11, CD34+CD16/32hlghCD127−Lineage−Sca-1−ckit+ granulocyte macrophage progenitors (GMPs)11 and CD34−CD16/32−/lowCD127−Lineage−Sca1−c-kit+ megakaryocyte erythroid progenitors (MEPs)11. Following immunostaining, cells are fixed and permeabilized (Steps 34–40). Finally, a click-chemistry reaction is performed in order to covalently attach an Alexa Fluor 555 (AF555)–azide molecule to OP-Puro that has been incorporated into newly synthesized peptides (Steps 41–47). After a final wash step, cells are incubated with DAPI to enable more precise data acquisition by distinguishing cells from debris (Steps 48 and 49). DAPI staining also enables dividing cells to be distinguished from non-dividing cells on the basis of DNA content7. Finally, cells are analyzed by flow cytometry, and the relative amount of protein synthesized over the 1-h labeling period is quantified on the basis of the mean fluorescence intensity (MFI) of OP-Puro within defined cell types at the population level or at single-cell resolution7 (Steps 50–65).
Applications of the method
We initially used OP-Puro in combination with cell-surface immunostaining to compare protein synthesis rates among HSCs, restricted hematopoietic progenitors and terminally differentiated blood cells in the bone marrow of adult mice7. We discovered that HSCs exhibit an unusually low rate of protein synthesis that is essential for their maintenance and regenerative activity7,9. Importantly, this does not simply reflect HSC quiescence, as dividing HSCs also have lower rates of protein synthesis as compared to dividing restricted progenitors7. Using this assay, other groups subsequently showed that stem cells in multiple other tissues also have relatively low rates of protein synthesis, indicating that this is a broadly conserved feature of somatic stem cells12-15. OP-Puro has also been used by diverse groups of researchers to identify cell-type-specific differences in protein synthesis in normal and malignant tissue, and to test how environmental and genetic interventions influence protein synthesis rates in vivo and in vitro16-30. This assay has demonstrated the potential to open up new areas of cellular investigation and can be of broad use to the research community investigating protein synthesis in cell culture, organoids, and intact tissues or within whole organisms. Indeed, cell-type-specific differences in protein synthesis regulate normal development, tissue homeostasis, and stress responses, and are dysregulated in a number of malignant and non-malignant human diseases5.
OP-Puro can also be used to optimize biosynthetic processes. For example, when mammalian cells are used to produce monoclonal antibodies, OP-Puro can be used to identify clones with high protein synthesis rates, which are subsequently more likely to produce higher antibody titers19. This example demonstrates that OP-Puro’s utility can be extended from research applications to biotechnology, and raises the possibility that it could also be extended to clinical diagnostics.
Limitations
Although OP-Puro is a powerful tool that enables the quantification of protein synthesis within single cells in vivo, it also has some experimental limitations. OP-Puro detection requires cells to be fixed and permeabilized, which precludes the possibility of isolating live cells on the basis of their rate of protein synthesis. Fixation and permeabilization also reduce the quality of cell-surface immunostaining, making it more difficult to resolve specific populations of cells. This is exacerbated by the click-chemistry reaction used to detect OP-Puro incorporation, because it quenches phycoerythrin (PE) and PE-conjugated dyes (e.g., PE-Cy7). This can further limit the number of antibodies used for immunostaining and complicates the detection of certain antigens. In addition, cell-type-specific differences in protein synthesis can be investigated only among cell populations that have defined markers that facilitate their identification.
Another limitation of OP-Puro is that its incorporation into nascent polypeptides halts translation elongation and leads to the generation of truncated peptides/proteins that can be targeted for degradation. Through a series of experiments, we and others determined that peak OP-Puro incorporation is detected 1 h after administration6,7. As a consequence, we recommend adherence to the 1-h OP-Puro treatment in order to maximize detection and minimize the influence of differences in degradation activity that could exist between cell types9. This means that this approach can be used for only relatively short times and not for analyzing protein synthesis over longer time courses. Although we do not detect any cellular or molecular changes indicative of cell stress in hematopoietic cells 1 h after OP-Puro administration in vivo7, we refrain from using cells from OP-Puro-treated mice for other types of experiments in order to prevent the introduction of a potentially confounding variable.
Our data strongly suggest that there are no major differences in uptake of OP-Puro among different hematopoietic cell types in adult bone marrow, and that differences in OP-Puro incorporation reflect biological differences in protein synthesis7. However, there could be significant differences in perfusion or uptake of OP-Puro across different tissues. For example, i.p. administration of OP-Puro does not lead to significant labeling in the brain, suggesting that it may not efficiently cross the blood–brain barrier. However, this can be overcome by intraventricular administration of OP-Puro15. In addition, mice or cells that express a puromycin resistance gene do not substantially incorporate OP-Puro because it is converted to a biologically inactive form when it is N-acetylated31. Thus, in the absence of appropriate validation, caution is advised when comparing rates of protein synthesis between cells residing in different tissues.
Alternative methods
There are several alternative methods available that can be used to measure protein synthesis in vivo. The key approaches are discussed in this section, and we provide a comparative description of these methods in Table 1.
Table 1 ∣.
Comparison of different methods to measure protein synthesis
| Technique | Tag | Cell culture | In vivo | Cell-type specificity |
References |
|---|---|---|---|---|---|
| Radiolabeled amino acid labeling | Radiolabeled amino acids (e.g., 35S-methionine) | Yes. Methionine-free conditions | No | No | Esposito & Kinzy32, Schick33 |
| FUNCAT | Non-canonical amino acids (e.g., HPG, AHA) | Yes. Methionine-free conditions | Yes. Specialized chow free of methionine and containing non-canonical amino acids or very high doses of amino acid analogs | Yes | Dieterich et al.36 |
| BONCAT | Non-canonical amino acids | Yes. Methionine-free conditions | Yes. Specialized chow free of methionine and containing non-canonical amino acids | No | Dieterich et al.37,38 |
| QuaNCAT | Non-canonical amino acids | Yes. Methionine-free conditions | Yes. Specialized chow free of methionine and containing non-canonical amino acids | No | Howden et al.39 |
| OP-Puro | O-propargyl-puromycin | Yes | Yes | Yes | Liu et al.6, Signer et al.7 |
| SUnSET | Puromycin | Yes | Yes, but it can be applied to only some cell types | Yes | Goodman & Hornberger42, Schmidt et al.43, Goodman et al.44 |
| PUNCH-P | Biotinylated-puromycin | Yes | No. Tissues can be labeled ex vivo | No | Aviner et al.45 |
| SILAC | Isotopes | Yes | Yes. Administration of radiolabeled amino acids | No | Ong et al.46, Ong & Mann47, Kruger et al.48 |
The most commonly used assay to measure protein synthesis entails metabolically labeling cells with radiolabeled amino acids, such as 35S-methionine, for a fixed period of time32,33. After the labeling period, cells are lysed, total protein is precipitated, and the amount of protein synthesized over the labeling period can be quantified by autoradiography. One major disadvantage of this assay is that protein synthesis must be quantified within the bulk labeled cell population and lacks cell type specificity.
Over the past decade, several new assays have been developed to study protein synthesis at cell-type-specific resolution. For example, in the approach described above, 35S-methionine can be replaced with the non-radioactive methionine analogs l-homopropargylglycine (HPG) or l-azidohomoalanine (AHA)34,35. HPG and AHA contain an alkyne or azide moiety, respectively, and their incorporation into newly synthesized proteins can be detected by a click-chemistry reaction8 that covalently binds HPG and AHA to a fluorescently tagged molecule7. This method, referred to as fluorescent non-canonical amino acid tagging (FUNCAT)36, enables protein synthesis quantification with cell-type-specific resolution using fluorescence microscopy or flow cytometry7,36. Alternatively, click-chemistry labeling of newly synthesized proteins labeled with HPG or AHA with an azide- or alkyne-conjugated biotin (bio-orthogonal non-canonical amino acid tagging (BONCAT)) enables purification of de novo labeled proteins with streptavidin beads for biochemical or proteomic analyses37,38. BONCAT has also been combined with stable isotope labeling with amino acids in cell culture (SILAC) and mass spectrometry to enable quantitative non-canonical amino acid tagging (QuaNCAT)39. This methodology enables quantification of proteomic changes during complex biological processes. Although these analytical proteomic techniques facilitate the measurement of synthesis rates of specific proteins, they are restricted to large numbers of cultured cells and usually can detect only a subset of the most highly expressed proteins. Whereas methionine analogs can be used to robustly measure global protein synthesis, they are significantly limited by their inability to compete with endogenous methionine, which often restricts their use to methionine-free conditions. Although methionine-free conditions are tractable for cell-free experiments, some types of cell culture, or within cultured organisms such as yeast, they are extremely difficult to orchestrate within mammalian systems in vivo because they require long-term maintenance on specialized methionine-free diets. One recent study demonstrated proteomic labeling with AHA and HPG in developing mice in vivo, but it required large amounts of the non-canonical amino acid analogs to be administered over a 2-d period34.
Another approach for quantifying protein synthesis within specific cell types involves the use of engineered aminoacyl-tRNA synthetases40. These mutant aminoacyl-tRNA synthetases specifically charge non-canonical amino acids that are not otherwise charged by endogenous aminoacyl-tRNA synthetases. This type of approach restricts labeling of newly synthesized proteins within specific cell types that express the mutant aminoacyl-tRNA synthetase. The broad use of this approach, however, is limited by the requirement to use transgenic cells or animals that express the mutant aminoacyl-tRNA synthetase.
Puromycin is also commonly used to study translation. Puromycin is an aminoacyl-tRNA analog that incorporates into the C terminus of nascent polypeptides during translation. Puromycin incorporation halts translation elongation and induces subsequent release of puromycylated peptides from the ribosome41. Unlike radiolabeled amino acids and non-canonical amino acid analogs, puromycin incorporation is not significantly influenced by the endogenous methionine concentration nor the methionine content of proteins. Puromycin is thus tractable for in vivo labeling and incorporates relatively equally into all nascent polypeptides41, making it a reliable tool for measuring global protein synthesis.
Puromycylated peptides can be detected within fixed cells with an anti-puromycin antibody. However, quantification of protein synthesis by antibody-mediated detection of puromycylated peptides is obfuscated by non-specific binding of the anti-puromycin antibody to other proteins. As compared to OP-Puro, anti-puromycin-mediated quantification of protein synthesis within hematopoietic stem and progenitor cells offers somewhat similar results at a significant cost saving (Supplementary Fig. 1). In both cases, HSCs exhibit much less protein synthesis than CMPs, GMPs or MEPs. Furthermore, the MFIs of OP-Puro and puromycin (detected by anti-puromycin antibody) are statistically indistinguishable in HSCs, CMPs and MEPs. One significant difference, however, is that OP-Puro incorporation within mouse bone marrow cells exhibits a bimodal distribution, whereas with the anti-puromycin antibody, the distribution is unimodal (Supplementary Fig. 1). Including a DNA dye in the analysis showed that the second (higher) peak of OP-Puro incorporation encompasses mostly dividing cells in the S/G2/M phases of the cell cycle (>2n DNA content)7. The absence of this second peak suggests that the antibody-mediated approach has less resolution than OP-Puro for detecting small differences in protein synthesis. The use of the higher-resolution OP-Puro method could offer significant advantages in detecting small differences in protein synthesis, which is important because small changes in protein synthesis can have large biological consequences7,9.
At least some puromycylated peptides are trafficked to the cell surface, where they can also be detected42,43. This surface sensing of translation (SUnSET) method allows the monitoring and quantification of global protein synthesis in individual mammalian cells by immunofluorescence or flow cytometry43,44. Although SUnSET serves as a reasonable surrogate for protein synthesis in some cell types, comparison across cell types could be skewed by cell-type-specific differences in cell trafficking, cell-surface protein abundance and cell membrane composition. We have been unable to detect puromycylated proteins on the surface of adult mouse bone marrow cells (Supplementary Fig. 2), suggesting that SUnSET may not be appropriate for quantifying protein synthesis within all cell types in vivo.
Puromycin can also be used in combination with proteomics. Nascent polypeptides can be tagged with a biotin-conjugated puromycin, enriched by streptavidin affinity purification, and quantified by mass spectrometry in a method (puromycin-associated nascent chain proteomics (PUNCH-P))45 similar to BONCAT and QuanCAT.
Experimental design
Adaptations for other experimental systems
This protocol can be adapted to investigate other types of hematopoietic cells in the bone marrow, as well as hematopoietic and non-hematopoietic cell types in other tissues. When adapting this protocol, it is important to first optimize conditions for cell extraction and immunostaining, as live cells should be kept on ice or at 4 °C as much as possible in order to prevent degradation of OP-Puro-containing peptides6,7. In addition, specific combinations of antibodies and fluorophores used to identify cell types of interest should be validated for compatibility with fixation, permeabilization and the click-chemistry reaction.
Although hematopoietic cells described in this protocol are identified through cell-surface immunostaining, it is also possible to identify specific cell types via intracellular staining. In this case, immunostaining would follow, rather than precede, fixation and permeabilization. Some additional optimization may be required on the basis of the specific cell type of interest.
One major consideration is the abundance of the cell type of interest in which protein synthesis is being assessed. HSCs are extremely rare cells in vivo, as they constitute <0.01% of young adult mouse bone marrow cells10. As a consequence, it is necessary to stain and record enough flow cytometric events to obtain reliable and statistically relevant data. For HSCs, we stain 4 × 10⁶ bone marrow cells and acquire at least 106 cells by flow cytometry (~100 HSCs). For comparisons across cell types, we strongly recommend staining equal numbers of cells. However, the number of cellular events recorded by the flow cytometer can be reduced for more abundant cell populations.
In this protocol, OP-Puro is administered by i.p. injection to measure protein synthesis in bone marrow cells. This administration route is also effective for analysis of protein synthesis in other tissues, including the small intestine, skeletal muscle, skin, spleen and liver6,7,12,14,26. As discussed above, alternative routes of administration may be required for analysis of some tissues, such as the brain15. These variations may require additional technical expertise and/or time as compared to our protocol. It may be necessary to adjust the dose of OP-Puro based on species, strain and tissue of interest. In addition, hematopoietic tissues are typically dissociated mechanically, and technical considerations should be taken into account for tissues that require enzymatic dissociation. Overall, for major variations, we recommend optimization of specific experimental conditions.
Controls and sample size
A mouse injected with vehicle (PBS) only (no-OP-Puro control) is used to establish the level of background fluorescence. Control samples should go through all steps described in the protocol (cell-surface immunostaining, fixation, permeabilization and click-chemistry reaction) to account for any potential changes in fluorescence that may be induced by these steps or reagents. When using tandem antibodies (e.g., PerCp-Cy5.5), the photon transfer efficiency from donor to acceptor in tandem pairs is slightly different each time the conjugation chemistry is performed, thus resulting in spectral overlap values that can vary from batch to batch. Because compensation controls should have the same spectral characteristics as the conjugated antibodies used in the experiment, a conjugated-antibody lot of a particular tandem dye will need its own compensation control. Although we have confirmed the stability of PerCp-Cy5.5 and APC-eFluor 780 tandem antibodies, special care should be taken when using formaldehyde-based fixatives along with tandem antibodies, because their stability can be compromised. Similar considerations and optimization should be implemented when combining OP-Puro detection within cells expressing fluorescent reporter transgenes.
Single-fluorophore controls are necessary to properly set the parameters and compensation on the flow cytometer. Bone marrow cells from the vehicle-treated mouse should be used to prepare these controls, with the exception of AF555. To make the AF555 control, bone marrow cells from a PBS and OP-Puro-treated mouse should be mixed into the same tube. This mixture ensures a negative and a positive cell population for AF555 (OP-Puro) for proper compensation. The click-chemistry reaction should be performed on the AF555 single-color control, but not the other single-color controls.
OP-Puro should be administered to each mouse at intervals that enable sufficient time to euthanize mice and obtain cells exactly 1 h after injection. Hence, the number of mice analyzed within the same experiment may be limited by these constraints. To produce meaningful statistical results, a minimum of three mice per experimental group should be used.
It is important to note that there can be significant variation in the intensity of OP-Puro fluorescence from day to day. Several factors may contribute to this variation, including reaction efficiency, reagent freshness, light exposure and flow cytometer laser intensity. This can complicate comparison of samples across different experiments. Thus, when comparing protein synthesis rates under different conditions or between animals, it is best to test all experimental groups side by side on the same day. Subsequently, after multiple independent experiments have been performed on different days, it may be necessary to have a baseline for normalization or to use paired statistical tests to overcome technical variability that could obfuscate significant differences in protein synthesis7.
Materials
Biological materials
Mice. We optimized the technique with C57BL/6 mice between 8 and 12 weeks of age, although we have used it effectively in mice ranging from postnatal day 0 to 24 months. Data shown in this article were obtained with 8-week-old C57BL/6J mice (Jackson Laboratories, stock no. 000664) ! CAUTION All animal experiments should be performed according to relevant guidelines and regulations. All procedures in this protocol involving mice were approved by the UC San Diego Institutional Animal Care and Use Committee.
Reagents
O-propargyl-puromycin (OP-Puro; Medchem Source) ▲ CRITICAL OP-Puro is custom-synthesized and shipped as a white powder that should be kept at 4 °C. Once reconstituted in PBS (10 mM), OP-Puro should be divided into aliquots and stored at −20 °C for up to 24 months. OP-Puro aliquots can be frozen and thawed at least twice.
Ca2+- and Mg2+-free PBS (1×; Corning, cat. no. 21-040-CV)
Hydrochloric acid (HCl; 12 N solution; Fisher, cat. no. NC9720218) ! CAUTION HCl causes severe skin burns and eye damage; it is toxic if inhaled. Use in a fume hood and wear personal protective equipment (lab coat, gloves and eye/face protection) when handling this chemical. Wash face, hands and any exposed skin thoroughly after handling.
Sodium hydroxide (NaOH; 10 N solution; Fisher, cat. no. SS267) ! CAUTION NaOH causes skin irritation and serious eye damage, and may cause respiratory irritation. Use in a fume hood and wear personal protective equipment when handling this chemical. Wash face, hands and any exposed skin thoroughly after handling.
Ethanol absolute, anhydrous (VWR, cat. no. 89125-186) ! CAUTION Ethanol liquid and vapor is highly flammable. Keep away from heat, sparks, open flames and hot surfaces.
Ca2+- and Mg2+-free Hank’s Balanced Salt Solution (HBSS; 1×; Corning, cat. no. 21-022-CV)
Heat-inactivated bovine serum (Gibco, cat. no. 26170-043) ▲ CRITICAL Store at −20 °C for up to 12 months. Store thawed at 4 °C for a maximum of 4 weeks.
Trypan blue solution (0.4% (wt/vol) in PBS; Corning, cat. no. 25-900-CI) ! CAUTION Trypan blue is suspected of causing cancer. Wear protective personal equipment when handling. Collect all trypan blue-containing solutions for disposal according to institutional guidelines.
FBS (Life Technologies, cat. no. 16000044) ▲ CRITICAL Store at −20 °C in 50-ml or 5-ml aliquots for up to 12 months. Store thawed FBS at 4 °C for a maximum of 1 week.
Saponin (Sigma, cat. no. 47036) ! CAUTION Saponin causes serious eye irritation and may cause respiratory irritation. Avoid breathing dust, fumes, gas, mist, vapors and/or spray. When handling, wear eye/face protection and wash skin thoroughly after handling.
Paraformaldehyde solution (PFA; 4% (wt/vol) in PBS; Affymetrix, cat. no. 19943) ! CAUTION PFA causes mild skin irritation and serious eye damage, and may cause an allergic skin reaction. It is suspected of causing genetic defects and may cause cancer and damage to organs. When handling, wear personal protective equipment. Avoid breathing dust, fumes, gas, mist, vapors and/or spray.
Click-iT Cell Reaction Buffer Kit (Thermo Fisher Scientific, cat. no. C10269) ▲ CRITICAL Store at 4 °C.
Alexa Fluor 555 azide (AF555; Thermo Fisher Scientific, cat. no. A20012) ▲ CRITICAL Store at −20 °C; protect from light.
Dimethyl sulfoxide (DMSO; Sigma, cat. no. D2650) ! CAUTION DMSO is a combustible liquid. Keep away from heat, sparks, open flames, and hot surfaces. DMSO is rapidly absorbed through skin; therefore, personal protective equipment must be used when handling it.
DAPI (Thermo Fisher Scientific, cat. no. 62247) ▲ CRITICAL Store at 4 °C; protect from light.
Antibodies
▲ CRITICAL The antibodies listed below are specific to isolating HSCs, CMPs, GMPs and MEPs from adult mouse bone marrow. The appropriate antibody mixes should be determined for the cell type of interest (see Experimental design).
Anti-CD3-FITC (fluorescein isothiocyanate; BioLegend, cat. no. 100204, clone 17A2) ▲ CRITICAL Store at 4 °C for up to several months; protect from light.
Anti-CD4-FITC (BioLegend, cat. no. 100406, clone GK1.5) ▲ CRITICAL Store at 4 °C for up to several months; protect from light.
Anti-CD5-FITC (BioLegend, cat. no. 100606, clone 53-7.3) ▲ CRITICAL Store at 4 °C for up to several months; protect from light.
Anti-CD8-FITC (eBioscience, cat. no. 11-0081-85, clone 53-6.7) ▲ CRITICAL Store at 4 °C for up to several months; protect from light.
Anti-Gr1-FITC (BioLegend, cat. no. 108406, clone RB6-8C5) ▲ CRITICAL Store at 4 °C for up to several months; protect from light.
Anti-CD11b-FITC (eBioscience, cat. no. 11-0112-85, clone M1/70) ▲ CRITICAL Store at 4 °C for up to several months; protect from light.
Anti-Ter119-FITC (BioLegend, cat. no. 116206, clone TER-119) ▲ CRITICAL Store at 4 °C for up to several months; protect from light.
Anti-CD45R(B220)-FITC (eBioscience, cat. no. 11-0452-85, clone RA3-6B2) ▲ CRITICAL Store at 4 °C for up to several months; protect from light.
Anti-CD48-FITC (BioLegend, cat. no. 103404, clone HM48-1) ▲ CRITICAL Store at 4 °C for up to several months; protect from light.
Anti-CD127-FITC (BioLegend, cat. no. 135008, clone A7R34) ▲ CRITICAL Store at 4 °C for up to several months; protect from light.
Anti-CD117(ckit)-APC-eFluor 780 (eBioscience, cat. no. 47-1171-82, clone 2B8) ▲ CRITICAL Store at 4 °C for up to several months; protect from light.
Anti-Sca1-PerCpCy5.5 (eBioscience, cat. no. 45-5981-82, clone D7) ▲ CRITICAL Store at 4 °C for up to several months; protect from light.
Anti-Sca1-APC (eBioscience, cat. no. 17-5981-82, clone D7) ▲ CRITICAL Store at 4 °C for up to several months; protect from light.
Anti-CD150-APC (BioLegend, cat. no. 115910, clone TC15-12F12.2) ▲ CRITICAL Store at 4 °C for up to several months; protect from light.
Anti-CD34-AF700 (eBioscience, cat. no. 56-0341-82, clone RAM34) ▲ CRITICAL Store at 4 °C for up to several months; protect from light.
Anti-CD16/32-PerCpCy5.5 (BioLegend, cat. no. 101324, clone 93) ▲ CRITICAL Store at 4 °C for up to several months; protect from light.
Equipment
pH Meter (Sartorius benchtop meters, pHBasic series; Fisher Scientific, cat. no. 14558065)
Analytical weighing balance (Sartorius, model. no. QUINTIX2241S)
Stir plate (e.g., Corning, model no. PC-420D)
Stir bar (e.g., 1.5 × 0.38-inches; Fisher Scientific)
0.5-ml Sterile insulin syringes, 28-gauge (BD Biosciences, cat. no. 329465)
3-ml Sterile syringes (BD Biosciences, cat. no. 309657)
20-ml Sterile syringes (BD Biosciences, cat. no.302830)
23-gauge Sterile needles (BD Biosciences, cat. no. 305145)
0.20-μm Sterile syringe filters (Corning, cat. no. 431219)
Surgical scissors (straight sharp/sharp; Fine Science Tools, cat. no. 14060-10)
Forceps (serrated/curved; Fine Science Tools, cat. no. 11051-10)
Stainless steel disposable scalpels (Integra Miltex, cat. no. 4-410)
Petri dishes (60 × 15 mm; Corning, cat. no. 351007)
14-ml Falcon tubes (Corning, cat. no. 352059)
Centrifuge for 50-ml, 15-ml and 5-ml tubes (Thermo Scientific, model no. Sorvall Legend XTR TX-1000PKG TC 40/88)
Hemocytometer (Hausser Scientific, cat. no. 491074)
Inverted contrasting tissue culture microscope (Olympus, model no. CK2)
Pipettes (Eppendorf; Discovery Scientific Solution, model nos. 2, 20, 200, 1000)
Pipette tips (10, 200, 100 μl; Corning)
Pipetboy (Drummond Scientific, cat. no. 4-000-101)
1.5-ml Tubes (Corning, cat. no. MCT-150-C-S)
Serological pipettes (5, 10 and 25 ml; Corning)
500-ml Vacuum filter/storage bottle system (0.22-μm pore size; Corning, cat. no. 431097)
Flow cytometer (BD Biosciences, model no. LSR II)
5-ml FACS tubes (Fisher Scientific, cat. no. 149595)
Software
▲ CRITICAL We routinely use the flow cytometry analysis software listed below, but alternative software can be used instead if desired.
Reagent setup
10 mM OP-Puro stock solution
Dissolve 495 mg of OP-Puro (MW = 495 g/mol) in 100 ml of 1× PBS (this yields a concentration of 10 mM). ▲ CRITICAL Medchem Source produces OP-Puro as a free base, so the OP-Puro solution must be neutralized by the addition of equal moles of HCl 12 N (830 μl). The addition of the acid lowers the pH, and this must be readjusted to permit for safe administration to mice. Add NaOH dropwise (1 μl each time) to increase the pH back up to ~6.4–6.6, being very careful not to let the OP-Puro precipitate out of solution. Store OP-Puro in 0.5- to 1-ml aliquots at −20 °C for up to 2 years. Aliquots can be frozen and thawed at least twice.
70% (vol/vol) Ethanol
This solution can be prepared from the ethanol absolute. Store at room temperature (15–25 °C) for up to 2 years.
2% (vol/vol) Heat-inactivated bovine serum staining medium
Use a 20-ml syringe and a 0.2-μm filter to add 10 ml of filtered, heat-inactivated bovine serum to 500 ml of 1× HBSS. Staining medium can be stored at 4 °C for up to 1 month.
1% (wt/vol) PFA
This solution can be prepared from the 4% (wt/vol) PFA. Store at 4 °C protected from light for up to 2 years.
Permeabilization buffer
Dissolve 0.5 g of saponin in 485 ml of 1× PBS; this yields a concentration of 0.1% (wt/vol). Add 15 ml of FBS to the mixture (3% (vol/vol)). Vacuum-filter the solution using a 500-ml vacuum filter/storage bottle system. Store at 4 °C for up to 1 month.
1× Click-iT Cell Reaction Buffer (component A)
Add 4 ml of solution from a 10× Click-iT cell reaction buffer bottle to 36 ml of deionized water. Buffer can be stored at 2–6 °C for up to 6 months.
Click-iT Cell Buffer Additive (component C)
Add 4 ml of deionized water to the Click-iT cell buffer additive bottle and mix until fully dissolved. Store 1-ml aliquots at ≤−20 °C for up to 1 year. Aliquots can be frozen and thawed at least twice. ▲ CRITICAL The additive is a reducing agent that can oxidize if not properly handled. Upon oxidation, the additive turns from colorless to brown. Discard solutions that are brown in color.
AF555 azide
Dissolve 0.5 mg of the azide in 590 μl of DMSO to make a 1-mM (200×) stock solution. Store 50-μl aliquots at −20 °C, protected from light for up to 1 year. Aliquots can be frozen and thawed at least twice.
DAPI
Dissolve one vial (10 mg) of DAPI in 20 ml of PBS to make a 500 μg/ml DAPI stock solution. Make aliquots and store at 4 °C protected from light for up to 6 months.
Procedure
Preparing OP-Puro ● Timing 5–10 min
Thaw aliquots of OP-Puro at room temperature.
-
If any precipitate is visible, add HCl dropwise (1 μl at a time) until all precipitate disappears.
▲ CRITICAL STEP If addition of HCl is required, the pH should be readjusted to between 6.4 and 6.6 to permit safe administration to mice. If the pH is too low, add NaOH dropwise (1 μl at a time) to adjust the pH to between 6.4 and 6.6. Ensure that OP-Puro is completely in solution before use. Checking the pH is required only in the case of precipitate formation.
? TROUBLESHOOTING
OP-Puro administration to mice ● Timing ~10 min per mouse
-
3
Weigh each young adult mouse and calculate the appropriate dose of OP-Puro to be administered (49.5 mg of OP-Puro per kilogram of body weight).
! CAUTION All animal experiments should be performed according to relevant guidelines and regulations. All procedures in this protocol involving mice were approved by the UC San Diego Institutional Animal Care and Use Committee.
▲ CRITICAL STEP Because OP-Puro is not administered at a saturating dose, precision of the administered dose is critical for comparing multiple mice in a single experiment.
-
4
Administer 10 mM OP-Puro in PBS by i.p. injection at a dose of 10 μl/g of bodyweight (49.5 mg of OP-Puro per kilogram of body weight).
▲ CRITICAL STEP If multiple mice are being analyzed, administer OP-Puro to each mouse at intervals that enable sufficient time to sacrifice and obtain cells exactly 1 h after injection. In the case of bone marrow cells, we typically inject mice at 10-min intervals.
-
5
Administer PBS to a control mouse (10 μl/g). Samples from this mouse should proceed through the entire protocol to establish the level of background fluorescence.
Obtaining tissue and cell counting ● Timing ~1–1.5 h
▲ CRITICAL In this section, we detail the procedures for obtaining bone marrow cells. In the case that other cell types or tissues are used, refer to the relevant protocols.
-
6
Sacrifice the mice by CO2 inhalation followed by cervical dislocation.
▲ CRITICAL STEP Sacrifice each mouse exactly 1 h after OP-Puro administration. Differences in the labeling period between mice could obfuscate data.
-
7
Pin the limbs of the mouse to a Styrofoam board with the stomach facing upward and spray the fur and skin of the mouse with 70% (vol/vol) ethanol (Fig. 3a).
-
8
Lift the skin using forceps, then use the surgical scissors to cut the skin along the midline of the trunk.
-
9
Use surgical scissors to scrape the skin to either side of the midline away from the peritoneum and pin the skin away from the body.
-
10
Cut the skin away from the hind limbs (Fig. 3b).
-
11
Cut/scrape away as much muscle and other soft tissue as possible from the bone of the leg with surgical scissors or a scalpel.
-
12
Cut the tibia just above the ankle. This should be demarked by a transition between bone that is tinted red by bone marrow and opaque white bone. Cutting of the bone should be done with a single straight cut, using surgical scissors to prevent bone shearing.
-
13
Remove the tibia by cutting just below the knee (Fig. 3b,c).
-
14
Remove the femur by cutting just above the knee and at the pelvis (Fig. 3b,c).
-
15
Place the bones in a small dish containing cold staining medium.
-
16
Repeat Steps 11–15 for the second hind limb.
-
17
Fill a 14-ml Falcon tube with 5 ml of staining medium.
-
18
Fill a 3-ml syringe connected to a 23-gauge needle with the staining medium contained in the Falcon tube. Insert the needle into one end of the tibia and flush the bone marrow out of the other end of the bone into the 14-ml Falcon tube (Fig. 3d).
-
19
Refill the syringe with the existing 5 ml of staining medium and repeat Step 18 from the other side of the tibia.
-
20
Perform Steps 18 and 19 for the femur. The bone marrow plug should be visible in the 14-ml Falcon tube following flushing, and the bones should transition from being tinted red to white.
-
21
Dissociate the bone marrow plugs by passing them through the 23-gauge needle 3–5 times.
▲ CRITICAL STEP Keep all cells on ice as much as possible. There can be ongoing OP-Puro labeling as well as degradation of peptides in which OP-Puro is incorporated. As a consequence, the timing and tissue/cell handling are extremely important and require consistency across multiple samples.
-
22
Centrifuge the cell solutions at 1,300g for 5 min at 4 °C and discard the supernatant.
-
23
Resuspend the cells in 5 ml of cold staining medium and count them with a hemocytometer on the basis of trypan blue exclusion.
-
24
Resuspend the bone marrow cells at a concentration of 107 cells/ml in staining medium. Proceed with the next section immediately.
Fig. 3 ∣. Obtaining bone marrow cells from mouse long bones.

a, Mouse limbs are pinned to a Styrofoam board with the stomach facing upward, and the fur/skin is sprayed with 70% (vol/vol) ethanol. b, The skin is cut away from the hind limbs. The tibia is removed by cutting just above the ankle and below the knee (blue arrows). The femur is removed by cutting just above the knee and at the pelvis (yellow arrows). c, The tibia (left) and femur (right). d, A 23-gauge needle and a 3-ml syringe are used to flush bone marrow from the femurs and tibias into a 14-ml Falcon tube containing 5 ml of staining medium. All procedures in this protocol involving mice were approved by the UC San Diego Institutional Animal Care and Use Committee.
Cell-surface immunostaining ● Timing –1–1.5 h
▲ CRITICAL The cell-surface immunostaining procedure described below is specific for staining HSCs, CMPs, GMPs and MEPs. In the case that other cell types are used, refer to the relevant protocols.
-
25
Distribute 4 × 10⁶ bone marrow cells (400 μl) each into two 5-ml FACS tubes per sample (mouse). One tube per sample will be used to stain for HSCs. The second tube will be used to stain for CMPs, GMPs and MEPs.
-
26
Distribute 1 × 10⁶ bone marrow cells (100 μl) from the no-OP-Puro control mouse into each of six 5-ml FACS tubes. These will be used as single-antibody staining controls (unstained, FITC, Percp-Cy5.5, APC, APC-e780, AF700).
-
27
Combine 2 × 10⁶ bone marrow cells (200 μl) from the no-OP-Puro control mouse and 2 × 10⁶ bone marrow cells (200 μl) from the OP-Puro-treated mouse into a single 5-ml FACS tube. This sample will be used as an OP-Puro (AF555) control.
▲ CRITICAL STEP Using cells from the negative control only will not give a signal for AF555, because this sample lacks OP-Puro. Using cells from only OP-Puro-treated mice will give a single population of AF555-positive cells, which is not useful for compensation before data acquisition by flow cytometry. Therefore, a mixture of cells provides the best control.
-
28
Prepare antibody master mixes for HSCs and for CMPs/GMPs/MEPs in separate 1.5 ml tubes. Prepare each antibody cocktail in staining medium (100 μl per sample/mouse). Add appropriate antibodies to each (Table 2). The volume of each antibody added to the master mix is dependent on the total number of cells and samples being immunostained. Table 2 provides the volume of each antibody needed to stain 1 million cells. This volume must be multiplied by the total number of cells to be stained and by the number of mice to be analyzed. Add 100 μl of staining medium per sample per mouse.
-
29
Add 100 μl of antibody cocktail to the appropriate samples.
-
30
Add 0.5 μl of single antibodies directly to each of the single-antibody staining controls (from Step 26). The recommended control antibodies are noted in Table 2.
-
31
Briefly vortex the samples and the controls and incubate on ice, protected from light, for 45–60 min.
-
32
Add 4 ml of the cold staining medium and centrifuge at 1,300g for 5 min at 4 °C.
-
33
Discard the supernatant and place the cells on ice, protected from light. Proceed with next section immediately.
Table 2 ∣.
Antibody staining for HSCs and CMP/GMP/MEP immunophenotyping
| HSC: Antibody | Volume/million cells (μl) |
CMP/GMP/MEP: Antibody |
Volume/million cells (μl) |
|---|---|---|---|
| CD3-FITCa | 0.2 | CD3-FITCa | 0.2 |
| CD8-FITCa | 0.2 | CD4-FITCa | 0.2 |
| CD5-FITCa | 0.2 | CD8-FITCa | 0.2 |
| Gr1-FITCa | 0.2 | CD11b(Mac1)-FITCa | 0.2 |
| Ter119-FITCa | 0.2 | Gr1-FITCa | 0.2 |
| CD45R(B220)-FITCa | 0.4 | Ter119-FITCa | 0.2 |
| CD48-FITC | 0.2 | CD45R(B220)-FITCa | 0.4 |
| CD117-e780 | 1 | CD127-FITC | 0.4 |
| Sca-1-PerCp-Cy5.5 | 1 | Sca1-APC | 1 |
| CD150-APC | 1 | CD34-AF700 | 1 |
| CD117-e780 | 1 | ||
| CD16/32-PerCp-Cy5.5 | 0.4 | ||
| Recommended single-color control antibodies | |||
| Gr1-FITC | |||
| CD11b-e780 | |||
| CD45R(B220)-PerCp-Cy5.5 | |||
| CD11b(Mac1)-APC | |||
| CD34-AF700 | |||
Indicates lineage-specific antibodies.
Fixation and permeabilization ● Timing ~30 min
▲ CRITICAL Steps 34–40 should be carried out on both the samples and the controls.
-
34
Resuspend the cell pellets in 0.5 ml of 1% (wt/vol) PFA in PBS.
-
35
Briefly vortex and incubate on ice, protected from light, for 10–15 min.
-
36
Add 4 ml of cold PBS to the samples.
-
37
Centrifuge at 1,300g for 5 min at 4 °C and discard the supernatant.
-
38
Resuspend the cell pellet in 200 μl of cold permeabilization buffer.
-
39
Incubate at room temperature, protected from light, for 5 min.
-
40
Centrifuge at 1,300g for 5 min at 4 °C and then discard the supernatant.
▲ CRITICAL STEP Proceed immediately to azide–alkyne cycloaddition.
Azide–alkyne cycloaddition reaction and DAPI staining ● Timing ~1–1.5 h
-
41
Thaw the reaction components listed in Table 3 at room temperature.
▲ CRITICAL STEP Protect AF555 from light at all times.
-
42
Prepare the reaction solution on ice as indicated in Table 3. For each sample, 500 μl of reaction mixture is required. For multiple samples, the reaction should be scaled up, prepared as a master mix and distributed to each sample to avoid variability from making multiple reaction mixtures. The master mix should be prepared for the total number of staining samples, plus the OP-Puro AF555 control, plus one extra to ensure sufficient volume.
▲ CRITICAL STEP Component C should be added last and in a dropwise manner. The reaction mixture should be prepared fresh and not >15 min before use.
-
43
Briefly vortex the reaction mixture and keep on ice, protected from light, until use.
-
44
Add 500 μl of reaction mixture to each sample tube and vortex for few seconds.
▲ CRITICAL STEP Do not add the mixture to the unstained or single-antibody staining controls.
-
45
Incubate at room temperature, protected from light, for 30 min.
-
46
Add 4 ml of permeabilization buffer.
-
47
Centrifuge at 1,300g for 5 min at 4 °C and then discard the supernatant. Repeat Steps 46 and 47 at least twice.
▲ CRITICAL STEP Multiple washes are critical for reducing background fluorescence.
? TROUBLESHOOTING
-
48
Resuspend the cell pellet in 200 μl of PBS supplemented with DAPI (30 μg/ml).
▲ CRITICAL STEP Resuspend both samples and controls.
-
49
Briefly vortex the cells and let the mixture stand on ice, protected from light, for at least 1 h before analysis to ensure uniform DAPI incorporation into the cells.
■ PAUSE POINT For longer storage (up to at least 24 h), the samples should be stored at 4 °C, protected from light.
Table 3 ∣.
Click-iT reaction components
| Component | Volume/sample (μl) | Final concentration |
|---|---|---|
| Click-iT cell reaction buffer 1× (component A) | 440 | Not applicable |
| Copper (II) sulfate (CuSO4, component B) | 10 | 2 mM |
| AF555 | 2.5 | Not applicable |
| Click-iT cell buffer additive (component C) | 50 | Not applicable |
Data acquisition by flow cytometry ● Timing ~1–3 h
-
50
Use the unstained and single-color controls to set up the parameters and compensation on the flow cytometer.
-
51
Acquire and record at least 1 × 10⁶ DAPI+ events for HSC samples and 4 × 10⁵ DAPI+ events for CMP/GMP/MEP samples.
▲ CRITICAL STEP The average frequency of HSCs is ~0.01% of total bone marrow cells in mice. The average frequency of CMPs, GMPs and MEPs is ~0.1–0.4% of total bone marrow cells in mice. Even for highly abundant cell populations, the minimum number of recorded events should be ≥104.
? TROUBLESHOOTING
Flow cytometry data analysis and quantification ● Timing ~30 min
▲ CRITICAL The flow cytometry procedure described below is specific to analyzing HSCs, CMPs, GMPs and MEPs. In the case that other cell types are used, refer to the relevant protocols or experimentally determine the appropriate gating strategy.
-
52
Use the forward-scatter-area (FSC-A) and the side-scatter-area (SSC-A) channels to gate on the cell population to best exclude debris (Fig. 4).
-
53
Select the population that is DAPI+ to include only fixed cells (Fig. 4).
-
54
Select the HSC population. One gating strategy for HSCs involves excluding differentiated cells with cell-surface proteins that identify specific hematopoietic cell lineages (Lineage−). We also include an anti-CD48 antibody with the lineage antibody cocktail, because HSCs are also CD48−. Lin−CD48− cells are then assessed for expression of CD150, CD117 (ckit) and Sca-1, which are all expressed by HSCs10.
-
55
Within the DAPI+ cells, gate on CD150+CD48−Lin− cells (Fig. 4).
-
56
Subsequently, gate on CD117+Sca1+ cells (Fig. 4).
-
57
Select myeloid progenitor cell populations. Myeloid progenitor populations are also contained within the Lin− bone marrow cells. Note that the lineage cocktail for HSCs and myeloid progenitors is slightly different (Table 2). Myeloid progenitors are also negative for CD127 (Il7rα; included in the lineage antibody cocktail) and for Sca1. This fraction can be further subdivided into CMPs (CD34+CD16/32−/low), MEPs (CD34−CD16/32−/low) and GMPs (CD34+CD16/32high).
-
58
Within the DAPI+ cells, gate on CD117+CD127−Lin− cells (Fig. 5).
-
59
Subsequently, gate on CD117+Sca1− cells (Fig. 5).
-
60
Subsequently, gate on CD34+CD16/32−/low for CMPs (Fig. 5).
-
61
Subsequently, gate on CD34+CD16/32high for GMPs (Fig. 5).
-
62
Subsequently, gate on CD34−CD16/32−/low for MEPs (Fig. 5).
-
63
Include the MFI of OP-Puro within DAPI+ cells (unfractionated bone marrow), HSCs, CMPs, GMPs and MEPs.
-
64
The MFI of OP-Puro in the control mouse represents the level of background fluorescence. Subtract the background value from the MFI of OP-Puro in the equivalent cell populations from OP-Puro-treated mice.
-
65
Plot the data as absolute or background-subtracted MFI of OP-Puro for each population. Alternatively, the OP-Puro MFI for each cell population can be normalized to unfractionated bone marrow cells (DAPI+ cells) within each sample tube. See Anticipated results.
Fig. 4 ∣. HSCs synthesize less protein per hour than unfractionated bone marrow cells.

Representative flow cytometry plots showing the gating strategy for analyzing CD150+CD48−LSK HSCs. A representative histogram shows OP-Puro incorporation into HSCs (blue) compared to unfractionated bone marrow cells from the same mouse (red) and HSCs from a PBS-injected control mouse (gray). Cell numbers and frequencies are shown in Supplementary Tables 1 and 3, respectively.BM, bone marrow; FITC, fluorescein isothiocyanate; FSC-A, front-scatter area; SSC-A, side-scatter area. All procedures in this protocol involving mice were approved by the UC San Diego Institutional Animal Care and Use Committee.
Fig. 5 ∣. Restricted myeloid progenitors have much higher protein synthesis rates than HSCs.

(Top) Representative flow cytometry plots showing the gating strategy for CMPs (left), GMPs (center) and MEPs (right). (Bottom) Representative histograms show OP-Puro incorporation into CMPs (left; blue), GMPs (middle; blue) and MEPs (right; blue) compared to HSCs from the same mouse (red) and progenitors from a PBS-injected control mouse (gray). Cell numbers and frequencies are shown in Supplementary Tables 2 and 4, respectively. All procedures in this protocol involving mice were approved by the UC San Diego Institutional Animal Care and Use Committee.
Troubleshooting
Troubleshooting advice can be found in Table 4.
Table 4 ∣.
Troubleshooting table
| Step | Problem | Possible reason | Solution |
|---|---|---|---|
| 2 | OP-Puro precipitates out of solution | Unbalanced reaction | Add HCl dropwise (1 μl) and mix until OP-Puro fully dissolves. Readjust pH to 6.4–6.6 by adding NaOH dropwise (1 μl) |
| 47 | Formation of a precipitate after washing azide–alkyne cycloaddition reaction with permeabilization buffer | The permeabilization buffer was not vacuum-filtered | FBS and saponin might contain solid particles that might cause the formation of a white precipitate after contact with CuSO4. After adding FBS and dissolving saponin in PBS, vacuum-filter the solution |
| 51 | Not enough events recorded | Cells were lysed because the permeabilization step was too long | Optimize the permeabilization time for each cell type to ensure cells are not lysed |
| Incorrect cell counting was performed, and the wrong number of cells was taken for staining | Make sure your cell-counting technique is accurate | ||
| Fluidic system in flow cytometer becomes clogged | Run water or a cleaning solution through the flow cytometer to eliminate any cells and/or debris that might be clogging the fluidic system | ||
| No signal for some fluorophores | Fluorescence has been quenched during fixation, permeabilization or after Click-iT reaction | Certain fluorophores are damaged or quenched by the subsequent fixation and azide–alkyne cycloaddition reaction. This includes any PE or PE-conjugated dyes; these dyes should be strictly avoided. We have confirmed the stability of the following fluorophores through this reaction: FITC, PERCP-Cy5.5, APC, APC-eFluor780, Alexa Fluor 660, Alexa Fluor 700. Any alternative fluorophores should be tested before use | |
| No OP-Puro signal | Click-iT reaction did not take place | Make sure the cells are permeabilized so the AF555 and the click-iT reagents can penetrate the cell membrane in order to react with the OP-Puro to produce fluorescence | |
| Make sure you perform the Click-iT reaction at room temperature. The reaction time is optimized for this condition. If performed on ice, the time required for the azide–alkyne cycloaddition reaction might increase | |||
| Inadequate i.p. injection and no OP-Puro incorporation | When performing the i.p. injection, avoid injecting into any organ, because this would prevent OP-Puro incorporation into the bone marrow | ||
| Wrong channel selected in the flow cytometer | AF555 has an excitation maximum of 555 nm and an emission maximum of 580 nm. Therefore, a laser line of 488/532 should be used to detect fluorescence | ||
| OP-Puro precipitated out of solution | Make sure the aliquot of OP-Puro has not precipitated out of solution before injecting the mice. Readjust the pH to dissolve any precipitate formed, driving the pH back to 6.4. If the formation of precipitate is reiterative, discard that aliquot and use a new one | ||
| Low OP-Puro signal | AF555 became inactive because of light exposure | Store AF555 in the dark at −20 °C | |
| Wrong OP-Puro dose injected | Accurately weigh the animals and calculate the dose appropriately | ||
| Incorrect flow cytometer setup | Make sure that the voltage is high enough to produce a visible signal |
Timing
The approximate times given here are based on an experiment with a group of six mice.
Steps 1 and 2, preparation of OP-Puro: 5–10 min
Steps 3–5, OP-Puro administration to mice: ~1 h 15 min
Steps 6–24, obtaining tissue and cell counting: ~1–1.5 h
Steps 25–33, cell-surface immunostaining: ~1–1.5 h
Steps 34–40, fixation and permeabilization: ~30 min
Steps 41–49, azide–alkyne cycloaddition reaction and DAPI staining: ~1–1.5 h
Steps 50 and 51, data acquisition by flow cytometry: ~1–3 h
Steps 52–65, flow cytometry data analysis and quantification: ~30 min
Anticipated results
Examples of anticipated flow cytometry data are shown in Figs. 4-6. Briefly, after gating on fixed cells based on FSC-A and SSC-A, DAPI incorporation should be visualized as a histogram (Fig. 4). A clear bimodal distribution of DAPI+ cells should be apparent. The first, larger peak represents cells in G0 and G1 of the cell cycle (2n DNA content). The second, smaller peak should appear at an MFI that is two times larger, and represents dividing cells in the G2/M phases of the cell cycle (4n DNA content). Cells between the two peaks are in S phase (>2n and <4n DNA content). To analyze all cells, gate on all DAPI+ cells. OP-Puro incorporation in unfractionated bone marrow cells should be clearly detected above the background fluorescence from the PBS-treated control mouse. Background fluorescence will vary on the basis of the flow cytometer settings, but OP-Puro MFI in unfractionated bone marrow cells should be ~log10-fold higher than background. OP-Puro incorporation in unfractionated bone marrow cells typically appears as a bimodal distribution.
Fig. 6 ∣. OP-Puro incorporation by HSCs and myeloid progenitor cells in vivo.
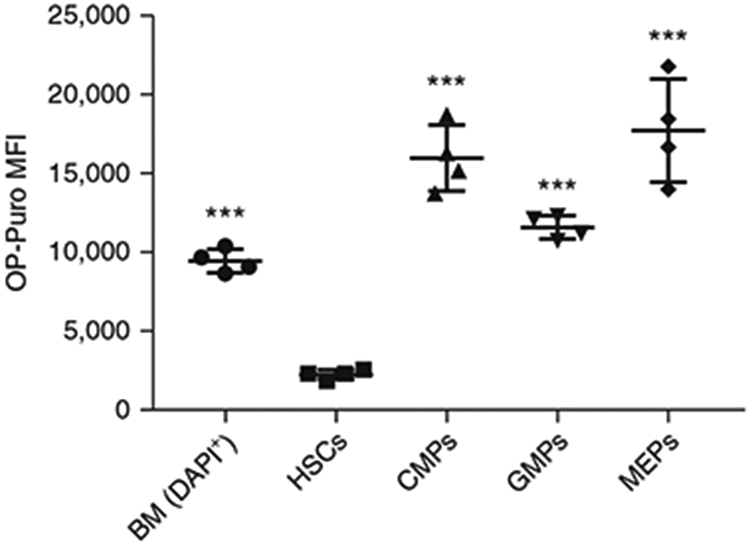
MFI of OP-Puro in unfractionated bone marrow cells (BM), HSCs, CMPs, GMPs and MEPs (n = 4). Background fluorescence has been subtracted from each population. The raw data are shown in Tables 5 and 6. Data represent mean ± standard deviation. Statistical significance relative to HSCs was assessed using a one-way ANOVA followed by Dunnett’s test for multiple comparisons; ***P < 0.001. All procedures in this protocol involving mice were approved by the UC San Diego Institutional Animal Care and Use Committee.
For HSCs, OP-Puro incorporation should be at the low end of that of unfractionated bone marrow cells. An example of the histogram is shown in Fig. 4. For CMPs, GMPs and MEPs, OP-Puro incorporation should be at levels equal to or up to approximately threefold higher than unfractionated bone marrow cells7,9 (Fig. 5).
An example of OP-Puro MFI values is shown in Tables 5 and 6 and plotted in Fig. 6. Numerical analysis for the number of cells analyzed and the absolute numbers, along with statistics of the relevant cell population(s) within post-sort fractions, can be found in Supplementary Tables 1-4.
Table 5 ∣.
Raw sample data
| Raw data | HSC stain–OP-Puro MFI |
OP-Puro MFI | |||||
|---|---|---|---|---|---|---|---|
| Mouse no. | Treatment | BM (DAPI+) | HSC | BM (DAPI+) | CMP | GMP | MEP |
| 1 | PBS | 878 | 1,336 | 854 | 1,644 | 2,020 | 1,674 |
| 2 | OP-Puro | 9,962 | 3,655 | 9,304 | 17,948 | 14,340 | 18,350 |
| 3 | OP-Puro | 11,280 | 3,652 | 10,948 | 16,835 | 13,238 | 20,150 |
| 4 | OP-Puro | 9,565 | 3,204 | 8,930 | 20,382 | 14,128 | 23,482 |
| 5 | OP-Puro | 10,567 | 3,911 | 9,745 | 15,410 | 12,773 | 15,684 |
BM, bone marrow.
Table 6 ∣.
Sample data with background subtracted
| Subtract background | MP stain–OP-Puro MFI |
OP-Puro MFI | |||||
|---|---|---|---|---|---|---|---|
| Mouse no. | Treatment | BM (DAPI+) | HSC | BM (DAPI+) | CMP | GMP | MEP |
| 2 | OP-Puro | 9,084 | 2,319 | 8,450 | 16,304 | 12,320 | 16,676 |
| 3 | OP-Puro | 10,402 | 2,316 | 10,094 | 15,191 | 11,218 | 18,476 |
| 4 | OP-Puro | 8,687 | 1,868 | 8,076 | 18,738 | 12,108 | 21,808 |
| 5 | OP-Puro | 9,689 | 2,575 | 8,891 | 13,766 | 10,753 | 14,010 |
| Mean | 9,466 | 2,270 | 8,878 | 16,000 | 11,600 | 17,743 | |
| s.d. | 748 | 294 | 877 | 2,100 | 739 | 3,273 | |
Supplementary Material
Acknowledgements
This work was supported by the NIDDK (R01DK116951), the V Foundation for Cancer Research, the American Society of Hematology, the Sanford Stem Cell Clinical Center, a Chancellor’s Research Excellence Scholarship and an NCI Cancer Center Support Grant to the Moores Cancer Center (P30-CA 023100). Flow cytometry was performed at the Flow Cytometry Core Facility at the La Jolla Institute for Allergy and Immunology. The FACSAria II cell sorter was acquired through the Shared Instrumentation Grant Program (S10 RR027366).
Footnotes
Competing interests
The authors declare no competing interests.
Publisher’s note: Springer Nature remains neutral with regard to jurisdictional claims in published maps and institutional affiliations.
Reporting Summary
Further information on research design is available in the Nature Research Reporting Summary linked to this article.
Supplementary information is available for this paper at https://doi.org/10.1038/s41596-018-0100-z.
Data availability
The datasets generated during and/or analyzed during the current study are available from the corresponding author upon reasonable request.
References
- 1.Allfrey V, Daly MM & Mirsky AE Synthesis of protein in the pancreas. II. The role of ribonucleoprotein in protein synthesis. J. Gen. Physiol 37, 157–175 (1953). [DOI] [PMC free article] [PubMed] [Google Scholar]
- 2.Garlick PJ Measurement of liver protein-synthetic rate. Biochem. J 126, 23P (1972). [DOI] [PMC free article] [PubMed] [Google Scholar]
- 3.Garlick PJ, McNurlan MA & Preedy VR A rapid and convenient technique for measuring the rate of protein synthesis in tissues by injection of [3H]phenylalanine. Biochem. J 192, 719–723 (1980). [DOI] [PMC free article] [PubMed] [Google Scholar]
- 4.Zhao Y et al. Quantitative proteomics: measuring protein synthesis using 15N amino acid labeling in pancreatic cancer cells. Anal. Chem 81, 764–771 (2009). [DOI] [PMC free article] [PubMed] [Google Scholar]
- 5.Buszczak M, Signer RA & Morrison SJ Cellular differences in protein synthesis regulate tissue homeostasis. Cell 159, 242–251 (2014). [DOI] [PMC free article] [PubMed] [Google Scholar]
- 6.Liu J, Xu Y, Stoleru D & Salic A Imaging protein synthesis in cells and tissues with an alkyne analog of puromycin. Proc. Natl. Acad. Sci. USA 109, 413–418 (2012). [DOI] [PMC free article] [PubMed] [Google Scholar]
- 7.Signer RA, Magee JA, Salic A & Morrison SJ Haematopoietic stem cells require a highly regulated protein synthesis rate. Nature 509, 49–54 (2014). [DOI] [PMC free article] [PubMed] [Google Scholar]
- 8.Kolb HC, Finn MG & Sharpless KB Click chemistry: diverse chemical function from a few good reactions. Angew. Chem. Int. Ed. Engl 40, 2004–2021 (2001). [DOI] [PubMed] [Google Scholar]
- 9.Signer RA et al. The rate of protein synthesis in hematopoietic stem cells is limited partly by 4E-BPs. Genes Dev. 30, 1698–1703 (2016). [DOI] [PMC free article] [PubMed] [Google Scholar]
- 10.Kiel MJ et al. SLAM family receptors distinguish hematopoietic stem and progenitor cells and reveal endothelial niches for stem cells. Cell 121, 1109–1121 (2005). [DOI] [PubMed] [Google Scholar]
- 11.Akashi K, Traver D, Miyamoto T & Weissman IL A clonogenic common myeloid progenitor that gives rise to all myeloid lineages. Nature 404, 193–197 (2000). [DOI] [PubMed] [Google Scholar]
- 12.Zismanov V et al. Phosphorylation of eIF2alpha is a translational control mechanism regulating muscle stem cell quiescence and self-renewal. Cell Stem Cell 18, 79–90 (2016). [DOI] [PubMed] [Google Scholar]
- 13.Sanchez CG et al. Regulation of ribosome biogenesis and protein synthesis controls germline stem cell differentiation. Cell Stem Cell 18, 276–290 (2016). [DOI] [PMC free article] [PubMed] [Google Scholar]
- 14.Blanco S et al. Stem cell function and stress response are controlled by protein synthesis. Nature 534, 335–340 (2016). [DOI] [PMC free article] [PubMed] [Google Scholar]
- 15.Llorens-Bobadilla E et al. Single-cell transcriptomics reveals a population of dormant neural stem cells that become activated upon brain injury. Cell Stem Cell 17, 329–340 (2015). [DOI] [PubMed] [Google Scholar]
- 16.Cai X et al. Runx1 deficiency decreases ribosome biogenesis and confers stress resistance to hematopoietic stem and progenitor cells. Cell Stem Cell 17, 165–177 (2015). [DOI] [PMC free article] [PubMed] [Google Scholar]
- 17.Goncalves KA et al. Angiogenin promotes hematopoietic regeneration by dichotomously regulating quiescence of stem and progenitor cells. Cell 166, 894–906 (2016). [DOI] [PMC free article] [PubMed] [Google Scholar]
- 18.Sendoel A et al. Translation from unconventional 5′ start sites drives tumour initiation. Nature 541, 494–499 (2017). [DOI] [PMC free article] [PubMed] [Google Scholar]
- 19.Nagelreiter F et al. OPP labeling enables total protein synthesis quantification in CHO production cell lines at the single-cell level. Biotechnol. J 13, e1700492 (2018). [DOI] [PubMed] [Google Scholar]
- 20.Khajuria RK et al. Ribosome levels selectively regulate translation and lineage commitment in human hematopoiesis. Cell 173, 90–103.e119 (2018). [DOI] [PMC free article] [PubMed] [Google Scholar]
- 21.Bulut-Karslioglu A et al. The transcriptionally permissive chromatin state of embryonic stem cells is acutely tuned to translational output. Cell Stem Cell 22, 369.e8–383.e8 (2018). [DOI] [PMC free article] [PubMed] [Google Scholar]
- 22.Forester CM et al. Revealing nascent proteomics in signaling pathways and cell differentiation. Proc. Natl. Acad. Sci. USA 115, 2353–2358 (2018). [DOI] [PMC free article] [PubMed] [Google Scholar]
- 23.Guzzi N et al. Pseudouridylation of tRNA-derived fragments steers translational control in stem cells. Cell 173, 1204.e26–1216.e26 (2018). [DOI] [PubMed] [Google Scholar]
- 24.Seguin SJ et al. Inhibition of autophagy, lysosome and VCP function impairs stress granule assembly. Cell Death Differ. 21, 1838–1851 (2014). [DOI] [PMC free article] [PubMed] [Google Scholar]
- 25.Scognamiglio R et al. Myc depletion induces a pluripotent dormant state mimicking diapause. Cell 164, 668–680 (2016). [DOI] [PMC free article] [PubMed] [Google Scholar]
- 26.Sigurdsson V et al. Bile acids protect expanding hematopoietic stem cells from unfolded protein stress in fetal liver. Cell Stem Cell 18, 522–532 (2016). [DOI] [PubMed] [Google Scholar]
- 27.Tavernier SJ et al. Regulated IRE1-dependent mRNA decay sets the threshold for dendritic cell survival. Nat. Cell Biol 19, 698–710 (2017). [DOI] [PMC free article] [PubMed] [Google Scholar]
- 28.Zhou F et al. AML1-ETO requires enhanced C/D box snoRNA/RNP formation to induce self-renewal and leukaemia. Nat. Cell Biol 19, 844–855 (2017). [DOI] [PubMed] [Google Scholar]
- 29.Nguyen-McCarty M & Klein PS Autophagy is a signature of a signaling network that maintains hematopoietic stem cells. PLoS ONE 12, e0177054 (2017). [DOI] [PMC free article] [PubMed] [Google Scholar]
- 30.Cabezas-Wallscheid N et al. Vitamin A-retinoic acid signaling regulates hematopoietic stem cell dormancy. Cell 169, 807.e19–823.e19 (2017). [DOI] [PubMed] [Google Scholar]
- 31.Vara JA, Portela A, Ortin J & Jimenez A Expression in mammalian cells of a gene from Streptomyces alboniger conferring puromycin resistance. Nucleic Acids Res. 14, 4617–4624 (1986). [DOI] [PMC free article] [PubMed] [Google Scholar]
- 32.Esposito AM & Kinzy TG In vivo [35S]-methionine incorporation. Methods Enzymol. 536, 55–64 (2014). [DOI] [PubMed] [Google Scholar]
- 33.Schick BP Synthesis of proteins from [35S]methionine by guinea pig megakaryocytes in vivo and time course of appearance of newly synthesized proteins in platelets. Blood 76, 887–891 (1990). [DOI] [PubMed] [Google Scholar]
- 34.Calve S, Witten AJ, Ocken AR & Kinzer-Ursem TL Incorporation of non-canonical amino acids into the developing murine proteome. Sci. Rep 6, 32377 (2016). [DOI] [PMC free article] [PubMed] [Google Scholar]
- 35.Beatty KE et al. Fluorescence visualization of newly synthesized proteins in mammalian cells. Angew. Chem. Int. Ed. Engl 45, 7364–7367 (2006). [DOI] [PubMed] [Google Scholar]
- 36.Dieterich DC et al. In situ visualization and dynamics of newly synthesized proteins in rat hippocampal neurons. Nat. Neurosci 13, 897–905 (2010). [DOI] [PMC free article] [PubMed] [Google Scholar]
- 37.Dieterich DC, Link AJ, Graumann J, Tirrell DA & Schuman EM Selective identification of newly synthesized proteins in mammalian cells using bioorthogonal noncanonical amino acid tagging (BONCAT). Proc. Natl. Acad. Sci. USA 103, 9482–9487 (2006). [DOI] [PMC free article] [PubMed] [Google Scholar]
- 38.Dieterich DC et al. Labeling, detection and identification of newly synthesized proteomes with bioorthogonal non-canonical amino-acid tagging. Nat. Protoc 2, 532–540 (2007). [DOI] [PubMed] [Google Scholar]
- 39.Howden AJ et al. QuaNCAT: quantitating proteome dynamics in primary cells. Nat. Methods 10, 343–346 (2013). [DOI] [PMC free article] [PubMed] [Google Scholar]
- 40.Erdmann I et al. Cell-selective labelling of proteomes in Drosophila melanogaster. Nat. Commun 6, 7521 (2015). [DOI] [PMC free article] [PubMed] [Google Scholar]
- 41.Nathans D Puromycin inhibition of protein synthesis: incorporation of puromycin into peptide chains. Proc. Natl. Acad. Sci. USA 51, 585–592 (1964). [DOI] [PMC free article] [PubMed] [Google Scholar]
- 42.Goodman CA & Hornberger TA Measuring protein synthesis with SUnSET: a valid alternative to traditional techniques? Exerc. Sport Sci. Rev 41, 107–115 (2013). [DOI] [PMC free article] [PubMed] [Google Scholar]
- 43.Schmidt EK, Clavarino G, Ceppi M & Pierre P SUnSET, a nonradioactive method to monitor protein synthesis. Nat. Methods 6, 275–277 (2009). [DOI] [PubMed] [Google Scholar]
- 44.Goodman CA et al. Novel insights into the regulation of skeletal muscle protein synthesis as revealed by a new nonradioactive in vivo technique. FASEB J. 25, 1028–1039 (2011). [DOI] [PMC free article] [PubMed] [Google Scholar]
- 45.Aviner R, Geiger T & Elroy-Stein O Novel proteomic approach (PUNCH-P) reveals cell cycle-specific fluctuations in mRNA translation. Genes Dev. 27, 1834–1844 (2013). [DOI] [PMC free article] [PubMed] [Google Scholar]
- 46.Ong SE et al. Stable isotope labeling by amino acids in cell culture, SILAC, as a simple and accurate approach to expression proteomics. Mol. Cell. Proteomics 1, 376–386 (2002). [DOI] [PubMed] [Google Scholar]
- 47.Ong SE & Mann M A practical recipe for stable isotope labeling by amino acids in cell culture (SILAC). Nat. Protoc 1, 2650–2660 (2006). [DOI] [PubMed] [Google Scholar]
- 48.Kruger M et al. SILAC mouse for quantitative proteomics uncovers kindlin-3 as an essential factor for red blood cell function. Cell 134, 353–364 (2008). [DOI] [PubMed] [Google Scholar]
Associated Data
This section collects any data citations, data availability statements, or supplementary materials included in this article.
Supplementary Materials
Data Availability Statement
The datasets generated during and/or analyzed during the current study are available from the corresponding author upon reasonable request.