Abstract
Objective
Leukoencephalopathy with brainstem and spinal cord involvement and lactate elevation (LBSL) is regarded a relatively mild leukodystrophy, diagnosed by characteristic long tract abnormalities on MRI and biallelic variants in DARS2, encoding mitochondrial aspartyl-tRNA synthetase (mtAspRS). DARS2 variants in LBSL are almost invariably compound heterozygous; in 95% of cases, 1 is a leaky splice site variant in intron 2. A few severely affected patients, still fulfilling the MRI criteria, have been described. We noticed highly unusual MRI presentations in 15 cases diagnosed by WES. We examined these cases to determine whether they represent consistent novel LBSL phenotypes.
Methods
We reviewed clinical features, MRI abnormalities, and gene variants and investigated the variants' impact on mtAspRS structure and mitochondrial function.
Results
We found 2 MRI phenotypes: early severe cerebral hypoplasia/atrophy (9 patients, group 1) and white matter abnormalities without long tract involvement (6 patients, group 2). With antenatal onset, microcephaly, and arrested development, group 1 patients were most severely affected. DARS2 variants were severer than for classic LBSL and severer for group 1 than group 2. All missense variants hit mtAspRS regions involved in tRNAAsp binding, aspartyl-adenosine-5′-monophosphate binding, and/or homodimerization. Missense variants expressed in the yeast DARS2 ortholog showed severely affected mitochondrial function.
Conclusions
DARS2 variants are associated with highly heterogeneous phenotypes. New MRI presentations are profound cerebral hypoplasia/atrophy and white matter abnormalities without long tract involvement. Our findings have implications for diagnosis and understanding disease mechanisms, pointing at dominant neuronal/axonal involvement in severe cases. In line with this conclusion, activation of biallelic DARS2 null alleles in conditional transgenic mice leads to massive neuronal apoptosis.
Leukoencephalopathy with brainstem and spinal cord involvement and lactate elevation (LBSL, MIM 611105) was identified in 2003 as a distinct leukodystrophy based on a highly characteristic MRI pattern with signal abnormalities in the periventricular and deep cerebral white matter, posterior limb of the internal capsule, and specific brain stem and spinal cord tracts.1 Diagnostic MRI criteria were established in 2007 and revised in 2012.2,3 LBSL typically has a relatively mild disease course with childhood or adolescent onset and slowly progressive pyramidal, cerebellar, and dorsal column dysfunction.1,4 The clinical spectrum is, however, broad, ranging from severely affected neonatal-onset cases with early demise to oligosymptomatic adult-onset cases with normal life span.3–6 So far, almost all published LBSL cases fulfill the MRI criteria, also patients at the extreme ends of the clinical spectrum.2–4
LBSL is caused by recessive variants in DARS2 (MIM 610956).2 DARS2 encodes mitochondrial aspartyl-tRNA synthetase (mtAspRS), which is necessary for the translation of the mitochondrial genome.2 Almost all published cases have compound heterozygous DARS2 variants; 95% of the cases have 1 splice site variant at the 3′-end of intron 2.4 The leaky nature of these splice site variants ensures some residual protein function.7
We recently noticed highly unusual MRI presentations in several patients with biallelic DARS2 variants diagnosed by whole-exome sequencing (WES). We reviewed clinical features, MRI abnormalities, and gene variants systematically and investigated the impact of the variants on mitochondrial function to determine whether the patients represent consistent novel LBSL phenotypes.
Methods
Standard Protocol Approvals and Patient Consents
The study was approved by the ethics committee of the Amsterdam University Medical Centers, location VU University Medical Center; written informed consent was obtained from guardians of participating patients. Patients with DARS2 variants and unusually severe and atypical MRI abnormalities were included. Clinical information was derived from clinical questionnaires for physicians and medical records.
MRIs
The first and, if performed, last MRI of each patient was analyzed by 2 observers (M.D.S. and M.S.v.d.K.) using a standardized protocol.8 The MRIs had been performed for diagnostic purposes in different centers between 2007 and 2018. Sagittal T1- and transverse T2-weighted images were available in all patients. As different spectroscopy protocols had been used, only presence or absence of lactate was assessed.
DARS2 Variants: Interpretation and Mapping on Crystal Structure
The DARS2 variants were identified by clinical WES. Their pathogenic role on protein function (SIFT, PolyPhen, and RUSSELL score) was predicted using Alamut Visual version 2.9 (Interactive Biosoftware, Rouen, France) and Mechismo.9 Combinations of variants were compared with previously published data.4
The effects of missense variants on the protein function were analyzed based on the crystal structure of homodimeric human mtAspRS (Protein Data Bank [PDB] entry 4AH6). We used crystal complexes of bacterial AspRS with tRNAAsp and aspartyl-adenosine-5′-monophosphate (PDB 1EFW and 1G51) to model the binding of these functional ligands on the human homodimeric mtAspRS structure. These ligands were assumed to conserve their binding mode, as human and bacterial orthologs present essentially the same fold.
To determine whether the missense variants affect the local protein structure, we calculated the folding free energy changes (ΔΔG) associated with the amino acid replacements in the homodimeric human mtAspRS crystal structure using FoldX.10 To check reliability, ΔΔG values were compared with those calculated on corresponding variants in a homodimeric bacterial AspRS structure (PDB 1L0W), which has a better atomic resolution (2.01Å vs the 3.7Å of the human protein structure). The average of 5 independent ΔΔG calculations is shown for each missense variant. A ΔΔG value significantly different from zero indicates structural alterations and possible pathogenicity, but ΔΔG values alone cannot provide a severity grade.
To clarify the pathogenic effects of variants, the knowledge of structural effects based on ΔΔG calculations, residue conservation, and structural/functional role of the affected amino acids was combined, taking into account their proximity to functional regions, such as ligand binding and catalysis.
Yeast Methods
Strains, Plasmids, and Media
Yeast strains were derived from W303‐1B (Matα ade2-1 leu2-3, 112 ura3-1 trp1-1 his3-11, and 15 can1-100) and grown in synthetic complete (SC) media (0.69% yeast nitrogen base without amino acids, FormediumTM, United Kingdom), supplemented with 1 g/L dropout mix, which includes amino acids and bases except for those necessary to keep the plasmids (i.e., uracil for vector pFL38 and tryptophan for vector pFL39).11 Media were supplemented with various carbon sources at 2% (weight/volume) (Carlo Erba Reagents).
The yeast DARS2 ortholog MSD1 and its natural promoter were cloned into the pFL38 vector.12 In addition, the HA-tag was cloned at the 3′ end of the MSD1 allele. The resulting plasmids, pFL38MSD1 and pFL38MSD1HA, were introduced into the W303‐1B strain.13
The endogenous MSD1 gene was disrupted in the W303-1B strains harboring pFL38MSD1 or pFL38MSD1HA through one-step gene disruption,14 obtaining W303-1B msd1Δ/pFL38MSD1 and W303-1B msd1Δ/pFL38MSD1HA. After verifying that the HA-tag did not affect the respiratory growth phenotype (data not shown), MSD1HA was cloned from pFL38 to pFL39 and mutagenized by site-directed mutagenesis (Stratagene, La Jolla, CA).12 Cloned sequences were verified by Sanger sequencing. The vectors containing the mutant or humanized alleles were transformed into msd1Δ/pFL38MSD1. The pFL38‐MSD1 was lost through plasmid‐shuffling on 5-fluoroorotic acid (5FOA)-containing medium.
Functional Analyses
The oxidative growth ability was assessed as before.15 Yeast was grown on SC agar plates (without tryptophan) supplemented with 2% glucose or 2% ethanol. Plates were incubated at 28 or 37°C, and growth was visually scored after 3 days. Oxygen consumption rate was measured, as described.15
Protein Extraction and Western Blot Analysis
Total protein was extracted from 10 OD600 cells grown in the same growth conditions used for measurement of respiratory activity.16 Protein pellets were suspended in 150 µL Laemmli sample buffer. Equal volumes (15 µL) were subjected to SDS-PAGE; electro-blotted membranes were incubated with rat anti-HA (Sigma-Aldrich, 1:2000) and mouse anti-Por1 (Abcam, 1:10,000) antibodies and subsequently with anti-rat DyLight 650 (Thermo Fisher Scientific, 1:4,000) and anti-mouse StarBright Blue520 (Bio-Rad, 1:10,000) secondary antibodies. Fluorescence signals were measured with Bio-Rad ChemiDoc Imagers and analyzed with Image Lab Software (Bio-Rad).
Data Availability
Anonymized data will be shared by request from any qualified investigator.
Results
Patients and Clinical Features
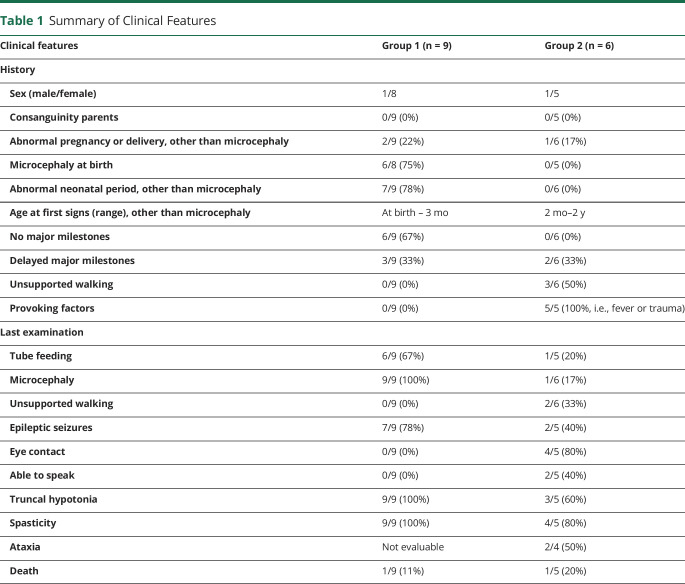
Fifteen patients were included (2 males and 13 females). Two different MRI phenotypes were distinguished, and patients were divided accordingly: group 1 characterized by severe cerebral atrophy (9 patients) and group 2 by severe cerebral white matter abnormalities (6 patients). Table 1 and table e-1, links.lww.com/NXG/A376, provide summarized and detailed clinical information, respectively.
Table 1.
Summary of Clinical Features
In group 1, age at onset ranged from antenatal to 3 months after birth. Almost all patients had microcephaly at birth, indicative of antenatal disease onset. All patients had severe microcephaly at latest examination. One patient (LBSL285) had tachypnea due to metabolic acidosis in the neonatal period. In the case of postnatal onset, no preceding events were reported. Most did not develop eye contact or lost it soon after birth. They reached (almost) no motor milestones and no speech. Most developed epilepsy. Only patient LBSL284 had a somewhat better development and could make a few steps with maximum support. Patient LBSL285 died at almost 4 years due to respiratory failure. The oldest patient is now 13 years.
In group 2, age at onset ranged from 2 months to 2 years. Only 1 patient (LBSL297) developed microcephaly at follow-up. Three patients achieved walking without support. Two patients showed slow improvement and 4 deteriorated. Only 1 patient (LBSL280) developed severe epilepsy, lost eye contact and all motor milestones, and died at age 2 years. The oldest patient is now 11 years.
MRIs
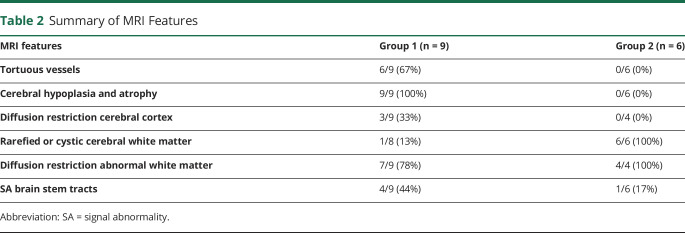
Table 2 and table e-2, links.lww.com/NXG/A376, provide summarized and detailed findings of the 22 available MRIs, respectively.
Table 2.
Summary of MRI Features
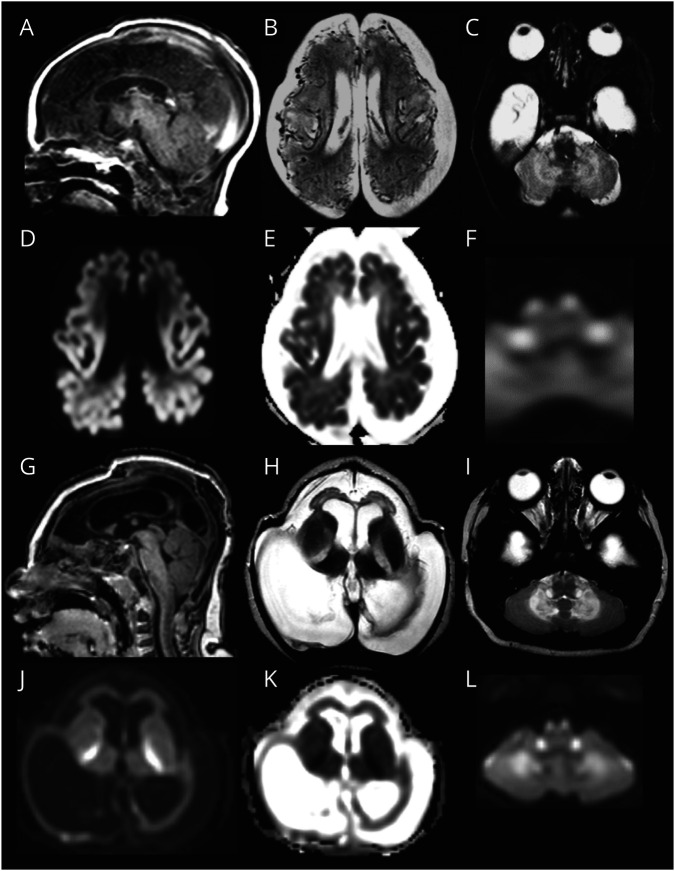
For group 1, MRIs of patient LBSL285 can be regarded as prototype and are described in more detail (figure 1). The first MRI was obtained 2 days after birth. The cerebral hemispheres were small, appearing hypoplastic, but the skull was larger, suggesting also atrophy. Subdural effusions filled the space between brain and skull. Numerous abnormal, tortuous blood vessels were present at the brain surface. The cerebral cortex had abnormal signal intensity and appeared thin. The corpus callosum was extremely thin. The posterior limb of the internal capsule, middle and inferior cerebellar peduncles, and pyramidal tracts in the midbrain, pons, and medulla were T2 hyperintense. Restricted diffusion was present in the entire cerebral cortex, posterior limb of the internal capsule, cerebellar white matter, brain stem, and spinal cord, but not in the cerebral hemispheric white matter. Repeat MRI at 5 months revealed that the cerebral mantle was reduced to a thin rim. In the frontal region, the cortex and white matter were still distinguishable and both thin. The posterior horns of the ventricles were highly dilated. The size of the basal ganglia, brain stem, and cerebellum was relatively preserved; the thalamus had become small. The abnormal blood vessels had largely disappeared. Many white matter tracts were abnormal in signal. Diffusion restriction was present in the central cerebral white matter, posterior limbs of the internal capsule, inferior cerebellar peduncles, and pyramids.
Figure 1. Prototype MRI for Group 1.
In patient LBSL285 at age 2 days, the cerebrum is hypoplastic (A and B). Numerous abnormal, tortuous blood vessels are seen at the surface (B). The cortex is hardly discernible from the white matter (B). Diffusion restriction is present in the cerebral cortex (diffusion-weighted image in D, ADC map in E). Tracts in the brainstem are affected; shown are the pyramids and inferior cerebellar peduncles (C), which also display diffusion restriction (F). On follow-up at 5 months, the cerebral mantle is reduced to a thin rim (G and H). The abnormal vessels are no longer visible (H). The pyramids and inferior cerebellar peduncles are still abnormal (I). Diffusion restriction is shown in the posterior limb of the internal capsule, cerebellar white matter, and brain stem tracts (diffusion-weighted images in J and L; ADC map in K).
Most patients in group 1 shared these MRI characteristics. They had severe cerebral hypoplasia and progressive atrophy on sequential MRIs. Subdural effusions were present in 4 patients. Numerous tortuous vessels were seen at the brain surface on early MRIs. LBSL281 and LBSL294 also displayed restricted diffusion in the cerebral cortex. Almost all patients had restricted diffusion in affected white matter tracts. MR spectroscopy revealed elevated white matter lactate in 1 of 2 patients. The MRI of LBSL284 at 3.9 years shared the cerebral atrophy but lacked all other abnormalities; no earlier MRI was available.
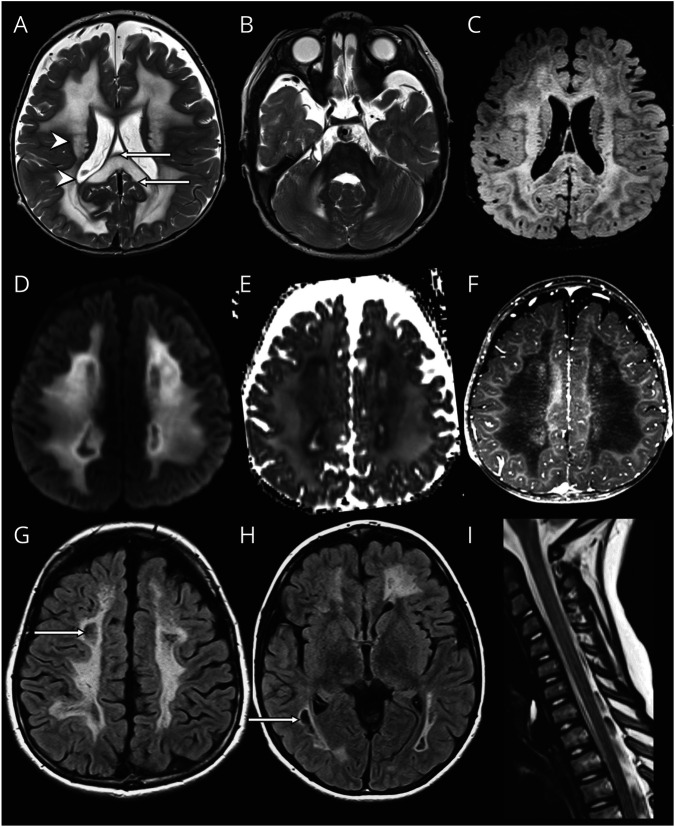
For group 2, MRIs of patient LBSL288 can be regarded as prototype (figure 2). The first MRI was obtained at 1.2 years. The deep cerebral white matter was homogeneously and symmetrically abnormal in signal; periventricular and subcortical rims were spared. FLAIR images revealed rarefaction of part of the abnormal cerebral white matter. The middle blade of the corpus callosum was affected; thin inner and outer blades were spared. The splenium was swollen and rarefied; the isthmus was less severely affected. Other structures with an abnormal signal intensity included posterior limbs of the internal capsule, middle cerebellar peduncles, and central cerebellar white matter. The brain stem and the spinal cord were spared. The cerebral white matter contained several small areas of contrast enhancement. MR spectroscopy showed highly elevated white matter lactate. Diffusion restriction with low apparent diffusion coefficient (ADC) values was present in the deep cerebral white matter, surrounding rarefied regions. On follow-up MRI at 8.2 years, the cerebral white matter became more rarefied and cystic. No contrast enhancement was seen. Restricted diffusion remained present in nonrarefied abnormal white matter. The corpus callosum had become atrophic. The brain stem and cervical spinal cord remained unaffected.
Figure 2. Prototype MRI for Group 2.
In patient LBSL288 at age 1 year and 2 months, the cerebral white matter is rarefied but not cystic (FLAIR image in C). The directly periventricular and directly subcortical rims are unaffected (arrowheads in A), and the middle blade of the corpus callosum is affected, whereas the inner and outer blades are spared (arrows in A). There is no brainstem involvement (B). The area directly adjacent to the rarefied white matter shows restricted diffusion (diffusion-weighted image in D, ADC map in E) and enhancement after contrast (F). On follow-up MRI at 8 years, rarefaction and cystic degeneration in white matter is present (arrows in FLAIR images in G and H). There is no spinal cord involvement (I).
Patients in group 2 shared most MRI characteristics. Rarefaction of abnormal cerebral white matter and involvement of the middle blade of the corpus callosum with sparing of inner and outer blades were common features. No contrast enhancement was observed. Strikingly, all patients, except LBSL280, lacked brain stem abnormalities typical of LBSL, whereas only 3 of 5 patients had long tract involvement in the spinal cord. LBSL280 had the most abnormal MRI with also striking involvement of the thalamus and globus pallidus.
DARS2 Variants
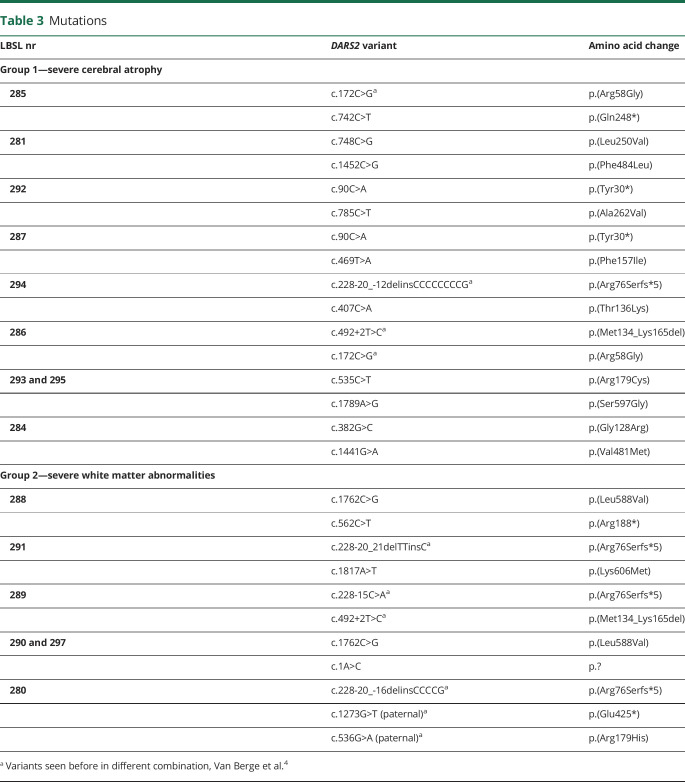
Table 3 and table e-3, links.lww.com/NXG/A376, provide details on DARS2 variants and corresponding constructed yeast variants.
Table 3.
Mutations
All patients were compound heterozygous confirmed by parental segregation analysis. None of the variant combinations observed in groups 1 and 2 have been reported before.4 Only 1 patient in group 1 (LBSL294) and 3 patients in group 2 (LBSL291, LBSL289, and LBSL280) had a classic intron 2 splice site variant. In groups 1 and 2, 3 and 2 variants, respectively, were observed causing a premature stop. The c.492+2T>C variant occurred once in both groups. One variant in group 2 (c.1A>C, p.?) altered the DARS2 start codon and likely affects mtAspRS synthesis due to less efficient initiation.17,18 There were 10 and 3 unique missense variants in group 1 and group 2, respectively. Two missense variants occurred twice. Patient LBSL280 had 3 DARS2 variants; the predictions for the missense variant were not considered when comparing groups 1 and 2, as it was present on an allele with an upstream nonsense variant. The missense variants tended to have worse predicted Russell scores for group 1 than for group 2, indicating more disruptive nature of the variants.
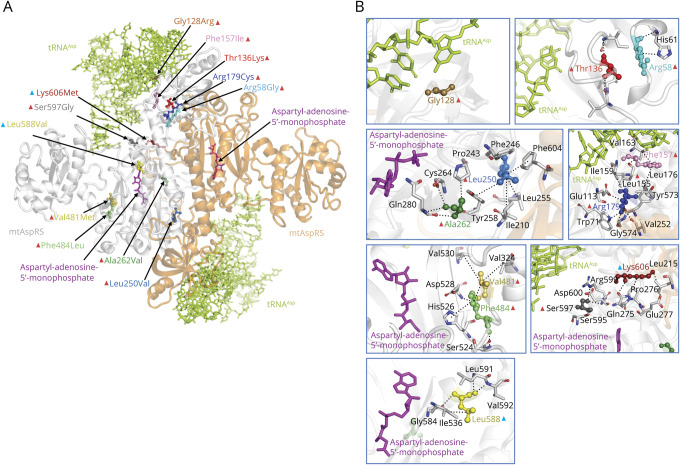
Effects of individual missense variants were assessed by examining interspecies conservation of affected residues, their location on mtAspRS protein structure and possible relevance with functional regions, and predicted structural effects by free energy change (ΔΔG) calculations (table e-3, links.lww.com/NXG/A376). The ΔΔG of almost all missense variants significantly differs from zero, indicating that they cause structural alterations that are likely pathogenic. Figure 3 shows the location of missense variants on the mtAspRS crystal structure, onto which tRNAAsp and the aspartyl-adenylate substrate have been complexed by homology modeling. All missense variants hit regions involved in tRNAAsp binding (Arg58Gly, Gly128Arg, Thr136Lys, Phe157Ile, Arg179Cys, and Ser597Gly) or near the catalytic region as suggested by their proximity to the bound aspartyl-adenylate (Leu250Val, Ala262Val, Val481Met, Phe484Leu, Leu588Val, and Ser597Gly) and/or the homodimerization interface (Arg179Cys, Leu250Val, Ala262Val, and Lys606Met). Group 1 variants occur close to or within the tRNAAsp binding region or have a considerable structural effect near the aspartyl-adenylate binding site (table e-3, links.lww.com/NXG/A376). By contrast, the predicted effects of group 2 variants are less severe. The Leu588Val variant is predicted to decrease stability of the local protein structure, which may affect the nearby aspartyl-adenylate binding site. Nevertheless, the leucine to valine amino acid change is quite conservative and the protein may preserve its main fold and function. The Lys606Met replacement may produce a hydrophobic interaction with Leu215 and stabilize the formation of mtAspRS homodimers that are important for tRNA synthetase activity.
Figure 3. Mapping of the Missense Variants on mtAspRS Structure.
(A) Crystal structure of mtAspRS homodimer (PDB 4AH6; the mtAspRS monomers are in white and orange transparent ribbons) with the sites of missense variants. The text color of each variant corresponds with the color of the variant depicted in the crystal structure. Red and blue triangles indicate missense variants for group 1 and 2, respectively. (B) Close-up views around protein sites hit by the missense mtAspRS variants. Noncovalent interactions between the affected amino acids and surrounding residues are indicated with dotted lines. mtAspRS protein is represented in its homodimeric form (monomers in transparent white and orange ribbons) complexed with tRNAAsp (green) and aspartyl-adenosine-5′-monophosphate (magenta).
Functional Studies in Yeast
We investigated the functional consequences of missense variants on mitochondrial metabolism in yeast using the DARS2 orthologous gene MSD1, in which a wild-type residue has been substituted with the corresponding one found in patients. Splice site, start codon, and nonsense variants were not investigated.
Regarding the 6 missense variants affecting conserved residues (Leu250, Phe484, Ala262, Arg179, Ser597, and Lys606 corresponding to yLeu232, yPhe487, yAla244, yArg157, ySer617, and yLys626, respectively), the yeast MSD1 codons were directly mutated, producing the pathologic allele. For the 4 variants affecting nonconserved residues located in an otherwise conserved stretch (Arg58, Phe157, Val481, and Leu588 corresponding to yLys42, yAla136, yIle484, and yMet608, respectively), the yeast amino acid was replaced by the human wild-type mtAspRS amino acid to serve as humanized control. Subsequently, the variants were introduced at these amino acids and results obtained with these yeast strains were compared with their humanized controls. The remaining 2 variants (Thr136 and Gly128, corresponding to yAla115 and y-) were located in poorly conserved regions and therefore not investigated.
The yeast mutant alleles and the humanized controls were expressed in a yeast strain deleted of MSD1 (∆msd1) that failed to grow in medium containing oxidative carbon sources. The ability to grow in the presence of respiratory substrates (ethanol) at 28°C was first analyzed (data not shown). The humanized MSD1 alleles (msd1Lys42Arg, msd1Ile484Val, and msd1Met608Leu) rescued the absence of MSD1. By contrast, the oxidative growth of both the humanized msd1Ala136Phe allele and the corresponding mutant msd1Phe136Ile was compromised and therefore not further assessed.
The oxidative growth ability of the strains expressing the msd1Leu232Val, msd1Phe487Leu, msd1Arg157Cys, msd1Ser617Gly, and msd1Leu608Val variants was severely affected, whereas the msd1Ala244Val variant led to a mild reduction of growth. The growth of the strains expressing msd1Arg42Gly, msd1Lys626Met, and msd1Val484Met was similar to that of wild type. However, incubation at 37°C revealed a severe growth defect for the msd1Val484Met strain, indicating that a change in this position affects mitochondrial function in yeast in a temperature-sensitive manner.
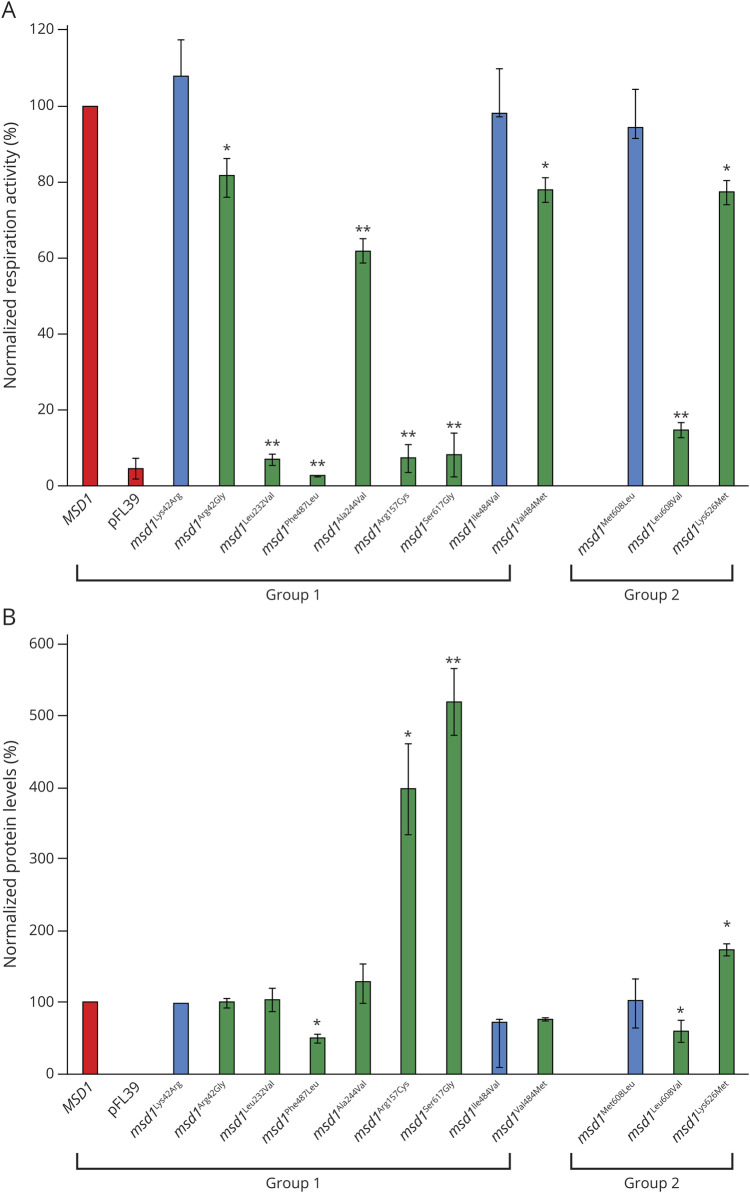
To further investigate the effect of variants on oxidative phosphorylation, the respiratory activity was measured (figure 4A). In agreement with the oxidative growth phenotype, the strains expressing msd1Leu232Val, msd1Phe487Leu, msd1Arg157Cys, msd1Ser617Gly, and msd1Leu608Val were unable to consume oxygen like the null ∆msd1 mutant, whereas the expression of the msd1Ala244Val allele induced a ∼40% reduction of the respiratory rate compared with the wild-type strain.
Figure 4. (A) Normalized Respiration Activity in Wild-Type and Mutant MSD1 Strains.
Cells were grown at 28°C in SC medium without tryptophan supplemented with 0.6% glucose. Values were normalized to the MSD1 wild-type strain and represented as the mean of at least three values ±SD. (B) Normalized MSD1 protein levels in wild-type and mutant MSD1 strains. Msd1-HA protein levels were determined with Western blot and normalized to Por1 levels. The MSD1:Por1 ratios were normalized to the ratio found in the wild-type strain. Analysis was performed on 3 independent clones for each strain at 28°C. Graphs show average ± SD. Statistical analysis was performed using analysis of variance with Bonferroni correction **p < 0.01, *p < 0.05. Blue bars indicate humanized alleles. MSD1, wild-type; pFL39, empty vector. From left to right in group 1, yLys42Arg/yArg42Gly, yLeu232Val, yPhe487Leu, yAla244Val, yArg157Cys, ySer617Gly, and yIle484Val/yVal484Met correspond to the human mutations Arg58Gly, Leu250Val, Phe484Leu, Ala262Val, Arg179Cys, Ser597Gly, and Val481Met, respectively. From left to right in group 2, yMet608Leu/yLeu608Val and yLys626Met correspond to human mutations Leu588Val and Lys606Met, respectively.
Although not displaying reduced oxidative growth, msd1Lys626Met, msd1Val484Met, and msd1Arg42Gly did reveal a reduction of oxygen consumption (∼25%, 15%, and 20%, respectively). The msd1Val484Met mutant also displayed a severe respiratory rate defect at 37°C (data not shown), which was in accordance with the observed growth defect.
Western blot analysis (figure 4B) showed decreased level of the mutant protein expressed by msd1Phe487Leu (∼50%) and msd1Leu608Val (∼40%), suggesting that for these mutants, the mitochondrial defect could be due to protein instability. For 3 mutants, msd1Arg157Cys, msd1Ser617Gly, and msd1Lys626Met, the results obtained demonstrated a significant protein level increase (4-, 5-, and 2-fold, respectively) compared with wild type. Because the corresponding mRNA level was similar to that of the wild type (data not shown), the difference in protein accumulation is not easily explained by increased gene expression, but is more likely due to increased protein stability and/or increased levels of protein synthesis. For the 4 other variants (msd1Arg42Gly, msd1Leu232Val, msd1Ala244Val, and msd1Val484Met), no differences in protein accumulation were observed. Despite increased or normal Msd1 expression, the mutant Msd1 proteins were incapable of supporting mitochondrial respiration activity.
Discussion
We describe 2 groups of patients with LBSL with MRI patterns distinct from the known LBSL pattern. Patients with classic LBSL with childhood to adult onset almost invariably display distinctive brain stem and spinal cord tract abnormalities on MRI. Neonatal- and early infantile-onset forms have been described with MRIs still displaying the characteristic brain stem and spinal cord tract involvement. We further broaden the LBSL disease spectrum by describing antenatal and early infantile onset with highly atypical MRI findings. Patients in group 1 had profound microcephaly, lack of development, and MRIs dominated by dramatic cerebral hypoplasia and atrophy. Clinical features were more variable in group 2; MRIs were dominated by cerebral white matter abnormalities and often lacked the brainstem abnormalities typical of LBSL.
Almost all patients with LBSL described until now have compound heterozygous DARS2 variants, with 95% of the cases having an intron 2 splice site variant.4 This variant is leaky, leading to the production of some normal protein, probably guaranteeing a reasonable remaining mtAspRS function.2 Except for 4 patients, patients in groups 1 and 2 lacked such leaky splice site variant. The combination of variants on both alleles probably determines the remaining mtAspRS activity within each cell and predictions based on a single variant would therefore be of limited value in predicting disease severity. However, the observation of fewer intron 2 splice site variants and a lower Russell score in group 1 is in line with the more severe phenotype compared with group 2.
All missense variants in group 1 examined by crystal structure mapping were predicted to cause structural defects in crucial functional regions (e.g., catalytic and/or tRNAAsp binding regions). Some variants observed in group 1 (e.g., Arg58Gly and Gly128Arg) were associated with minor negative ∆∆G values, although it must be considered that the calculations did not take protein-bound ligands into account. Therefore, their severe effect in patients can be the consequence of an altered affinity for the tRNAAsp ligand. Variants in group 2 were predicted to have less severe effects on ligand binding or protein structure than the variants in group 1.
Thus, the genetic and structural analyses suggest that the 2 different phenotypic severities can be discriminated by the presence of 2 heavily damaged alleles (group 1) and only 1 severely damaged allele plus an allele with a partially active protein product (group 2, i.e., the missense variants Leu588Val and Lys606Met and the splice site variants).
Comparing the effects of the variants of groups 1 and 2 on yeast mitochondrial function, the results do not fully explain the difference in phenotype. Variants from both groups reduce oxidative growth and respiratory chain activity severely, moderately or mildly. Not all functional yeast results agree with predictions from the structural analyses in human and bacterial orthologs and phenotypes of the patients. For example, the Leu588Val variant in group 2 shows severe effects on function in yeast, whereas the predicted effects on protein structure and the phenotype of the patients (LBSL288, LBSL290, and LBSL297) suggest a less detrimental effect on the protein function. The opposite holds true for the Arg58Gly variant in group 1. This variant, occurring in a stretch of poorly conserved amino acids, may have mild effects on protein stability and mitochondrial function in yeast, whereas in humans, the impact of this variant is severe based on the phenotype of patients LBSL285 and LBSL286. These discrepancies may be explained by differences in amino acid composition and structure in these regions between the human, bacterial and yeast proteins influencing their sensitivity to the variants.
The MRI findings have implications for understanding the pathophysiology of LBSL. Because of the preferential long tract involvement, primary axonal disease was already hypothesized at disease definition.1 In vitro studies further supported this hypothesis, revealing that intron 2 splice site variants had a greater effect on exon 3 exclusion in neural cells than in non-neural cells, and a greater effect for neuronal cells than glial cells.19 In addition, correct inclusion of exon 3 in the normal mtAspRS mRNA occurred less efficiently in neural cells than non-neural cells, and this effect was again more pronounced in neuronal cells than glial cells.19 The combined effects may explain the selective vulnerability of axonal tracts in LBSL. In 2 group 1 patients, diffuse cerebral cortex diffusion restriction was documented, before development of profound cerebral atrophy, indicating massive neuronal cell death. Most likely, the initial cerebral hypoplasia is already caused by neuronal cell death during development; the hypoplasia is subsequently superseded by almost total atrophy. It remains unclear why cerebral cortex neurons are specifically vulnerable and neurons in the basal nuclei, thalami, and cerebellum are less affected.
Neuronal and axonal vulnerability does not fully explain the full LBSL disease spectrum. Diffusion restriction of the cerebral cortex and severe cerebral atrophy are not observed in group 2. A striking cerebral white matter disease is seen, but the typical LBSL brain stem tract abnormalities are absent in all patients but one, who is also otherwise exceptional. These observations suggest that not all patients have predominant axonal or neuronal disease.
Diffusion restriction in affected white matter structures is a well-known feature of LBSL. Previous studies indicate that the diffusion restriction is caused by intramyelinic water accumulation and myelin microvacuolization, most likely caused by glial pathology.20,21 It is typically seen in the periphery of the abnormal white matter, not specifically in tracts, and the location changes over time, indicating moving water compartments.20 In both groups 1 and 2, diffusion restriction in affected white matter structures was observed. Lack of diffusion restriction in the cerebral white matter on very early MRIs, contrasting with the presence of diffusion restriction in brain stem structures, is explained by the absence vs presence of myelin at that early stage of brain development.
Recently, different TUBB4A variants were shown to cause defects in different cell types (i.e., primary neuronal, primary glial, or combined), correlating with specific clinical and MRI phenotypes.22 The explanation for the different phenotypes caused by different DARS2 variants may be similar. Two conditional knockout mouse models were recently generated, in which either neurons or oligodendrocytes were depleted of mtAspRS. Cell-specific depletion was chosen because general mtAspRS knockouts are not viable.23,24 Mitochondrial dysfunction and subsequently massive apoptosis occurred soon after neuron-specific mtAspRS depletion.23 Of interest, oligodendrocyte-specific mtAspRS depletion led to mitochondrial dysfunction but not apoptosis.23 These findings indicate that cell-specific mtAspRS depletion results in different outcomes.
In group 1, we therefore hypothesize predominant neuronal pathology, leading to cerebral cortex degeneration and severe atrophy, with a component of glial pathology, leading to diffusion restriction in white matter structures. In group 2, we hypothesize predominant glial pathology, leading to cerebral white matter disease with diffusion restriction, whereas neuronal and axonal pathology is less clear and involvement of brainstem tracts is exceptional, although we cannot exclude that the typical brainstem abnormalities develop later and were missed due to lack of longer MRI follow-up. Two patients indicate considerable variation within the groups. Patient LBSL284 had evident cerebral atrophy, although less dramatic than other patients in group 1, but lacked white matter abnormalities on MRI. Patient LBSL280 was the only patient in group 2 with evident brainstem tract involvement, while also having severe cerebral white matter, thalamus, and basal ganglia abnormalities. These patients stress that variants may indeed have a more variable, milder, or mixed cell-type effect.
Finally, the numerous tortuous vessels at the brain surface in early disease stages in group 1 require some discussion. We are unaware of a noncanonical function of mtAspRS affecting neovascularization. Secondary neovascularization may be more likely and is perhaps related to the dramatic cortical neuronal cell death or profound energy deficiency related to cortical mitochondrial dysfunction and energy depletion. In MoyaMoya disease, for example, the ongoing ischemia has been reported to cause overexpression of proangiogenic factors.25 A similar appearance of the cerebral arteries is seen in Menkes disease,26 characterized by subacute cerebral cortex degeneration and profound atrophy,27 and of the cerebellar arteries in NUBPL variants, characterized by subacute cerebellar cortex degeneration and severe atrophy28; both disorders are related to mitochondrial dysfunction.
In conclusion, this study expands the knowledge of the phenotypic spectrum caused by biallelic pathogenic DARS2 variants, which are typically associated with a relatively mild leukodystrophy and characteristic long tract abnormalities on MRI. New are 2 early-onset severe phenotypes associated either with profound cerebral atrophy or with a severe leukodystrophy without long tract involvement. We found that most related DARS2 variants likely impair mtAspRS expression or its interactions with ligands. Missense variants were modeled in yeast and shown to affect mitochondrial function. We observed some association between location of variants in specific mtAspRS subdomains or residual mitochondrial function and patients' phenotypes (groups 1 and 2). Although there is evidence of axonal disease in classic LBSL, severe cerebral atrophy in group 1 points at neuronal apoptosis, both involving the same cell type. Severe leukodystrophy without atrophy and without long tract involvement in group 2 points at primary glial pathology. The underlying mechanisms of different DARS2 variants leading to either dominant neuronal or dominant glial pathology need further investigation.
Acknowledgment
E.S. Bertini and M.S. Van der Knaap are members of the European Reference Network for Rare Neurological Diseases - Project ID No 739510. Cas Simons at the Murdoch Children's Research Institute and Richard Leventer and Jeremy Freeman at the Royal Children's Hospital Melbourne Australia are acknowledged for their clinical and bioinformatic contributions. Dr. Good and Dr. Superti-Furga are acknowledged for contributing to the diagnosis of patient LBSL281.
Glossary
- ADC
apparent diffusion coefficient
- LBSL
Leukoencephalopathy with brainstem and spinal cord involvement and lactate elevation
- mtAspRS
mitochondrial Aspartyl tRNA synthetase
- PDB
Protein Data Bank
- SC
synthetic complete
- WES
whole-exome sequencing
Appendix. Authors
Contributor Information
Menno D. Stellingwerff, Email: m.stellingwerff@amsterdamumc.nl.
Sonia Figuccia, Email: sonia.figuccia@studenti.unipr.it.
Emanuele Bellacchio, Email: emanuele.bellacchio@opbg.net.
Karin Alvarez, Email: karinalvarezvalenzuela@gmail.com.
Claudia Castiglioni, Email: castiglionic@gmail.com.
Pinar Topaloglu, Email: pinartopaloglu2000@yahoo.com.
Chloe A. Stutterd, Email: chloe.stutterd@vcgs.org.au.
Corrie E. Erasmus, Email: corrie.erasmus@radboudumc.nl.
Amarilis Sanchez‐Valle, Email: asanche6@usf.edu.
Sebastien Lebon, Email: sebastien.lebon@chuv.ch.
Sarah Hughes, Email: sarah.hughes@royalberkshire.nhs.uk.
Thomas Schmitt-Mechelke, Email: thomas.schmitt@luks.ch.
Gessica Vasco, Email: gessica.vasco@opbg.net.
Gabriel Chow, Email: gabby.chow@nuh.nhs.uk.
Elisa Rahikkala, Email: elisa.rahikkala@ppshp.fi.
Cristina Dallabona, Email: cristina.dallabona@unipr.it.
Cecilia Okuma, Email: cecilia.okuma@gmail.com.
Chiara Aiello, Email: chiara.aiello@opbg.net.
Paola Goffrini, Email: paola.goffrini@unipr.it.
Truus E.M. Abbink, Email: g.abbink@amsterdamumc.nl.
Enrico S. Bertini, Email: enricosilvio.bertini@opbg.net.
Study Funding
This study was supported in part by a grant from Ricerca Corrente of the Italian Ministry of Health to ESB and grant RF-2016-02361241 from the Italian Ministry of Health to PG and ESB. The study has benefited from the equipment and framework of the COMP-HUB Initiative, funded by the Departments of Excellence program of the Italian Ministry for Education, University and Research (MIUR, 2018–2022). CAS was supported by the RCH/MCRI Flora Suttie Neurogenetics Fellowship made possible by the Macquarie and Thyne-Reid Foundations.
Disclosure
The authors report no disclosures relevant to the manuscript. Go to Neurology.org/NG for full disclosures.
References
- 1.van der Knaap MS, van der Voorn P, Barkhof F, et al. A new leukoencephalopathy with brainstem and spinal cord involvement and high lactate. Ann Neurol 2003;53:252–258. [DOI] [PubMed] [Google Scholar]
- 2.Scheper GC, van der Klok T, van Andel RJ, et al. Mitochondrial aspartyl-tRNA synthetase deficiency causes leukoencephalopathy with brain stem and spinal cord involvement and lactate elevation. Nat Genet 2007;39:534–539. [DOI] [PubMed] [Google Scholar]
- 3.Steenweg ME, van Berge L, van Berkel CG, et al. Early-onset LBSL: how severe does it get? Neuropediatrics 2012;43:332–338. [DOI] [PubMed] [Google Scholar]
- 4.van Berge L, Hamilton EM, Linnankivi T, et al. Leukoencephalopathy with brainstem and spinal cord involvement and lactate elevation: clinical and genetic characterization and target for therapy. Brain 2014;137:1019–1029. [DOI] [PubMed] [Google Scholar]
- 5.Labauge P, Dorboz I, Eymard-Pierre E, Dereeper O, Boespflug-Tanguy O. Clinically asymptomatic adult patient with extensive LBSL MRI pattern and DARS2 mutations. J Neurol 2011;258:335–337. [DOI] [PubMed] [Google Scholar]
- 6.Miyake N, Yamashita S, Kurosawa K, et al. A novel homozygous mutation of DARS2 may cause a severe LBSL variant. Clin Genet 2011;80:293–296. [DOI] [PubMed] [Google Scholar]
- 7.van Berge L, Kevenaar J, Polder E, et al. Pathogenic mutations causing LBSL affect mitochondrial aspartyl-tRNA synthetase in diverse ways. Biochem J 2013;450:345–350. [DOI] [PubMed] [Google Scholar]
- 8.van der Knaap MS, Breiter SN, Naidu S, Hart AA, Valk J. Defining and categorizing leukoencephalopathies of unknown origin: MR imaging approach. Radiology 1999;213:121–133. [DOI] [PubMed] [Google Scholar]
- 9.Betts MJ, Lu Q, Jiang Y, et al. Mechismo: predicting the mechanistic impact of mutations and modifications on molecular interactions. Nucleic Acids Res 2015;43:e10. [DOI] [PMC free article] [PubMed] [Google Scholar]
- 10.Schymkowitz J, Borg J, Stricher F, Nys R, Rousseau F, Serrano L. The FoldX web server: an online force field. Nucleic Acids Res 2005;33:W382–W388. [DOI] [PMC free article] [PubMed] [Google Scholar]
- 11.Kaiser CM S; Mitchell A. Methods in Yeast Genetics. A Laboratory Course Manual. New York: Cold Spring Harbor Laboratory Press; 1994. [Google Scholar]
- 12.Bonneaud N, Ozier-Kalogeropoulos O, Li GY, Labouesse M, Minvielle-Sebastia L, Lacroute F. A family of low and high copy replicative, integrative and single-stranded S. cerevisiae/E. coli shuttle vectors. Yeast 1991;7:609–615. [DOI] [PubMed] [Google Scholar]
- 13.Gietz RD, Schiestl RH. High-efficiency yeast transformation using the LiAc/SS carrier DNA/PEG method. Nat Protoc 2007;2:31–34. [DOI] [PubMed] [Google Scholar]
- 14.Wach A, Brachat A, Pohlmann R, Philippsen P. New heterologous modules for classical or PCR-based gene disruptions in Saccharomyces cerevisiae. Yeast 1994;10:1793–1808. [DOI] [PubMed] [Google Scholar]
- 15.Goffrini P, Ercolino T, Panizza E, et al. Functional study in a yeast model of a novel succinate dehydrogenase subunit B gene germline missense mutation (C191Y) diagnosed in a patient affected by a glomus tumor. Hum Mol Genet 2009;18:1860–1868. [DOI] [PubMed] [Google Scholar]
- 16.Del Dotto V, Fogazza M, Musiani F, et al. Deciphering OPA1 mutations pathogenicity by combined analysis of human, mouse and yeast cell models. Biochim Biophys Acta Mol Basis Dis 2018;1864:3496–3514. [DOI] [PubMed] [Google Scholar]
- 17.Mehdi H, Ono E, Gupta KC. Initiation of translation at CUG, GUG, and ACG codons in mammalian cells. Gene 1990;91:173–178. [DOI] [PubMed] [Google Scholar]
- 18.Kearse MG, Wilusz JE. Non-AUG translation: a new start for protein synthesis in eukaryotes. Genes Dev 2017;31:1717–1731. [DOI] [PMC free article] [PubMed] [Google Scholar]
- 19.van Berge L, Dooves S, van Berkel CG, Polder E, van der Knaap MS, Scheper GC. Leukoencephalopathy with brain stem and spinal cord involvement and lactate elevation is associated with cell-type-dependent splicing of mtAspRS mRNA. Biochem J 2012;441:955–962. [DOI] [PubMed] [Google Scholar]
- 20.Steenweg ME, Pouwels PJ, Wolf NI, van Wieringen WN, Barkhof F, van der Knaap MS. Leucoencephalopathy with brainstem and spinal cord involvement and high lactate: quantitative magnetic resonance imaging. Brain 2011;134:3333–3341. [DOI] [PubMed] [Google Scholar]
- 21.Yamashita S, Miyake N, Matsumoto N, et al. Neuropathology of leukoencephalopathy with brainstem and spinal cord involvement and high lactate caused by a homozygous mutation of DARS2. Brain Dev 2013;35:312–316. [DOI] [PubMed] [Google Scholar]
- 22.Curiel J, Rodriguez Bey G, Takanohashi A, et al. TUBB4A mutations result in specific neuronal and oligodendrocytic defects that closely match clinically distinct phenotypes. Hum Mol Genet 2017;26:4506–4518. [DOI] [PMC free article] [PubMed] [Google Scholar]
- 23.Aradjanski M, Dogan SA, Lotter S, et al. DARS2 protects against neuroinflammation and apoptotic neuronal loss, but is dispensable for myelin producing cells. Hum Mol Genet 2017;26:4181–4189. [DOI] [PubMed] [Google Scholar]
- 24.Nemeth CL, Tomlinson SN, Rosen M, et al. Neuronal ablation of mt-AspRS in mice induces immune pathway activation prior to severe and progressive cortical and behavioral disruption. Exp Neurol 2020;326:113164. [DOI] [PMC free article] [PubMed] [Google Scholar]
- 25.Rupareliya C, Lui F. Moyamoya Disease. StatPearls. Treasure Island, 2019. [PubMed] [Google Scholar]
- 26.Manara R, D'Agata L, Rocco MC, et al. Neuroimaging changes in Menkes disease, part 1. AJNR Am J Neuroradiol 2017;38:1850–1857. [DOI] [PMC free article] [PubMed] [Google Scholar]
- 27.Barkovich AJ, Good WV, Koch TK, Berg BO. Mitochondrial disorders: analysis of their clinical and imaging characteristics. AJNR Am J Neuroradiol 1993;14:1119–1137. [PMC free article] [PubMed] [Google Scholar]
- 28.Kevelam SH, Rodenburg RJ, Wolf NI, et al. NUBPL mutations in patients with complex I deficiency and a distinct MRI pattern. Neurology 2013;80:1577–1583. [DOI] [PMC free article] [PubMed] [Google Scholar]
Associated Data
This section collects any data citations, data availability statements, or supplementary materials included in this article.
Data Availability Statement
Anonymized data will be shared by request from any qualified investigator.


