

Abstract
Objective
To quantify the percent volume of dilated perivascular space (PVS) in the subcortical forebrain in patients with early Huntington disease (HD) and to explore the relationship between PVS and disease severity.
Methods
MRI scans were performed on 25 patients with HD and 23 healthy age-matched controls at Massachusetts General Hospital. The imaging data were analyzed with a novel algorithm to determine regional PVS volume. A fractional logistic regression analysis was used to quantify the association between regional percent PVS volume and (1) disease designation (HD or control) and (2) disease severity as assessed by normalized caudate volume.
Results
Patients with HD had the greatest percent volume of dilated PVS in the putamen (left putamen: odds ratio 2.06 [95% confidence interval (CI) 1.62–2.62], HD 3.27% [95% CI 2.83–3.78] vs controls 1.62% [95% CI 1.32–1.97], pfdr < 0.001; right putamen: odds ratio 1.66 [95% CI 1.33–2.08], HD 3.43% [95% CI 2.94–4.01] vs controls 2.09% [95% CI 1.79–2.45], pfdr < 0.001) and several subcortical white matter regions compared to controls. Dilated PVS increased with disease severity.
Conclusions
The objective quantification of dilated PVS suggests that PVS burden is high, is associated with disease severity, and may affect the distribution and success of treatments administered either intrathecally such as antisense oligonucleotides or by intraparenchymal administration such as cell and gene therapies.
Classification of Evidence
This study provides Class II evidence that increased dilated PVS is associated with worse HD severity. The study is rated Class II because of the cross-sectional design.
Perivascular spaces (PVSs), also known as Virchow-Robin spaces,1 are CSF-filled extensions of the subarachnoid space that accompany the vessels and arterioles penetrating the cerebral cortex. The physiologic role of PVS has been associated with drainage of brain interstitial fluid into perivascular pathways, the subarachnoid space, and the glymphatic drainage system.2,3 Increased and enlarged PVSs have been shown to be correlated with age in several neurodegenerative disorders.4
In this study, we tested the hypothesis that brain PVS burden would increase early in individuals with Huntington disease (HD) compared to healthy age-matched controls. Because there is a marked degeneration of the striatum by the time of an HD diagnosis and the caudate atrophy has been proposed as a surrogate measure of stage of disease,5 we anticipated that PVS load would be most evident in the structures of the basal ganglia and that a higher PVS burden would be associated with greater atrophy. In contrast, the thalamus undergoes little atrophy until later in the course of HD and might not have an increased PVS burden if it were caused by atrophy alone. Increases in PVS might affect the delivery and success of intrathecal treatments or intraparenchymal gene and cell therapies for patients with HD, which could drain futilely through PVS channels and out of targeted tissues. The quantification of PVS burden might therefore be a relevant factor in determining eligibility for experimental treatments involving direct brain or CSF delivery.
Methods
We aimed to test the hypotheses that (1) brain PVS burden would increase early in patients with HD compared to healthy age-matched controls and (2) an increased PVS burden would be associated with greater atrophy of caudate nucleus.
Standard Protocol Approvals and Patient Consents
Patients were recruited from the Massachusetts General Hospital HD Center of Excellence. Age-matched healthy controls were recruited with advertisements. Experimental procedures were explained and signed informed consent was obtained before participation. Protocols were approved by the Partners Institutional Review Board; the study was carried out in accordance with the Declaration of Helsinki.
MRI Acquisition
MRI brain scanning was performed on a 3T scanner (Siemens Medical, Erlangen, Germany): T1-weighted (T1-w) multiecho magnetization-prepared gradient echo (repetition time 2,530 milliseconds, inversion time 1,100 milliseconds, voxel size 1.0 mm3 isotropic) and T2-weighted (T2-w; repetition time 3,200 milliseconds, echo time 454 milliseconds, voxel size 1.0 mm3 isotropic) scans.
Image Analysis
A novel automated segmentation algorithm was used (figure 1) in which T1-w and T2-w images were bias corrected and then spatially coregistered. Image intensities were standardized with the following linear scaling equation:
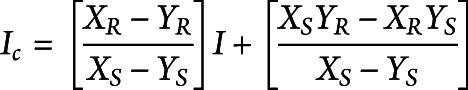 |
where I and Ic denote images before and after linear scaling. XS and YS represent the distribution peaks of intensities in the white matter (WM) and lateral ventricle extracted from the registered bias-corrected T1-w or T2-w image. XR and YR (defined as XR = 200 and YR = 100; XR = 200 and YR = 300) were the standardized values of the WM and CSF of the corresponding image. To optimize the contrast between WM and CSF, the T2:T1 ratio was calculated from the calibrated T2-w and T1-w images. Voxels of PVS in regions of interest (FreeSurfer, version 5.3) were determined by use of the T2:T1 ratio beyond the peak of gray matter exceeding 3 SDs above the averaged T2:T1 ratio of neighboring voxels. The volume of PVS was normalized to the volume of the brain region as the percent dilated PVS (pPVS).
Figure 1. Quantification of Dilated PVS.

(A) Schematic diagram showing the algorithm used to derive the volume of dilated perivascular space (PVS). The procedure included (1) bias correction, (2) spatial registration of T1-weighted (T1-w) and T21-weighted (T2-w) images, (3) mask definition of white matter (WM) and ventricles, (4) intensity standardization, (5) definition and binary mask generation of PVS, (6) registration of the PVS binary mask to FreeSurfer space, and (7) extraction of PVS volume in basal ganglia and WM. (B) Distribution of PVS extracted with our automated algorithm in the basal ganglia and subcortical WM overlaid on the averaged high-resolution T1-w images in the group with Huntington disease (HD) and control the group. T1-w images of the HD group show significant atrophy of the caudate relative to control group. Color in each voxel represents the percentage of patients in the group having dilated PVS in that particular voxel. Increased numbers of patients in the HD group have dilated PVS in the putamen, temporal, and parietal WM regions.
Statistical Analysis
Continuous variables were summarized as median and interquartile range. Diagnostic group (HD and control) differences were assessed with the Kruskal-Wallis test. Categorical variables were summarized as frequencies and percentages; group differences were assessed with the χ2 test. To quantify the association between the proportion PVS in region r and group, a fractional logistic regression model was constructed in which pPVS in region r was regressed on group and a linear coding of age. Percent PVS estimates and their 95% confidence intervals (CIs) were computed for each group, and odds ratios (95% CIs) were computed to summarize age-adjusted group comparisons. To account for multiple comparisons, false discovery rate–adjusted p values were also computed.6 For regions with a small proportion of PVS, a secondary analysis was performed in which the indicator of any PVS vs no PVS was regressed onto group and age with the Firth bias-reduced logistic regression. Results were similar to the primary analysis and are available from the authors. A similar analysis was performed in which pPVS was regressed on a linear coding of normalized caudate volume. All analyses were performed with R3.5.2 (R-project).
Data Availability
Summary data will be shared by reasonable formal request from qualified researchers, subject to a data-sharing agreement and in compliance with the requirements of the funding bodies and institutions.
Results
Twenty-five patients with HD and 23 healthy age-matched controls were recruited. The average ages were 50 (interquartile range 46–59) and 48 (43–51) years in the HD and control groups, respectively. Groups were similar with respect to age and sex. Fifty-six percent of the patients with HD were female; 48% of controls were female. Patients with HD were in stage 1 or 27 with an average CAG repeat length of 43 (42–44), an average disease burden score of 359 (319–423), and an average total functional capacity score of 10 (9–11).
Compared to controls, patients with early HD had increased PVS burden in putamen and subcortical WM, including that of the insula, caudal middle frontal, postcentral, inferior parietal, inferior middle and superior temporal, and pars triangularis (figure 2A and the table). For example, the odds of having greater PVS burden in the left putamen was 2.06 (95% CI 1.62–2.62) times greater among patients with HD after adjustment for age. The corresponding percent PVS estimates were 3.27% (2.83%–3.78%) among patients with early HD and 1.62 (1.32–1.97) among controls.
Figure 2. Regional Analysis of Dilated PVS.
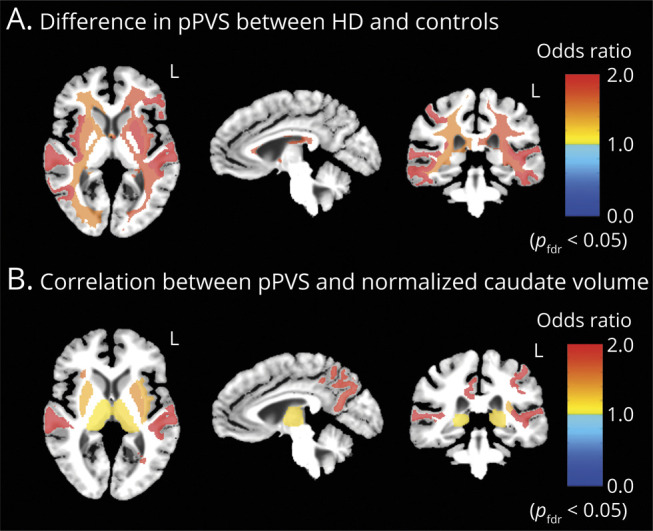
(A) Regional brain maps showing areas with significant differences in percent perivascular space (pPVS) between the group with Huntington disease (HD) and the control group after adjustment for age, corrected at pfdr < 0.05. Odds ratios >1 in the maps represent a meaningful increase in pPVS in the HD group and vice versa when odds ratio is <1. (B) Regional brain maps showing areas with significant correlations between pPVS and normalized caudate volume in patients with HD, corrected at pfdr < 0.05. Odds ratios >1 in the maps represent an increase in pPVS for each 0.01-unit decrease in normalized caudate volume and vice versa when odds ratio is <1.
Table.
Associations Between pPVS and Diagnostic Group (HD vs Control) by Hemisphere After Adjustment for Age

An inverse relationship was observed between caudate volume and PVS in the putamen, thalamus, insula WM, precuneus WM, posterior cingulate WM, and lateral-orbito-frontal WM (figure 2B). This suggests that PVS burden increases with disease severity.
Discussion
Using a novel algorithm to quantify PVS burden in HD, we found evidence of significantly increased PVS load not only in the basal ganglia but also in subcortical WM regions, many underlying cortical areas previously shown to preferentially atrophy in HD.5 Elevated PVS burden might suggest significant changes in perfusion and possible compromise of the blood-brain barrier in HD or other neurovascular changes9; studies in transgenic mouse models have demonstrated that chronic mutant huntingtin expression alters the neurovasculature, resulting in reduced cerebral blood flow,10 a compromised glymphatic system, and increased blood-brain barrier permeability.11 Increased PVS burden could also reflect neuroinflammation due to prolonged relative hypoxia or altered clearance of inflammatory cells and exudates from the brain3 or increased CO2 accumulation, resulting in microglial activation and setting into play a cascade of events that eventually lead to neuronal loss. The distribution of increased PVS in subcortical WM regions also raises the possibility that neurovascular changes underlie WM alterations in HD.9 The larger PVS burden in both subcortical WM and the putamen in individuals with smaller caudate volumes also suggests that greater PVS burden is progressive. More significant increases in the putamen than in the caudate might be due in part to the profound atrophy of the caudate, making accurate quantification of PVS difficult, or to technical limitations associated with accounting for partial volume effects. Because a compromised blood-brain barrier or altered glymphatic system might affect the delivery and success of intrathecal treatments such as antisense oligonucleotides or intraparenchymal gene and cell therapies for patients with HD, which could drain futilely through PVS channels and out of targeted tissues, the quantifications of PVS burden might provide a means of assessing PVS development as HD progresses and potentially serve as a relevant factor in determining eligibility for treatment.
Glossary
- CI
confidence interval
- HD
Huntington disease
- pPVS
percent dilated PVS
- PVS
perivascular space
- T1-w
T1-weighted
- T2-w
T2-weighted
- WM
white matter
Appendix. Authors
Footnotes
Class of Evidence: NPub.org/coe
Study Funding
The research was supported by the NIH (R21-229952), the Dake Family foundation, and Voyager Therapeutics.
Disclosure
Drs. Chan, Mercaldo, and Rosas report no conflicts of interest. Dr. Hersch is currently an employee at Voyager Therapeutics. Dr. Ravina was employed by Voyager Therapeutics at the time the work was performed. Go to Neurology.org/N for full disclosures.
References
- 1.Robin C. Recherches sur quelques particularites de la structure des capillaires de l'encephale. J Physiol Homme Anim 1859;2:537–548. [Google Scholar]
- 2.Louveau A, Smirnov I, Keyes TJ, et al. Structural and functional features of central nervous system lymphatic vessels. Nature 2015;523:337–341. [DOI] [PMC free article] [PubMed] [Google Scholar]
- 3.Wuerfel J, Haertle M, Waiczies H, et al. Perivascular spaces: MRI marker of inflammatory activity in the brain? Brain 2008;131:2332–2340. [DOI] [PubMed] [Google Scholar]
- 4.Heier LA, Bauer CJ, Schwartz L, Zimmerman RD, Morgello S, Deck MD. Large Virchow-Robin spaces: MR-clinical correlation. AJNR Am J Neuroradiol 1989;10:929–936. [PMC free article] [PubMed] [Google Scholar]
- 5.Rosas HD, Salat DH, Lee SY, et al. Cerebral cortex and the clinical expression of Huntington's disease: complexity and heterogeneity. Brain 2008;131:1057–1068. [DOI] [PMC free article] [PubMed] [Google Scholar]
- 6.Benjamini Y, Hochberg Y. Controlling the false discovery rate: a practival and powerful approach to multiple testing. J R Stat Soc 1995;57:289–300. [Google Scholar]
- 7.Andrew SE, Goldberg YP, Kremer B, et al. The relationship between trinucleotide (CAG) repeat length and clinical features of Huntington's disease. Nat Genet 1993;4:398–403. [DOI] [PubMed] [Google Scholar]
- 8.Evenhuis HM. The natural history of dementia in Down's syndrome. Arch Neurol 1990;47:263–267. [DOI] [PubMed] [Google Scholar]
- 9.Rosas HD, Wilkens P, Salat DH, et al. Complex spatial and temporally defined myelin and axonal degeneration in Huntington disease. Neuroimage Clin 2018;20:236–242. [DOI] [PMC free article] [PubMed] [Google Scholar]
- 10.Chen JJ, Salat DH, Rosas HD. Complex relationships between cerebral blood flow and brain atrophy in early Huntington's disease. Neuroimage 2012;59:1043–1051. [DOI] [PMC free article] [PubMed] [Google Scholar]
- 11.Lim RG, Quan C, Reyes-Ortiz AM, et al. Huntington's disease iPSC-derived brain microvascular endothelial cells reveal WNT-mediated angiogenic and blood-brain barrier deficits. Cell Rep 2017;19:1365–1377. [DOI] [PMC free article] [PubMed] [Google Scholar]
Associated Data
This section collects any data citations, data availability statements, or supplementary materials included in this article.
Data Availability Statement
Summary data will be shared by reasonable formal request from qualified researchers, subject to a data-sharing agreement and in compliance with the requirements of the funding bodies and institutions.