Abstract
Early human embryonic development involves extensive lineage diversification, cell fate specification and tissue patterning1. Despite its basic and clinical importance, early human embryonic development remains mysterious due to interspecies divergence2,3 and limited accessibility to human embryo samples. Here we report that human pluripotent stem cells (hPSCs) in a microfluidic device recapitulate, in a highly controllable and scalable fashion, landmarks of the development of the epiblast (EPI) and amniotic ectoderm (AM) parts of the conceptus, including lumenogenesis and expansion of a pro-amniotic cavity, formation of a bipolar embryonic sac, specification of primordial germ cells (PGCs) and of primitive streak (PS) cells. We further show that AM-like cells (AMLCs) function as a signaling center to trigger the onset of gastrulation-like events in hPSCs. Given its controllability and scalability, the microfluidic model provides a powerful experimental system to advance knowledge of human embryology and reproduction. This model might assist in the rational design of differentiation protocols of hPSCs for disease modeling and cell therapy, and in high-throughput drug and toxicity screens to prevent pregnancy failure and birth defects.
In vitro cultured human embryos provide insights about the self-organizing properties and autonomy of early human development4,5. However, protocols for in vitro human embryo culture beyond the blastocyst stage remain suboptimal4,5. Furthermore, bioethical guidelines prohibit in vitro culture of human embryos beyond day post-fertilization (d.p.f.) 14 or reaching the onset of PS development6,7. Human (h) and mouse (m) PSCs in a developmental state similar to the EPI have been used for modelling post-implantation development of human and mouse embryos, respectively8-16. Thus, stem cell-based models are an important ethical alternative to the use of natural conceptus, especially as they can model only part of the conceptus17. However, beyond phenomenological observations, some existing models suffer from unsatisfactory efficiency and reproducibility and thus are suboptimal for mechanistic studies8,9,11,15. Recent efforts have leveraged micropatterned surfaces10,13 and microwell structures14,16 to promote multicellular self-organization in controlled environments. Herein we sought to leverage microfluidics to achieve a controllable model system to recapitulate developmental events reflecting the EPI and AM development in post-implantation human embryo.
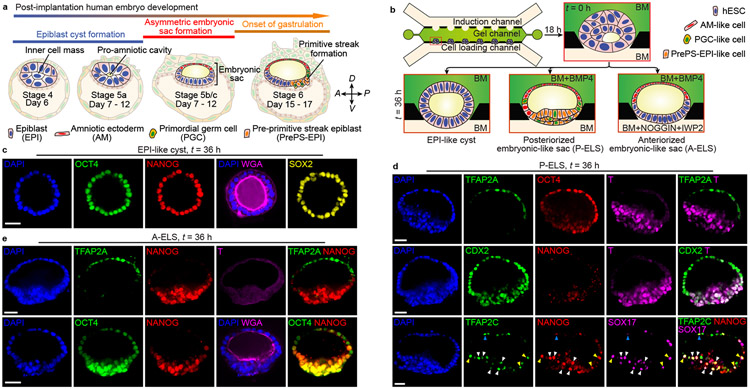
The first morphological milestone of post-implantation human embryo is the apical-basal polarization and lumenogenesis of the EPI, resulting in the pro-amniotic cavity4,5,18 (Fig. 1a). Lumenogenesis of the mEPI is shown to occur after the naïve to primed pluripotency transition in the mEPI18. Thus, we first sought to reproducibly generate lumenal cysts using primed hPSCs. We developed a microfluidic device containing three parallel channels, partitioned by evenly spaced supporting posts (Fig. 1b, Extended Data Fig. 1a-c and Methods). The central gel channel is preloaded with Geltrex, while the other two open channels serve as a cell loading channel and a chemical induction channel, respectively. Geltrex contraction during gelation leads to formation of concave gel pockets between supporting posts (Extended Data Fig. 1d). Single H9 hESCs injected into the cell loading channel settle into gel pockets and subsequently cluster (Extended Data Fig. 1d). At 18 h after cell seeding (designated as t = 0 h), culture solution is switched to a basal medium comprised of E6 and FGF2. From t = 0 h onwards, nascent cavities containing EZRIN+ apical membranes emerge5,19 (Extended Data Fig. 1e&f and Fig. 1b). By t = 36 h, E-CADHERIN+ (E-CAD+) epithelial sacs containing a single central lumen are developed, enclosed by a single layer of columnar, OCT4+NANOG+SOX2+ EPI-like cells (EPILCs; Fig. 1b&c, Extended Data Fig. 1e-l and Supplementary Video 1), reminiscent of the pro-amniotic cavity formed in the EPI at Carnegie stage 5a4,5,18. During lumenogenesis, EPI-like cysts expand in size while increasing cell number (Extended Data Fig. 1f,i-k). Development of EPI-like cysts is not sensitive to inhibition of WNT, BMP and TGF-β signaling or apoptosis (Extended Data Fig. 1m&n).
Figure 1. Microfluidic modeling of human epiblast and amnion development.
a. Mid-sagittal view of the post-implantation human embryo. The inner cell mass of the blastocyst first polarizes and forms the EPI cyst containing the pro-amniotic cavity. The EPI cyst then resolves into a patterned embryonic sac, with squamous AM at one pole and columnar EPI at the other. The primitive streak (PS) soon emerges at the prospective posterior end of the EPI. Primordial germ cells (PGCs) are thought to arise during the asymmetric embryonic sac development prior to gastrulation. Carnegie stages and embryonic days are indicated; PrePS-EPI, incipient gastrulating cells.
b. Microfluidic generation of EPI-like cysts, A-ELS and P-ELS. hPSCs seeded into preformed gel pockets at t = −18 h initiate lumenogenesis spontaneously. Basal medium (BM) consists of E6 and FGF2. A-ELS and P-ELS are obtained at t = 36 h by supplementing growth factors, morphogens and/or antagonists into the cell loading and/or induction channels as indicated.
c. Representative confocal micrographs showing EPI-like cysts at t = 36 h stained for OCT4, NANOG and SOX2. Fluorescently labeled WGA is used for staining of plasma membrane. Experiments were repeated five times with similar results.
d. Representative confocal micrographs showing P-ELS at t = 36 h stained for TFAP2A, OCT4 and BRACHYURY or T (top); CDX2, NANOG and T (middle); TFAP2C, NANOG and SOX17 (bottom). TFAP2C+SOX17+ human PGC-like cells (hPGCLCs) are marked by color coded arrowheads (blue: AM-like compartment; yellow: AM-EPI junction; white: PrePS-EPI-like compartment). Experiments were repeated five times with similar results.
e. Representative confocal micrographs showing A-ELS at t = 36 h stained for TFAP2A, NANOG and T (top); OCT4 and NANOG (bottom). Fluorescently labeled WGA is used for staining of plasma membrane. Experiments were repeated four times with similar results.
For c-e, DAPI counterstains nuclei. Scale bars, 40 μm.
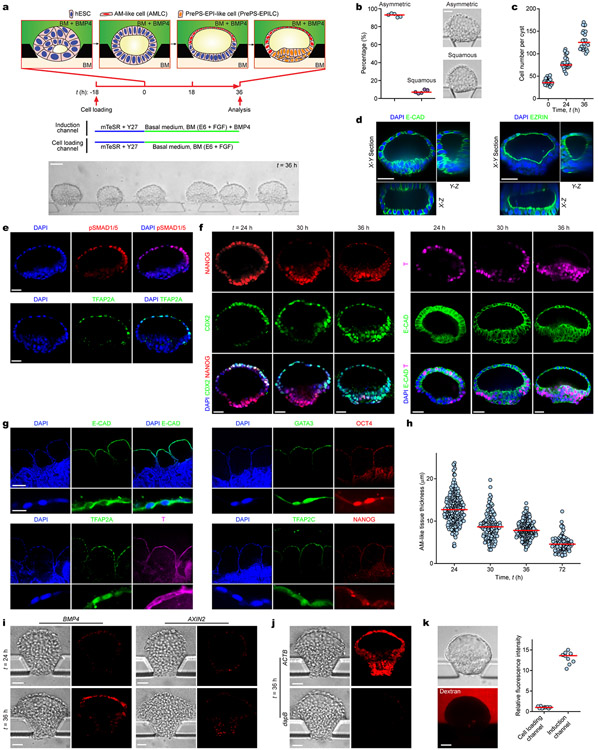
In post-implantation human embryo, formation of the pro-amniotic cavity in the EPI is followed by dorsal-ventral patterning, resolving the EPI into a bipolar embryonic sac, with squamous AM and EPI at the prospective dorsal and ventral poles, respectively (Fig. 1a). Formation of the bipolar embryonic sac heralds the gastrulation of the EPI, where the PS emerges at the prospective posterior end of the EPI (PrePS-EPI) (Fig. 1a). We next tested whether EPI-like cysts could recapitulate events similar to dorsal-ventral patterning of the EPI. Recent studies of the post-implantation cynomolgus (Cy) monkey and mouse embryos reveal strong BMP activity in the AM20,21. Our previous study also demonstrated requirement of BMP signaling for amniogenic differentiation of hPSCs12. Thus, we aimed to induce dorsal-ventral patterning of EPI-like cysts by supplementing BMP4 in the induction channel from t = 0 h onwards (Fig. 1b and Extended Data Fig. 2a). At t = 36 h, 92% of cysts differentiate into asymmetrical, E-CAD+ sacs, with a single layer of flattened, AM-like cells (AMLCs) at the pole exposed to BMP4 and a stratified, EPI-like epithelium at the other pole, resembling the human asymmetric embryonic sac prior to the onset of gastrulation at d.p.f. 7 - 12 (Carnegie stage 5b/c) (Fig. 1d, Extended Data Fig. 2b-d and Supplementary Video 2). Immunofluorescence analyses confirmed nuclear staining of phosphorylated SMAD1/5 (pSMAD1/5), a downstream target of BMP signaling, in AMLCs (Extended Data Fig. 2e). TFAP2A, a putative AM marker12, is exclusively expressed in AMLCs (Fig. 1d and Extended Data Fig. 2e). CDX2 is thought to be a marker for both AM12 and posterior PS23, while BRACHYURY (or T) is a PS marker22 and is expressed transiently in CyAM21 and during amniogenic differentiation of hPSCs12,15. At t = 24 h, incipient AMLCs express NANOG, CDX2 and T (Extended Data Fig. 2f), reflecting a fate transition from pluripotent EPI to AM. Hereafter, while incipient AMLCs acquire squamous morphology and lose NANOG and T expression, CDX2 and T expression spreads into the EPI-like compartment (Extended Data Fig. 2f). At t = 36 h, T is exclusively expressed in EPILCs, whereas NANOG is only retained at the center of the T+, EPI-like pole (Fig. 1d and Extended Data Fig. 2f). Since EPILCs are CDX2+ and T+, but are losing NANOG, suggesting a PrePS-EPI phenotype exiting from pluripotency21,23, these asymmetric sacs are henceforth termed posteriorized embryonic-like sacs (P-ELS). From t = 36 h onwards, EPILCs start to emigrate from, and only from, the EPI-like pole, leading to cyst collapse (Supplementary Video 2). Occasionally, prolonged culture to t = 72 h was successful; in such cases, continuous thinning of AMLCs is evident (Extended Data Fig. 2g&h) and GATA3, another putative AM maker12, appears exclusively in TFAP2A+ AMLCs (Extended Data Fig. 2g). OCT4 shows strong nuclear staining in all cells of P-ELS (Fig. 1d and Extended Data Fig. 2g), and in situ hybridization (ISH) of BMP4 and AXIN2 mRNA reveals very weak expression of AXIN2 in P-ELS but robust BMP4 expression in AMLCs (Extended Data Fig. 2i-k). Prominent BMP4 expression is also evident in CyAM at embryonic day (E) 11–1221.
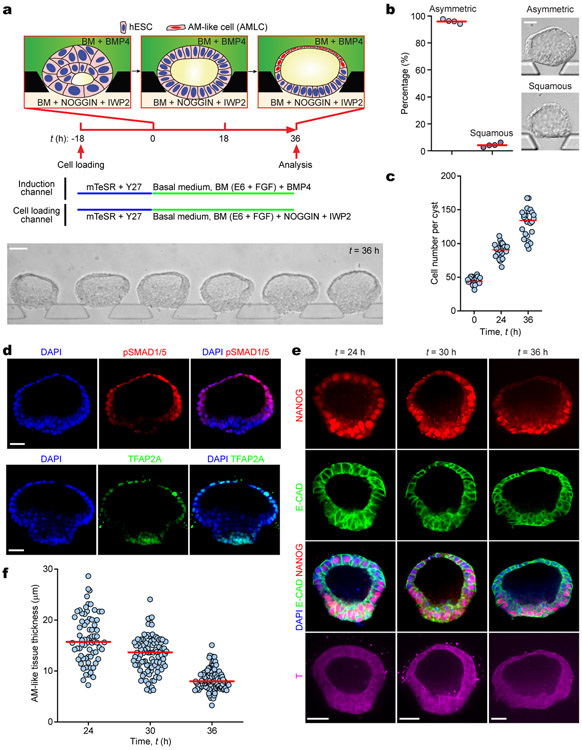
In the E11–12 Cy monkey embryo, T+ gastrulating cells emerge in the PrePS-EPI, whereas the anterior EPI remains OCT4+, NANOG+ but T− 21. In the E6.5 mouse embryo, WNT and NODAL antagonists secreted by the anterior visceral endoderm (AVE) restrict the PS formation to PrePS-EPI2. Importantly, WNT and BMP antagonists, DKK1 and CER1, respectively, are evident in the AVE of the E11–12 Cy monkey embryo21. Thus, to prevent gastrulating cell development, IWP2 (an inhibitor of WNT ligand secretion) and NOGGIN (a BMP antagonist) were supplemented into the cell loading channel in addition to BMP4 in the induction channel (Fig. 1b and Extended Data Fig. 3a). BMP4 stimulation still elicits patterning in 96% of cysts at t = 36 h to confer AM-like fate on cells directly exposed to BMP4 (Fig. 1e and Extended Data Fig. 3b-d). However, compared with P-ELS, the EPI-like pole appears more organized and is OCT4+NANOG+, but T− (Fig. 1e and Extended Data Fig. 3e&f). These events reflect aspects of the formation of anteriorized embryonic sac, and thus we designate these structures as anteriorized embryonic-like sacs (A-ELS).
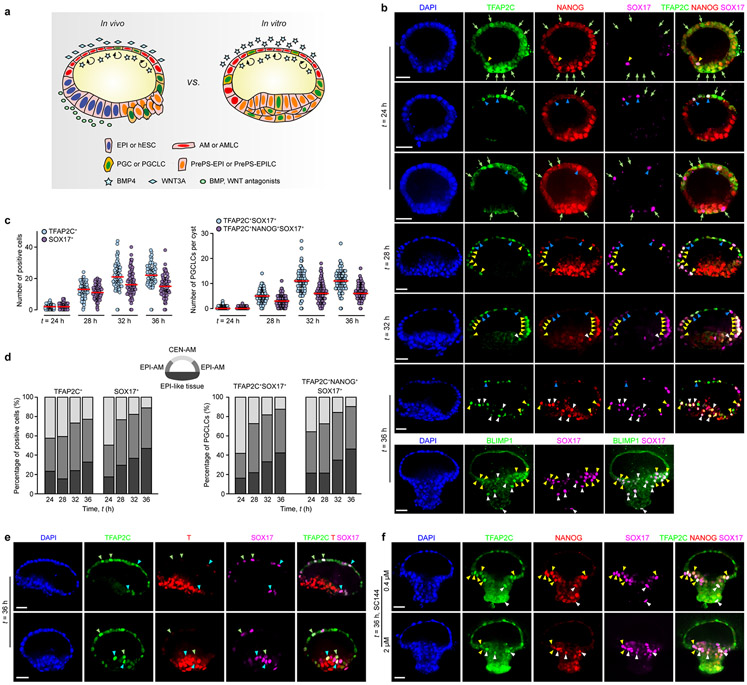
Non-human primate PGCs, the precursors of sperm and egg, are thought to arise during the embryonic sac formation prior to gastrulation21,24 (Fig. 1a and Extended Data Fig. 4a). We examined whether human PGC-like cells (hPGCLCs) would develop in P-ELS. TFAP2C+SOX17+ cells are identified as early-stage hPGCLCs21,25,26. Indeed, TFAP2C+SOX17− and SOX17+ TFAP2C− cells, presumptively in the process of hPGCLC specification, as well as TFAP2C+SOX17+ and TFAP2C+NANOG+SOX17+ hPGCLCs are all detected at t = 24 h throughout entire P-ELS, in a scattered fashion (Fig. 1d and Extended Data Fig. 4b-d). At t = 24 h, both TFAP2C+SOX17+ and TFAP2C+NANOG+SOX17+ hPGCLCs are predominantly located in incipient AM-like compartment (Extended Data Fig. 4b&d). Over time, hPGCLCs accumulate at the junction of AM-like and EPI-like compartments and in the EPI-like pole. At t = 36 h, hPGCLCs, which are prevalent in the PrePS-EPI-like pole, are also BLIMP1+, suggesting a fully committed stage to germline cell development (Fig. 1d and Extended Data Fig. 4b&d). At t = 72 h, no TFAP2C+ or NANOG+ cells are detected in the AM-like compartment (Extended Data Fig. 2g). We further examined T expression, as T is essential for mPGC specification27 and is associated with hPGCLC specification25,26. T is only detected at t = 36 h in a subset of TFAP2C+SOX17+ hPGCLCs in P-ELS (Extended Data Fig. 4e). Treatment of P-ELS with gpl30 inhibitor SC144 did not affect hPGCLC specification (Extended Data Fig. 4f). No TFAP2C+SOX17+ hPGCLCs were detected in A-ELS, consistent with data from the Cy monkey embryo21 and existing literature showing requirements for BMP and WNT signaling for hPGCLC specification24.
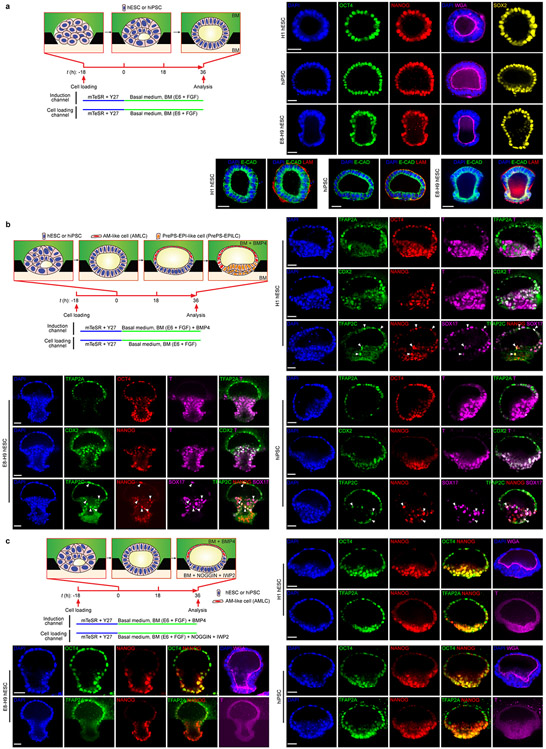
We also generated EPI-like cysts, P-ELS and A-ELS from different primed hESC lines and a human induced PSC line (Extended Data Fig. 5). We further confirmed specification of hPGCLCs in P-ELS using these hPSC lines (Extended Data Fig. 5b).
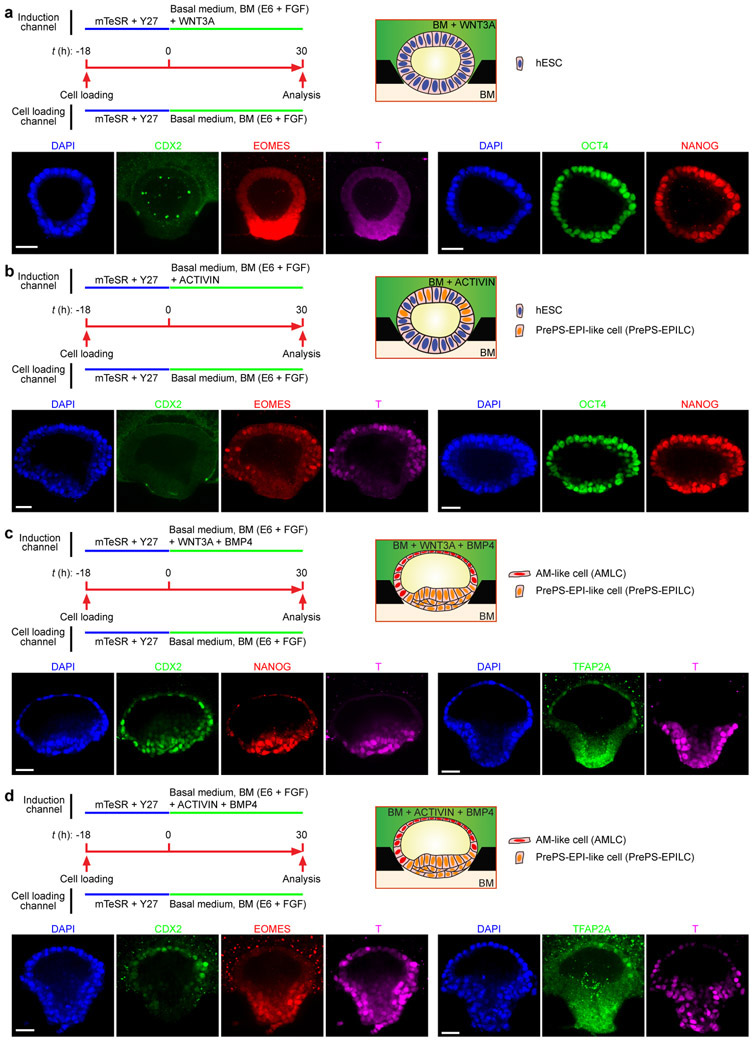
BMP and TGF-β/ACTIVIN signaling have been suggested to confer characteristics of posterior28 and anterior29 PS cell phenotypes on hPSCs, respectively; however, in P-ELS, EPILCs directly exposed BMP4 consistently gives rise to AMLCs before EPILCs at the opposite pole display a posterior PS cell phenotype (Fig. 1d). To elucidate the roles of developmental signals, WNT3A or ACTIVIN A was supplemented into the induction channel, with or without BMP4 (Extended Data Fig. 6). WNT3A alone gives rise to columnar EPI-like cysts containing OCT4+NANOG+, CDX2−EOMES−T− EPILCs (Extended Data Fig. 6a). ACTIVIN A alone generates cysts containing OCT4+NANOG+ EPILCs intermixed with EOMES+T+CDX2− anterior PS-like cells (Extended Data Fig. 6b). WNT3A and BMP4 together results in P-ELS (Extended Data Fig. 6c), whereas ACTIVIN A and BMP4 together generate asymmetric sacs containing TFAP2A+, CDX2+ AMLCs at the pole directly facing ACTIVIN A/BMP4 stimulation and EOMES+T+CDX2− anterior PS-like cells at the opposite pole (Extended Data Fig. 6d). Together, these data suggest that WNT3A is dispensable for embryonic-like sac formation and confirm the ability of ACTIVIN signaling to confer an anterior PS-like cell phenotype on the PrePS-EPI-like cells (PrePS-EPILCs).
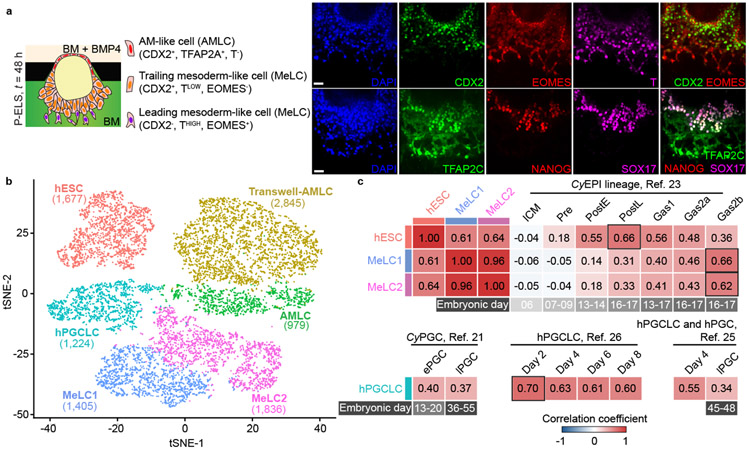
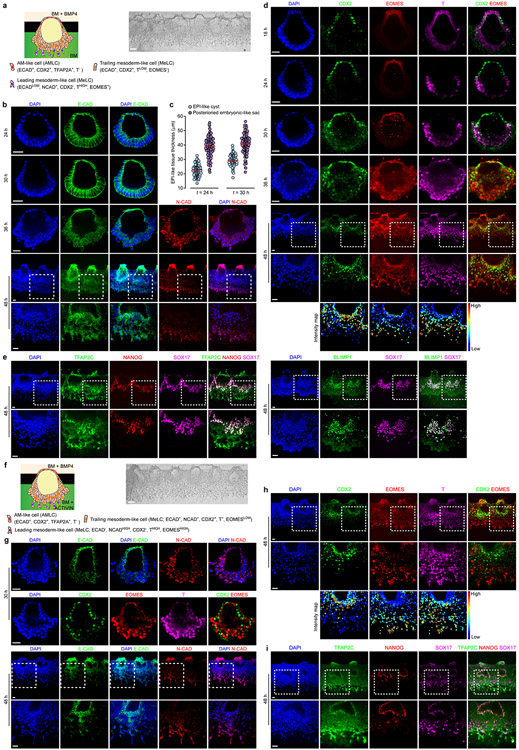
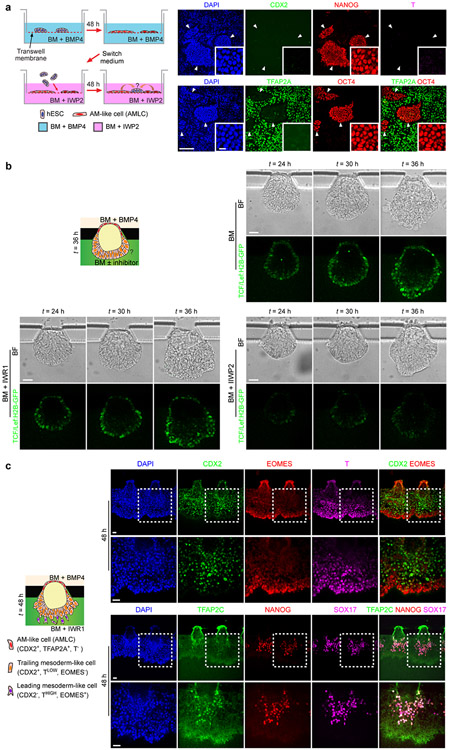
Because cell dissemination in P-ELS resembles cell movement during gastrulation of the EPI, we further investigated this event. To this end, BMP4 was supplemented into the cell loading channel from t = 0 h onwards (Fig. 2a and Extended Data Fig. 7a). The PrePS-EPI-like pole becomes thickened prior to cell dissemination (Extended Data Fig. 7a-c and Supplementary Video 3). From t = 36 h onwards, individual cells start migrating away from the PrePS-EPI-like pole and morphologically acquire a mesenchymal phenotype (Extended Data Fig. 7b). At t = 48 h, variable levels of T, EOMES and CDX2 are detected in migrating cells; leading cells show high intensity T staining (THIGH) and upregulated EOMES (EOMES+) and N-CADHERIN (N-CAD+), but not CDX2, whereas trailing cells exhibit CDX2 staining (CDX2+) and low intensity T staining (TLOW), but do not express EOMES or N-CAD (Fig. 2a and Extended Data Fig. 7d). At t = 48 h, NANOG expression is restricted to TFAP2C+SOX17+ hPGCLCs, which begin to migrate away from the PrePS-EPI-like compartment as clusters (Fig. 2a and Extended Data Fig. 7e). To induce anterior PS cell phenotype, ACTIVIN A was supplemented into the induction channel (Extended Data Fig. 7f). At t = 48 h, compared with posterior PS cell phenotype, anterior PS-like cells appear more migratory, with leading cells EOMESHIGH and N-CADHIGH (Extended Data Fig. 7g&h). NANOG expression is restricted to TFAP2C+SOX17+ hPGCLCs, which are still contained in embryonic-like sacs (Extended Data Fig. 7i). A distinct SOX17+TFAP2C−NANOG− cell population is evident in trailing cells, which are presumptively in the process of endoderm specification30 (Extended Data Fig. 7i).
Figure 2. Single-cell transcriptomic analysis of posteriorized embryonic-like sac.
a. Left: Schematic of P-ELS at t = 48 h. Right: Representative confocal micrographs showing staining for CDX2, EOMES and BRACHYURY or T (top); TFAP2C, NANOG and SOX17 (bottom). Experiments were repeated three times with similar results. Scale bars, 40 μm.
b. t-distributed stochastic neighbor embedding (tSNE) plot generated from single-cell RNA sequencing (scRNA-seq) data of a total of 9,966 cells, revealing 6 distinct, color-coded cell populations (“hESC”, “Transwell-AMLC”, “AMLC”, “hPGCLC”, “Mesoderm-like cell (MeLC)1” and “MeLC2”; see Extended Data Fig. 8). Cell numbers of each population are indicated.
c. Heat map of correlation coefficients among indicated cell types including those reported by others [21, 23, 25, 26]. Comparisons between “hESC”, “MeLC1”, “MeLC2” and Cy monkey EPI (CyEPI) lineages are based on ontogenic genes identified for CyEPI (651 in common out of 776) [23]. Comparisons between “hPGCLC”, CyPGC, hPGCLC and hPGC are based on ontogenic CyPGC genes (477 in common out of 544) [21]. Correlation coefficient is calculated using averages of log-transformed expression of common genes. CyEPI lineages: ICM, inner cell mass; Pre, pre-implantation EPI; PostE and PostL, post-implantation early and late EPI, respectively; Gas1/2a/2b, gastrulating cells. For CyPGC and hPGC: ePGC, early CyPGC; lPGC, late gonadal CyPGC or hPGC. Embryonic days are indicated for CyEPI lineages, CyPGC and hPGC below the heat maps. For hPGCLCs reported in Ref. 25 & 26, culture day is indicated. Color bars above and besides the heat maps indicate cell types in P-ELS. All genes are listed in Supplementary Table 1.
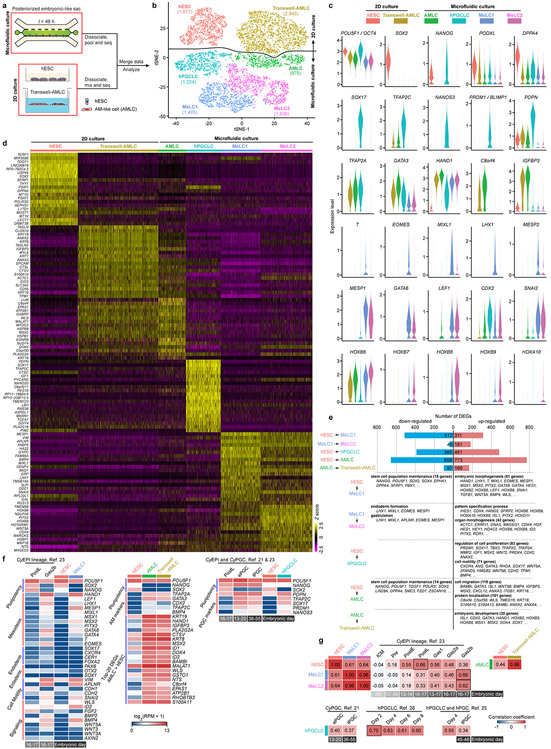
We further studied P-ELS obtained at t = 48 h using single-cell RNA sequencing (scRNA-seq), together with hESCs and AMLCs derived using a Transwell method (Transwell-AMLC; Extended Data Fig. 8a). In the tSNE plot, 6 distinct cell clusters emerge and are annotated as “hESC”, “Transwell-AMLC”, “AMLC”, “hPGCLC”, “Mesoderm-like cell (MeLC)1” and “MeLC2” based on lineage markers (Fig. 2b and Extended Data Fig. 8b). Notably, in addition to SOX17, TFAP2C, BLIMP1 and NANOG, “hPGCLC” expresses NANOS3 (Extended Data Fig. 8b-f). “MeLC1” and “MeLC2” correspond to THIGHEOMES+ leading cells and TLOWEOMES− trailing cells in P-ELC, respectively (Extended Data Fig. 8b-d). Genes upregulated in “MeLC2” against “MeLC1” are enriched with those for ‘body pattern specification/organ morphogenesis’ (Extended Data Fig. 8c-e), including HOXA10, HOXB6, HOXB8 and HOXB9, suggesting a later developmental stage. Genes upregulated in “MeLC1”, “hPGCLC” and “AM” against “hESC” exhibit marked enrichments for ‘embryonic morphogenesis’, ‘regulation of cell proliferation/cell motility’ and ‘cell migration/protein localization’, respectively, whereas those downregulated are enriched for ‘stem cell population maintenance’ (Extended Data Fig. 8e). Expression of ectoderm markers PAX6, SOX1 and OTX2 or endoderm markers SOX17, CXCR4, CER1 and FOXA2 is not detected (Extended Data Fig. 8f). Transcriptomic profiles of “AMLC” and “Transwell-AMLC” are similar and can only be distinguished using tSNE-2 axis (Extended Data Fig. 8b-g). Based on CyEPI ontogenic genes23, “hESC” and “MeLC1/2” show the closest correlations with post-implantation late CyEPI and gastrulating cells at E16–17, respectively (Fig. 2c and Extended Data Fig. 8g). “hPGCLC” exhibits the closest correlation with early-stage hPGCLCs based on ontogenic CyPGC genes21 (Fig. 2c and Extended Data Fig. 8g).
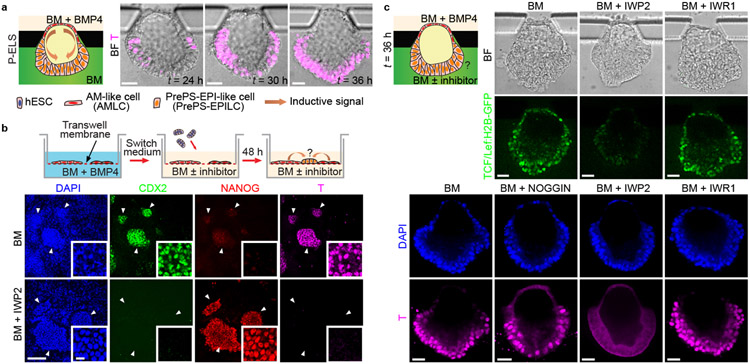
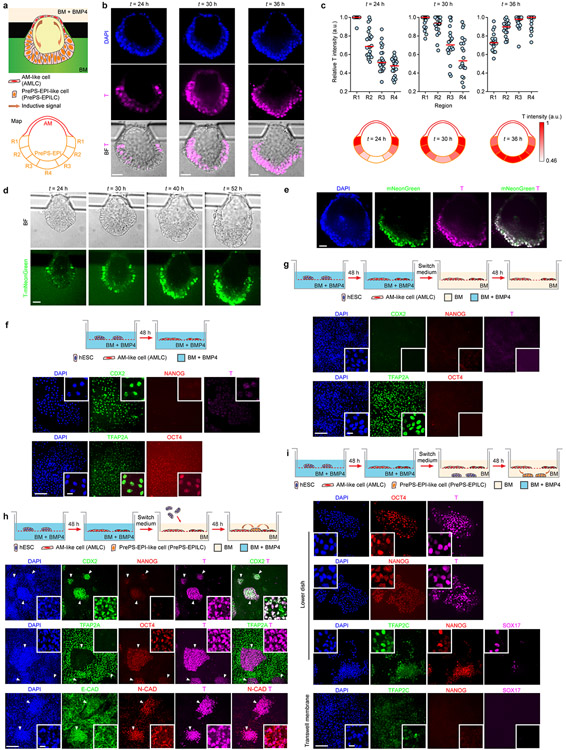
Mouse gastrulation is initiated at the proximal, posterior end of the mEPI by a convergence of BMP/WNT/NODAL signaling, established through reciprocal interactions between the mEPI and the juxtaposed extraembryonic ectoderm. The counterpart of extraembryonic ectoderm in the post-implantation human embryo, the trophectoderm, however, is physically separated from the EPI by the AM. We thus sought to study the role of AMLCs in triggering gastrulation-like events in P-ELS. T expression always emerge first in regions of the PrePS-EPI-like compartment adjacent to the AM-like compartment before its propagation to the rest of the PrePS-EPI-like compartment (Fig. 3a, Extended Data Fig. 9a-e and Supplementary Video 4). We further examined inductive roles of Transwell-AMLCs (Fig. 3b and Extended Data Fig. 9f-i). Even without exogenous inductive factors, hESCs co-cultured with Transwell-AMLCs for 48 h would exit from pluripotency and display a posterior PS cell phenotype (Fig. 3b and Extended Data Fig. 9h&i). TFAP2C+NANOG+SOX17+ hPGCLCs are evident in hESCs, but not in Transwell-AMLCs, after 48 h of co-culture (Extended Data Fig. 9i). Differentiation of posterior PS-like cells is inhibited, however, when IWP2 is supplemented into the transwell co-culture system (Fig. 3b and Extended Data Fig. 10a), suggesting the involvement of WNT signaling in inductive effects of Transwell-AMLCs. We further used a TCF/Lef:H2B-GFP hESC reporter line to generate P-ELS, confirming active WNT/β-CATENIN signaling in the PrePS-EPI-like compartment (Fig. 3c and Extended Data Fig. 10b). Interestingly, PrePS-EPI-like cell development is completely inhibited by IWP2 supplemented in the induction channel, but not by NOGGIN or IWR1, a specific inhibitor targeting turnover of AXIN2, a member of the β-CATENIN destruction complex, suggesting that initiation of gastrulation-like events in PrePS-EPI-like cells might be independent of AXIN2 (Fig. 3c and Extended Data Fig. 10b). Our ISH data in Extended Data Fig. 2i and scRNA-seq data in Extended Data Fig. 8f showing very weak expression of AXIN2 in P-ELS support this speculation. Prolonged culture of P-ELS to t = 48 h under IWR1 treatment confirms that IWR1 does not affect its progressive development (Extended Data Fig. 10c).
Figure 3. Amniotic ectoderm-like cells trigger mesoderm induction in posteriorized embryonic-like sac involving WNT signaling.
a. Schematic of microfluidic setting for mesoderm induction in P-ELS. Representative composite images show staining of BRACHYURY (T) at indicated time points. Experiments were repeated three times with similar results. Scale bars, 40 μm.
b. Co-culture assay of AMLCs and hESCs. hESCs were first differentiated into AMLCs by culturing in BM supplemented with BMP4 for 48 h. Culture medium was then switched to fresh BM supplemented with or without IWP2. At this point, undifferentiated hESCs were seeded onto transwell membranes and co-cultured with AMLCs for another 48 h. Representative confocal micrographs showing staining for CDX2, NANOG and T. DAPI counterstains nuclei. Boxed images show magnified views of hESC colonies marked by white arrowheads. Experiments were repeated three times with similar results. Scale bars, 160 μm and 10 μm (zoom-in).
c. Top: Live imaging with 6×TCF/Lef-hsp68-H2B-EGFP H9 hESC reporter line to track WNT/β-CATENIN signaling dynamics during embryonic-like sac development with or without WNT inhibitors IWP2 or IWR1 supplemented into the induction channel as indicated. Bottom: Representative confocal micrographs showing embryonic-like sacs obtained at t = 36 h when indicated antagonists are supplemented into the induction channel. Cells were stained for T. DAPI counterstains nuclei. Experiments were repeated four times with similar results. Scale bars, 40 μm.
In this work, we report a hPSC-based, microfluidic model to recapitulate successively key early human post-implantation developmental landmarks. We further show that AMLCs play a previously unrecognized, but critical role, both in triggering the onset of gastrulation-like events and the specification of hPGCLCs. Our data also provide a new perspective on the fluidity of pluripotency phases associated with hPSCs and likely hEPI as well.
METHODS
Ethics statement
The embryonic-like sacs lack the primitive endoderm and the trophoblast, and thus cannot form yolk sac and placenta, respectively. Therefore, these embryonic-like tissues do not have human organismal form or potential. Furthermore, all experiments were terminated by no later than day 4 in vitro. All protocols used in this work with hPSCs to model early post-implantation human embryo development, including the development of embryonic-like sac and the specifications of hPGCLCs and PS-like cells, have been approved by the Human Pluripotent Stem Cell Research Oversight Committee at the University of Michigan, Ann Arbor.
Cell lines
hPSC lines used in this study include H1 hESC (WA01, WiCell; NIH registration number: 0043), H9 hESC (WA09, WiCell; NIH registration number: 0062) and 1196a (an iPSC line from the University of Michigan Pluripotent Stem Cell Core31). All hPSC lines have been authenticated by original sources as well as in-house by immunostaining for pluripotency markers and successful differentiation to the three germ layers. All hPSC lines are maintained in a feeder-free system for at least 10 passages and authenticated as karyotypically normal. Karyotype analysis is performed by Cell Line Genetics. All hPSC lines are tested negative for mycoplasma contamination (LookOut Mycoplasma PCR Detection Kit, Sigma-Aldrich).
Cell culture
hPSCs are maintained in a standard feeder-free culture system using mTeSR™ medium (mTeSR; STEMCELL Technologies) or TeSR™-E8™ medium (Essential 8 or E8; STEMCELL Technologies) and lactate dehydrogenase-elevating virus (LDEV)-free, hESC-qualified reduced growth factor basement membrane matrix Geltrex (Thermo Fisher Scientific; derived from Engelbreth-Holm-Swarm tumors similarly as Matrigel). Cell culture is visually examined during each passage to ensure absence of spontaneously differentiated, mesenchymal-like cells in culture. All hPSCs are used before reaching P70.
Device fabrication
The microfluidic device consists of a polydimethylsiloxane (PDMS) structure layer bonded to a coverslip. The PDMS structure layer is made by mixing PDMS curing agent and base polymer (Sylgard 184; Dow Corning) at a ratio of 1:10 before casting PDMS prepolymer onto a microfabricated silicon mold and baking at 110 °C for 40 min. Medium reservoirs (8 mm in diameter) and gel loading ports (1.2 mm in diameter) are then punched into the PDMS structure layer using Harris Uni-Core punch tools (Ted Pella). After cleaning with ethanol and air plasma activation, the PDMS structure layer is bonded to a coverslip before baking at 80 °C overnight. Before usage, the microfluidic device is sterilized under UV light for 30 min. Geltrex diluted in mTeSR (8 mg mL−1) is then injected into the central gel channel and allowed to cure for 10 min at 37 °C in an incubator. The central gel channel is separated from the cell loading and induction channels by trapezoid-shaped supporting posts. Diluted Geltrex matrix is contained in the gel channel by supporting posts due to surface tension. Upon gelation, Geltrex matrix would contract, generating concave Geltrex pockets between supporting posts. mTeSR medium is immediately added to medium reservoirs to fill both the cell loading and induction channels. The microfluidic device is then incubated at 37 °C and 5% CO2 for 24 h to stabilize Geltrex matrix in the gel channel.
Microfluidic assays
Colonies of hPSCs are dissociated by Accutase (Sigma-Aldrich) at 37 °C for 10 min before being suspended in mTeSR as single cells. Cells are then centrifuged and re-suspended in mTeSR containing 10 μM Y27632 (Tocris), a ROCK inhibitor that prevents dissociation-induced apoptosis of hPSCs32, at a concentration of 8 × 10⁶ cells mL−1. After aspirating mTeSR from medium reservoirs, 10 μL hPSC suspension is introduced into the cell loading channel (t = −18 h). The microfluidic device is then tilted 90° for 10 min to allow cell settlement into Geltrex pockets and their clustering and adhesion to Geltrex matrix. Medium reservoirs are then refilled with fresh mTeSR medium containing 10 μM Y27632. At t = 0 h, all medium reservoirs are switched to a fresh basal medium (BM) comprised of Essential 6 Medium (E6; Thermo Fisher Scientific) and FGF2 (20 ng mL−1; GlobalStem). Unless noted otherwise, all medium reservoirs and both cell loading and induction channels are filled with BM from t = 0 h onwards and are replenished daily.
To generate EPI-like cysts, BM is used in all medium reservoirs from t = 0 h onwards. To examine possible involvements of different signaling events in the development of EPI-like cysts, IWP2 (5 μM; Tocris), LDN 193189 (0.5 μM; Selleckchem), SB 431542 (10 μM; Cayman Chemical) or Caspase 3 inhibitor Z-DEVD-FMK (10 μM; BioVision) is supplemented into BM.
To generate P-ELS, BMP4 (50 ng mL−1; R&D Systems) is supplemented into BM in the induction channel from t = 0 h onwards. To generate A-ELS, in addition to BMP4 (50 ng mL−1) supplemented into BM in the induction channel, NOGGIN (50 ng mL−1; R&D Systems) and IWP2 (5 μM in DMSO; Tocris) are supplemented into BM in the cell loading channel from t = 0 h onwards.
To examine the effect of exogenous WNT or ACTIVIN on generating asymmetric embryonic-like sacs, WNT3A (50 ng mL−1; R&D Systems), ACTIVIN A (50 ng mL−1; R&D Systems) and / or BMP4 (50 ng mL−1) are supplemented into BM in the induction channel.
To examine the development of posterior PS-like cells, from t = 0 h onwards, BMP4 (50 ng mL−1) is supplemented into BM in the cell loading channel, and BM or BM supplemented with IWP2 (5 μM), IWR1 (10 μM; Selleckchem and STEMCELL Technologies), or NOGGIN (50 ng mL−1) is loaded into the induction channel. To examine anterior PS-like cell development, in addition to BMP4 (50 ng mL−1) supplemented into BM in the cell loading channel, ACTIVIN A (50 ng mL−1) is added into BM in the induction channel.
A detailed protocol describing the implementation of the microfluidic device for generating EPI-like cysts, P-ELS and A-ELS from hPSCs is available in Protocol Exchange33.
Immunocytochemistry
hPSCs are fixed in 4% paraformaldehyde (PFA; buffered in 1× PBS) for 12 h, and permeabilized in 0.1% SDS solution (sodium dodecyl sulfate, dissolved in PBS) for another 3 h. Samples are then blocked in 4% donkey serum (Sigma-Aldrich) at 4 °C for 24 h, followed by incubation with primary antibody solutions at 4 °C for another 24 h. Samples are then labeled with donkey-raised secondary antibodies (1:500 dilution) at 4 °C for 24 h. 4′,6-diamidino-2-phenylindole (DAPI; Thermo Fisher Scientific) is used for counterstaining cell nuclei. Alexa-Fluor dye-conjugated wheat germ agglutinin (WGA; Thermo Fisher Scientific) and phalloidin (Invitrogen) are used for visualization of cell membrane and actin microfilaments, respectively. Both primary and secondary antibodies are prepared in 4% donkey serum supplemented with 0.1% NaN3. 70 μL antibody solutions are added to each medium reservoir for immunostaining.
In this work, the asymmetric embryonic-like sac structure is assessed by immunocytochemistry to confirm molecular asymmetry at t = 36 h (for P-ELS: co-staining for TFAP2A and BRACHYURY; for A-ELS: co-staining for TFAP2A and NANOG).
In situ hybridization (ISH)
ISH is performed using the ViewRNA ISH Tissue Assay Kit (1-plex; Thermo Fisher Scientific) per manufacturer’s instruction. Briefly, lumenal cystic tissues within the microfluidic device are fixed with 4% PFA for 24 h, before being dehydrated by washing with PBT (0.1% Triton X-100 in PBS) and then a graded series of methanol (25%, 50%, 75% and 100% in PBT; twice in each concentration and 10 min for each wash). Before hybridization, lumenal cystic tissues are rehydrated by a reverse graded series of methanol (75%, 50% and 25% in PBT) before being washed twice with PBS. Proteinase K digestion is conducted for 15 min at 40 °C, followed by 4% PFA fixation for 15 min at room temperature. Cystic tissues are hybridized with ViewRNA type 1 probe set for 3 h at 40 °C, followed by treatment with PreAmplifier for 30 min at 40 °C, Amplifier for 20 min at 40 °C, Label Probe-AP for 20 min at 40 °C, AP-enhancer for 8 min at room temperature, and Fast Red for 35 min at 40 °C. Gene-specific probes for human AXIN2 (VA1-10388-VT) and BMP4 (VA1-18826-VT) are tested in this work. Probes against human ACTB (VA1-10351-VT) and Bacillus S. dapB (VF1-11712-VT) are used as positive and negative controls, respectively.
Microscopy
All confocal micrographs are acquired using an Olympus DSUIX81 spinning disc confocal microscope equipped with an EMCCD camera (iXon X3, Andor). For 3D reconstruction, Z-stack images are acquired with a slice thickness of 1 μM. Low-magnification bright field images are acquired using a Labomed TCM 400 inverted microscope equipped with an UCMOS eyepiece camera (Fisher Scientific). For morphogenetic quantification, bright field or phase contrast images are acquired using a Zeiss Observer.Z1 microscope (Carl Zeiss MicroImaging) equipped with a monochrome CCD camera (AxioCam, Carl Zeiss MicroImaging). Live imaging is conducted using the Zeiss Observer.Z1 microscope enclosed in an environmental incubator (XL S1 incubator, Carl Zeiss MicroImaging) maintaining cell culture at 37 °C and 5% CO2.
Enumeration of total cell number
For enumeration of cell number during the development of lumenal cystic tissues, a CAG-H2B-EGFP H9 hESC line is generated. H2B-EGFP (Addgene plasmid #32610) is PCR amplified, before the PCR product is ligated into the ePiggyBac vector with a constitutively active puromycin selection cassette34. The plasmid is co-transfected with pCAG-PBase (ePiggyBac transposase helper plasmid, a gift from Dr. Ali H. Brivanlou) using GeneJammer (Agilent Technologies) into H9 hESCs that are plated at 50,000 cells cm−2 24 h prior to transfection. Puromycin selection (2 μg mL−1) starts at day 2 after transfection for 4 days. The brightest hESC clone is hand-picked and expanded before cell enumeration assays. Cell number of lumenal cystic tissues is manually counted by blind observers using 3D reconstructed Z-stack images recorded from confocal microscopy at t = 0 h, 24 h and 36 h under different microfluidic experimental conditions.
Morphogenetic quantification
Morphogenetic quantifications, including equivalent cyst diameter, embedded cyst perimeter percentage and AM-like tissue thickness, are performed manually with AxioVision (Carl Zeiss MicroImaging) using confocal images recorded at the central focal plane of each cyst (40 μm above the microfluidic device bottom surface). Equivalent cyst diameter is calculated as the average of the longest and shortest axis of each cyst. Thickness of AM-like tissue is quantitated as the thickness of the thinnest AM-like tissue region. Embedded cyst perimeter percentage is calculated as the ratio between the perimeter of lumenal cyst embedded in Geltrex matrix and the total cyst perimeter.
Enumeration of hPGCLCs
Cells double positive for TFAP2C and SOX17 (TFAP2C+SOX17+) are identified as hPGCLCs21,24,25. The AM-like compartment is first identified as the flattened, single-cell layer tissue at t = 28, 30 and 36 h or the part of embryonic-like sacs in-between supporting posts at t = 24 h directly exposed to BMP4 stimulation. The AM-like compartment is then divided into 4 quadrants. The two middle quadrants furthest away from the EPI-like pole are defined as the central AM-like region (CEN-AM). The two quadrants at the junction of EPI-like and AM-like compartments are defined as the EPI-AM region. For consistency, only confocal images recorded at the central focal plane of each cyst (40 μm above the microfluidic device bottom surface) are used for enumeration of hPGCLCs. Confocal images are analyzed manually by blind observers using Image J to determine the numbers of single (TFAP2C+ or SOX17+), double (TFAP2C+SOX17+) and triple (TFAP2C+ NANOG+SOX17+) positive cells in different compartments of embryonic-like sacs.
Transwell assays
Transwell assays are conducted using 12-mm Transwell with porous polyester membrane insert (0.4 μm pore size; Corning). The transwell membrane insert is first incubated with 1% Geltrex diluted in DMEM/F12 (Thermo Fisher Scientific) for 1 h. hPSCs suspended in mTeSR containing 10 μM Y27632 are then seeded onto the membrane insert at a density of 30 × 103 cells cm−2. 18 h after cell seeding, culture medium is switched to BM supplemented with or without BMP4 (50 ng mL−1), and cells are cultured for another 48 h. At this point, culture medium is replaced with fresh BM before small clusters of undifferentiated hPSCs suspended in BM are plated onto the transwell membrane insert or the lower dish. Cells are cultured for another 48 h in BM with or without IWP2 (5 μM, dissolved in DMSO) before analysis.
Quantification of BRACHYURY (T)
The EPI-like compartment of P-ELS is divided into four quadrants, based on their relative distance to the AM-like pole. Nuclear intensity of T is determined for individual cells in each quadrant by manually selecting a small area in the cell nucleus and measuring the average fluorescence intensity using ImageJ. Care is taken to ensure that selected nuclear areas do not overlap with other nuclei. T intensity for each cell is further normalized to DAPI intensity in the same nuclear area. An average normalized T intensity for cells in each quadrant is then calculated. T intensity of each quadrant is then again normalized to the quadrant with the highest T intensity and plotted.
Signaling reporter lines
A H9 hESC line expressing a C-terminal fusion of the T gene with mNeonGreen is generated by CRISPR-Cas9 facilitated homology directed repair (HDR). Briefly, activity of guide RNAs (gRNAs) is first screened in HEK 293T cells. An active gRNA with the targeting sequence of gccttgctgcttcacatgga showing the best activity is selected and cloned into a second modified version of px33035. For targeting construct approximately 1000 bp upstream and downstream of the CRISPR-Cas9 cleavage site / T stop codon is prepared by Long PCR and cloned into pBluescript II KS+ (Stratagene) modified by adding OriP. This targeting construct is further modified by silent mutation of the gRNA targeting sequence, removal of the natural T stop codon and insertion of a 22 amino acid glycine/serine/alanine rich flexible linker N-terminal to mNeonGreen in frame with the T coding sequence.
To generate TCF/Lef reporter-hESC lines, 6×TCF/Lef-hsp68-H2B-EGFP is first amplified from a gift plasmid provided by Dr. Anna-Katerina Hadjantonakis (Addgene plasmid #32610). Amplified PCR product is ligated into ePiggyBac vector with a constitutively active puromycin selection cassette34. Transfection and puromycin selection are conducted as for construction of the CAG-H2B-EGFP cell line described above. 10 clonal lines are hand-picked and further expanded. H2B-EGFP expression is confirmed by fluorescence microscopy under treatment with CHIR99021 (8 μM; Cayman Chemical) and bFGF (20 ng mL−1) in E6 medium. 2 clonal lines with the highest and most homogeneous fluorescence signal are selected for live imaging.
Fluorescent intensity map
Heat maps of fluorescence micrographs are generated using matplotlib package in Python. Image masks are first generated by thresholding DAPI staining images and isolating nuclear areas from background. Immunostaining images are then converted to heat maps based on their fluorescence intensity.
Dextran diffusion assay
Morphogen diffusion in the microfluidic device is determined using fluorescein-labeled Dextran (70 kDa, Invitrogen). Briefly, 10 μM fluorescein-labeled Dextran is supplemented into the induction channel from t = 30 h onwards during the development of P-ELS. Fluorescence intensities within the cell loading channel and induction channel are then measured using confocal microscopy at t = 36 h.
Single-cell RNA-sequencing (scRNA-seq) and data analysis
P-ELS at t = 48 h are treated with Accutase for 1 h to obtain single cell suspensions. Cells from 6 microfluidic devices are collected and pooled into PBS containing 0.5% BSA. Transwell-AMLCs are obtained by treating hESCs with BMP4 (50 ng mL−1) for 48 h using the Transwell method. Transwell-AMLCs are treated with Accutase for 1 h to obtain single cell suspensions. hESCs maintained on standard tissue culture plates are dissociated into single cells using Accutase for 1 h. Transwell-AMLCs and hESCs are counted before being mixed at a 2:1 ratio as a single-cell suspension. Within 1 h after cell dissociation, cells are loaded into the 10× Genomics Chromium system. 10× Genomics v2 libraries are prepared as per manufacturer’s instructions. Libraries are then sequenced with a minimum coverage of 50,000 raw reads per cell on Illumina HiSeq 4000 with paired-end sequencing. scRNA-seq data are aligned and quantified using Cell Ranger Single-Cell Software Suite (version 3.0.0, 10× Genomics) against the hg19 human reference genome.
Merging of scRNA-seq data and cell clustering are performed using Seurat R package (version 3.0.0.9)36,37. Default setups are used unless noted otherwise. Briefly, cells with nfeature_RNA ≤ 3,200 or ≥ 6,200 (P-ELS), nfeature_RNA ≤ 3,600 or ≥ 6,400 (Transwell-AMLC and hESC), or cells in which the total mitochondrial gene expression exceeds 6% of total gene expression are discarded from analysis. Gene expression is calculated by normalizing the raw count by the total count before being multiplied by 10,000 and log-transformed. After cell-cycle regression, principal component analysis (PCA) is performed using RunPCA function in Seurat. Identification of cell clusters by a shared nearest neighbor (SNN) modularity optimization based clustering algorithm is achieved using “FindClusters” function with a resolution set at 0.3. Dimensionality reduction using t-distributed stochastic neighbor embedding (tSNE) is generated using “RunTSNE” (dim = 1:15).
Differentially expressed genes (DEGs) are identified using “FindAllMarkers”, with a minimal fold difference of 0.25 in the logarithmic scale (log-scale) and > 25% detection rate in either of two cell types under comparison. Violin plots are generated using “VlnPlot” in Seurat R package. Heat map is plotted based on relative expression (Z-score) of Top-20 gene signatures to distinguish each cell cluster. Gene Ontology Analyses are performed using DAVID Bioinformatics Resources 6.8 based on DEGs (Supplementary Table 1). For comparison with published data, gene expression data obtained from different platforms (GEO repository, NCBI) are first transformed into log2(reads per million mapped reads (RPM) + 1). Average expression level of each cell type is used for correlation coefficient calculation and heat map plotting.
Statistics
Statistical analysis is performed using Excel (Microsoft). Statistical significance between two groups is analyzed by the two-sided Student t-tests. In all cases, a P value of less than 0.05 is considered statistically significant.
Code availability
MATLAB and RStudio scripts used in this work are available from the corresponding author upon request.
Data availability statement
Data supporting the findings of this study are available within the article and its supplementary information files and from the corresponding author upon request. scRNA-seq data are also available at the Gene Expression Omnibus (GSE134571; www.ncbi.nlm.nih.gov/geo). All source data for graphs included in the paper are available for download from Nature.
Extended Data
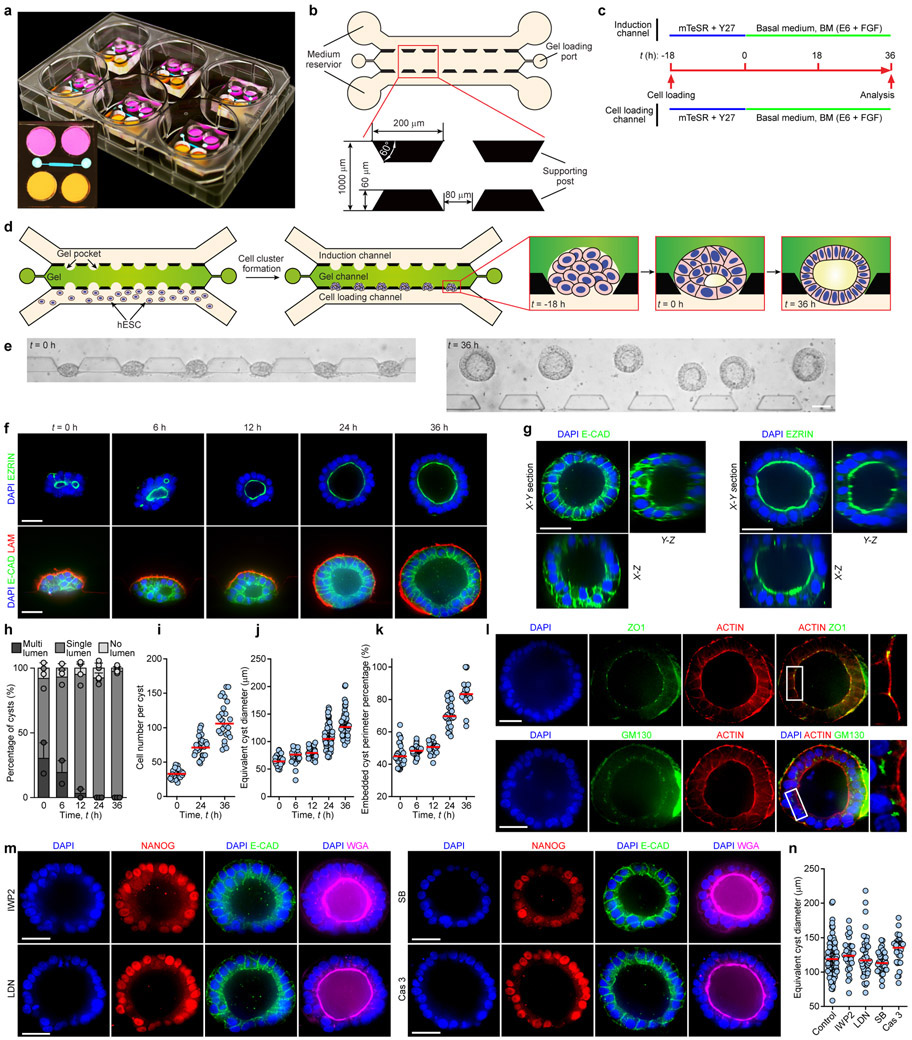
Extended Data Figure 1. Microfluidic generation of pluripotent epiblast-like cyst.
a. Photograph showing microfluidic devices in a six-well plate. Insert shows device top view. Devices were filled with medium containing food color dyes to illustrate medium reservoirs and microfluidic channels.
b. Design of microfluidic device incorporating 3 parallel channels (80 μm in height) partitioned by trapezoid-shaped supporting posts spaced 80 μm apart. The central channel (“gel channel”) is preloaded with Geltrex. The other two open channels are used for cell loading (“cell loading channel”) and chemical induction (“induction channel”), respectively.
c. Protocol for generating EPI-like cysts. After cell loading (designated as t = −18 h), a basal medium (BM) comprised of E6 and FGF2 (20 ng mL−1) is supplied into both the cell loading and induction channels from t = 0 h onwards.
d. Schematic showing cell loading, cell clustering and lumenogenesis. After injection of Geltrex into the gel channel, Geltrex gelation and contraction leads to formation of evenly spaced concave gel pockets between supporting posts. After loading hESCs into the cell loading channel, the microfluidic device is tilted 90° to allow settlement of cells into gel pockets (t = −18 h). At t = 0 h, nascent lumenal cavities emerge within cell clusters. At t = 36 h, EPI-like cysts contain a single central lumenal cavity reminiscent of the pro-amniotic cavity formed in the EPI of the blastocyst upon implantation.
e. Representative bright field images showing an array of EPI-like cysts at t = 0 h and 36 h. Experiments were repeated five times with similar results. Scale bar, 80 μm.
f. Representative confocal micrographs showing EPI-like cysts at indicated time points stained for EZRIN (top) or E-CADHERIN (E-CAD) and LAMININ (LAM; bottom). DAPI counterstains nuclei. Some EPI-like cysts initiate lumenogenesis with multiple small EZRIN+ lumenal cavities, which gradually resolve into a single central lumen, likely through cavity fusion. Scale bars, 40 μm. Experiments were repeated three times with similar results.
g. Representative confocal micrographs showing X-Y, X-Z and Y-Z sections of EPI-like cysts obtained at t = 36 h stained for E-CAD and EZRIN. DAPI counterstains nuclei. Scale bars, 40 μm. Experiments were repeated twice with similar results.
h. Percentage of EPI-like cysts with single, multiple or no lumenal cavities at indicated time points. ncyst = 59, 57, 60, 89 and 110 for t = 0 h, 6 h, 12 h, 24 h and 36 h, respectively. Data were pooled from n = 2 (0 h, 6 h, 12 h) or 3 (24 h and 36 h) independent experiments. Data represent the mean ± s.e.m.
i. Cell number in each EPI-like cyst as a function of time. ncyst = 26 for each time point. Data were pooled from n = 2 independent experiments. Red lines represent the median.
j. Equivalent EPI-like cyst diameter as a function of time. ncyst = 56, 45, 50, 115 and 88 for t = 0 h, 6 h, 12 h, 24 h and 36 h, respectively. Data were pooled from n = 3 independent experiments. Red lines represent the median.
k. Embedded EPI-like cyst perimeter percentage as a function of time. ncyst = 33, 35, 26, 28 and 21 for t = 0 h, 6 h, 12 h, 24 h and 36 h, respectively. Data were pooled from n = 2 independent experiments. Red lines represent the median.
l. Representative confocal micrographs showing EPI-like cysts at t = 36 h stained for ZO1 and ACTIN (top) or GM130 and ACTIN (bottom). DAPI counterstains nuclei. Zoom-in images show magnified views of boxed regions. Scale bars, 40 μm. Experiments were repeated twice with similar results.
m. Representative confocal micrographs showing EPI-like cysts obtained at t = 36 h with indicated drugs supplemented into BM from t = 0 - 36 h. IWP2, 5 μM; LDN 193189 or LDN, 0.5 μM; SB 431542 or SB, 10 μM; Caspase 3 inhibitor Z-DEVD-FMK or Cas 3, 10 μM. Cysts were stained for NANOG and ECAD. Fluorescently labeled wheat germ agglutinin (WGA) is used for staining of plasma membrane. DAPI counterstains nuclei. Note that assays were also conducted using Z-DEVD-FMK of other concentrations (5 μM, 20 μM and 40 μM), with results compatible with those obtained from 10 μM Z-DEVD-FMK. Scale bars, 40 μm. Experiments were repeated twice with similar results.
n. Equivalent EPI-like cyst diameter at t = 36 h under indicated conditions. ncyst = 142, 37, 44, 40 and 36 for control, IWP2, LDN, SB and Cas 3 conditions, respectively. Data were pooled from n = 2 independent experiments. Red lines represent the median.
Extended Data Figure 2. Progressive development of posteriorized embryonic-like sac.
a. Protocol for generating posteriorized embryonic-like sacs (P-ELS). After initial seeding and clustering of hESCs (t = −18 - 0 h), lumenogenesis leads to the formation of the EPI-like cyst containing a single central lumen. BMP4 stimulation (50 ng mL−1) from the induction channel from t = 0 h onwards leads to patterning of the EPI-like cyst and formation of the asymmetric embryonic-like sac, with specification of the amniotic ectoderm-like fate to cells directly exposed to BMP4 induction. Development of the P-ELS triggers the onset of gastrulation-like events and expression of BRACHYURY (T) in the EPI-like compartment of the P-ELS. Bright field image shows an array of P-ELS at t = 36 h. Scale bar, 80 μm. Experiments were repeated five times with similar results.
b. Percentage of P-ELS and uniformly squamous AM-like cysts at t = 36 h. Representative phase contrast micrographs are shown. Scale bar, 40 μm. ncyst = 396 from n = 5 independent experiments. Each dot represents data obtained from an independent experiment. Red lines represent the median.
c. Cell number in each cyst as a function of time. ncyst = 26 for each time point. Data were pooled from n = 2 independent experiments. Red lines represent the median.
d. Representative confocal micrographs showing X-Y, X-Z and Y-Z sections of P-ELS at t = 36 h stained for E-CADHERIN (E-CAD) and EZRIN. DAPI counterstains nuclei. Scale bars, 40 μm. Experiments were repeated twice with similar results.
e. Representative confocal micrographs showing P-ELS at t = 36 h stained for phosphorylated SMAD1/5 (pSMAD1/5) and TFAP2A. DAPI counterstains nuclei. Scale bars, 40 μm. Experiments were repeated three times with similar results.
f. Representative confocal micrographs showing P-ELS at indicated time points co-stained for NANOG and CDX2 (left) or T and E-CAD (right). DAPI counterstains nuclei. Scale bars, 40 μm. Experiments were repeated three times with similar results.
g. Representative confocal micrographs showing AM-like tissues at t = 72 h stained for E-CAD, GATA3 and OCT4, TFAP2A and T, or TFAP2C and NANOG as indicated. Bottom images show magnified views of AM-like tissues. DAPI counterstains nuclei. Scale bars, 40 μm (zoom-in) and 160 μm. Experiments were repeated five times with similar results.
h. Thickness of AM-like tissue as a function of time. ncyst = 267, 167, 258 and 111 for t = 24 h, 30 h, 36 h and 72 h, respectively. Data were pooled from n = 5 independent experiments. Red lines represent the median.
i. In situ hybridization (ISH) images of P-ELS at t = 24 h and t = 36 h for BMP4 (left) and AXIN2 (right). Scale bars, 40 μm. Experiments were repeated twice with similar results.
j. ISH images of P-ELS at t = 36 h for ACTB (top) and dapB (bottom). Scale bars, 40 μm. Experiments were repeated twice with similar results.
k. Left: Bright field and fluorescent micrographs showing P-ELS at t = 36 h blocking diffusion of fluorescein-labeled Dextran (70 kDa) into the cell loading channel. Dextran was supplemented into the induction channel and diffused into the gel channel. Experiments were repeated twice with similar results. Scale bar, 40 μm. Right: Plot showing relative fluorescence intensity within the cell loading channel and induction channel. Data is normalized to the average intensity in the cell loading channel. Our characterization of Dextran diffusion shows that the supporting posts and in-between expanding P-ELS effectively block morphogen diffusion across the tissues. ncyst = 10. Data were pooled from n = 2 independent experiments. Red lines represent the median.
Extended Data Figure 3. Progressive development of anteriorized embryonic-like sac.
a. Protocol for generating A-ELS. BMP4 (50 ng mL−1) stimulation from the induction channel leads to patterning of the EPI-like cyst; cells directly exposed to BMP4 are specified to the AM-like fate. Inhibition of BMP and WNT signaling by adding NOGGIN (50 ng mL−1) and IWP2 (5 μM) in the cell loading channel prevents the EPI-like compartment from losing pluripotency and initiating gastrulation-like events. Bright field image shows an array of A-ELS at t = 36 h. Scale bar, 80 μm. Experiments were repeated three times with similar results.
b. Percentage of A-ELS and uniformly squamous AM-like cysts at t = 36 h. Representative phase contrast micrographs are shown. Scale bar, 40 μm. ncyst = 212 from n = 4 independent experiments. Each dot represents data obtained from an independent experiment. Red lines represent the median.
c. Cell number in each cyst as a function of time. ncyst = 26 for each time point. Data were pooled from n = 2 independent experiments. Red lines represent the median.
d. Representative confocal micrographs showing A-ELS at t = 36 h stained for phosphorylated SMAD1/5 (pSMAD1/5) or TFAP2A. DAPI counterstains nuclei. Scale bars, 40 μm. Experiments were repeated three times with similar results.
e. Representative confocal micrographs showing A-ELS at indicated time points stained for NANOG, E-CADHERIN (E-CAD) and BRACHYURY (T). DAPI counterstains nuclei. Scale bars, 40 μm. Experiments were repeated three times with similar results.
f. Thickness of AM-like tissue in A-ELS as a function of time. ncyst = 71, 100 and 106 for t = 24 h, 30 h and 36 h, respectively. Data were pooled from n = 3 independent experiments. Red lines represent the median.
Extended Data Figure 4. Specification of human primordial germ cell-like cells in posteriorized embryonic-like sac.
a. Specification of PGCs or PGCLCs in the non-human primate embryo (left; Ref. [21]) and P-ELS (right).
b. Representative confocal micrographs showing P-ELS stained for TFAP2C, NANOG and SOX17 or BLIMP1 and SOX17 at indicated time points. DAPI counterstains nuclei. TFAP2C+SOX17− and SOX17+TFAP2C− cells are marked by green arrows. T-FAP2C+SOX17+ cells are identified as nascent, early-stage hPGCLCs. The AM-like tissue is divided into 4 quadrants: 2 middle quadrants furthest away from the EPI-like pole as central AM-like compartment (CEN-AM), and 2 quadrants at the junction of EPI-like and AM-like compartments as EPI-AM. TFAP2C+SOX17+ hPGCLCs in the CEN-AM, EPI-AM and EPI-like compartments are marked by blue, yellow and white arrowheads, respectively. Scale bars, 40 μm. Experiments were repeated three times with similar results.
c. Left: Dot plot of the numbers of TFAP2C+ and SOX17+ cells at indicated time points. Right: Dot plot of the numbers of TFAP2C+SOX17+ and TFAP2C+ NANOG+SOX17+ hPGCLCs at indicated time points. ncyst = 85, 92, 82 and 80 for t = 24 h, 28 h, 32 h and 36 h, respectively. Data were pooled from n = 3 independent experiments. Red lines represent the median.
d. Left: Spatial distribution of TFAP2C+ and SOX17+ cells at indicated time points. Right: Spatial distribution of TFAP2C+SOX17+ and TFAP2C+ NANOG+ SOX17+ hPGCLCs at indicated time points. ncyst = 85, 92, 82 and 80 for t = 24 h, 28 h, 32 h and 36 h, respectively. Data were pooled from n = 3 independent experiments.
e. Representative confocal micrographs showing P-ELS at t = 36 h stained for TFAP2C, BRACHYURY (T) and SOX17. DAPI counterstains nuclei. T-expressing (T-FAP2C+SOX17+T+) and –non-expressing (TFAP2C+SOX17+T−) hPGCLCs are marked by blue and green arrowheads, respectively. Scale bars, 40 μm. Experiments were repeated three times with similar results.
f. Representative confocal micrographs showing P-ELS treated with different doses of the gp130 inhibitor SC144 (top: 0.4 μM; bottom: 2 μM). P-ELS were stained for TFAP2C, NANOG and SOX17 at t = 36 h. DAPI counterstains nuclei. TFAP2C+SOX17+ hPGCLCs in the EPI-AM and EPI-like compartments are marked by yellow and white arrowheads, respectively. Higher doses of SC144 (8 μM) caused significant cell death (data not shown). Scale bars, 40 μm. Experiments were repeated twice with similar results.
Extended Data Figure 5. Microfluidic modeling of human epiblast and amnion development using hESC (H1) and hiPSC maintained in mTeSR medium as well as hESC (H9) maintained in Essential 8 medium (E8-H9).
a. Microfluidic generation of EPI-like cysts. Schematic at left shows culture conditions and cartoons of EPI-like cyst development. Representative confocal micrographs at right show EPI-like cysts generated from H1 hESC, hiPSC and E8-H9 hESC at t = 36 h stained for OCT4, NANOG, SOX2, E-CADHERIN (E-CAD) and LAMININ (LAM) as indicated. Fluorescently labeled wheat germ agglutinin (WGA) is used for staining of plasma membrane.
b. Microfluidic generation of P-ELS. Schematic shows culture conditions and cartoons of P-ELS development. Representative confocal micrographs show P-ELS generated from H1 hESC, hiPSC and E8-H9 hESC at t = 36 h stained for TFAP2A, OCT4 and BRACHYURY (T) (top); CDX2, NANOG and T (middle); TFAP2C, NANOG and SOX17 (bottom). TFAP2C+NANOG+SOX17+ hPGCLCs are marked by white arrowheads.
c. Microfluidic generation of A-ELS. Culture conditions and cartoons of A-ELS development are shown. Representative confocal micrographs show A-ELS generated from H1 hESC, hiPSC and E8-H9 hESC at t = 36 h stained for OCT4 and NANOG (top); TFAP2A, NANOG and T (bottom). Fluorescently labeled WGA is used for staining of plasma membrane.
For a-c, DAPI counterstains nuclei. Scale bars, 40 μm. Experiments were repeated twice with similar results.
Extended Data Figure 6. Exogenous WNT or ACTIVIN alone is insufficient for generating asymmetric embryonic-like sacs.
Schematics show different culture protocols in which WNT3A (50 ng mL−1), ACTIVIN A (50 ng mL−1) and / or BMP4 (50 ng mL−1) are supplemented into the basal medium (BM) in the induction channel as indicated. All cystic tissues were obtained at t = 30 h.
a. Representative confocal micrographs showing cysts stained for CDX2, EOMES and BRACHYURY (T) or OCT4 and NANOG.
b. Representative confocal micrographs showing cysts stained for CDX2, EOMES and T or OCT4 and NANOG.
c. Representative confocal micrographs showing cysts stained for CDX2, NANOG and T or TFAP2A and T.
d. Representative confocal micrographs showing cysts stained for CDX2, EOMES and T or TFAP2A and T.
For a-d, DAPI counterstains nuclei. Scale bars, 40 μm. Experiments were repeated three times with similar results.
Extended Data Figure 7. Molecular characterization of posterior and anterior primitive streak-like cell development.
a. Schematic showing posterior PS-like cell development in P-ELS at t = 48 h with BMP4 (50 ng mL−1) supplemented into the basal medium (BM) in the cell loading channel. At right, bright field image shows an array of P-ELS at t = 48 h. Scale bar, 80 μm.
b. Representative confocal micrographs show P-ELS stained for E-CADHERIN (E-CAD) and N-CADHERIN (N-CAD) at indicated time points. Thickening of the EPI-like tissue prior to the onset of cell dissemination from the PrePS-EPI-like compartment was evident. Zoom-in images show magnified views of boxed regions.
c. Dot plot of the thickness of the EPI-like tissue at indicated time points. For t = 24 h, ncyst = 107 and 116 for EPI-like cysts and P-ELS, respectively. For t = 30 h, ncyst = 79 and 135 for EPI-like cysts and P-ELS, respectively. Data were pooled from n = 4 independent experiments. Red lines represent the median.
d. Representative confocal micrographs showing P-ELS stained for CDX2, EOMES and BRACHYURY (T) at indicated time points. Zoom-in images show magnified views of boxed regions. Intensity maps show relative intensities of corresponding markers as indicated.
e. Representative confocal micrographs show P-ELS stained for TFAP2C, NANOG and SOX17 (left) or BLIMP1 and SOX17 (right) at t = 48 h. Zoom-in images show magnified views of boxed regions.
f. Schematic showing anterior PS-like cell development in P-ELS at t = 48 h with BMP4 (50 ng mL−1) and ACTIVIN A (50 ng mL−1) supplemented into the cell loading and induction channels, respectively. At right, bright field image shows an array of P-ELS at t = 48 h. Scale bar, 80 μm.
g. Representative confocal micrographs showing staining for E-CAD, N-CAD, CDX2, EOMES and T at indicated time points. Zoom-in images show magnified views of boxed regions.
h. Representative confocal micrographs show staining for CDX2, EOMES and T at t = 48 h. Zoom-in images show magnified views of boxed regions. Intensity maps show relative intensities of corresponding markers as indicated.
i. Representative confocal micrographs show staining for TFAP2C, NANOG and SOX17 at t = 48 h. Zoom-in images show magnified views of boxed regions.
In all immunostaining micrographs, DAPI counterstains nuclei, with scale bars of 40 μm. Experiments were repeated twice with similar results.
Extended Data Figure 8. Cell type identification and characterization using single-cell RNA sequencing (scRNA-seq).
a. Workflow. P-ELS were collected from 6 microfluidic devices at t = 48 h and were dissociated into single cells. AMLCs obtained using the transwell method (Transwell-AMLC) and hESCs cultured on tissue culture plates were dissociated into single cells before the cells were mixed at a 1:2 ratio. scRNA-seq was conducted using 10× Genomics and Illumina HiSeq 4000. Single-cell transcriptome data of P-ELS, Transwell-AMLC and hESC were merged and analyzed.
b. t-distributed stochastic neighbor embedding (tSNE) plot generated from scRNA-seq data of a total of 9,966 cells, revealing 6 distinct, color-coded cell populations (“hESC”, “Transwell-AMLC”, “AMLC”, “hPGCLC”, “Mesoderm-like cell (MeLC)1” and “MeLC2”). Cell numbers of each population are indicated.
c. Violin plots of log-transformed, normalized expression levels of genes associated with pluripotency (POU5F1 / OCT4, SOX2, NANOG, PODXL and DPPA4), hPGC (SOX17, TFAP2C, NANOS3, PRDM1 / BLIMP1 and PDPN), AM (TFAP2A, GATA3, HAND1, C8orf4 and IGFBP3), mesoderm (BRACHYURY / T, EOMES, MIXL1, LHX1, MESP2, MESP1, GATA6, LEF1, CDX2 and SNAI2), and HOX proteins (HOXB6, HOXB7, HOXB8, HOXB9 and HOXA10) in the 6 cell populations as indicated. All cells in b are used for violin plots.
d. Heat map of relative expression (Z-score) of Top-20 gene signatures distinguishing each cell population.
e. DEGs during lineage diversification and cell-fate specification in the development of P-ELS. Top: Red and blue bars indicate the numbers of up- and down-regulated DEGs, respectively, in the indicated pair-wise comparisons. Bottom: Enrichment of Gene Ontology terms and representative genes in DEGs in the indicated pair-wise comparisons.
f. Heat map of log-transformed expression levels of selected genes among indicated cell types including those reported by others [21, 23]. Genes are grouped based on their associations with embryonic cell fates, cellular functions, developmental signaling, or Top-20 DEG status. Left: Comparisons among Cy monkey EPI (CyEPI) lineage, “hESC” and “MeLC1”. Middle: Comparisons among “hESC”, “AMLC” and “Transwell-AMLC”. Top-20 DEGs are identified from those upregulated in “AMLC” against “hESC” (“AMLC” > “hESC”). Right: Comparisons between CyEPI, CyPGC, “hESC” and “hPGCLC”.
g. Heat map of correlation coefficients among indicated cell types including those reported by others [21, 23, 25, 26]. Comparisons between “hESC”, “MeLC1”, “MeLC2” and CyEPI lineages are based on ontogenic genes identified for CyEPI (651 in common out of 776) [23]. Comparisons between “hPGCLC”, CyPGC, hPGCLC and hPGC are based on ontogenic CyPGC genes (477 in common out of 544) [21]. Comparisons between “hESC”, “Transwell-AMLC” and “AMLC” are based on Top-500 DEGs identified in “AMLC” against “hESC”. Correlation coefficient is calculated using averages of log-transformed expression of common genes.
In f & g, CyEPI lineages: ICM, inner cell mass, embryonic day (E) 6; Pre, pre-implantation EPI, E7 - E9; PostE and PostL, post-implantation early (E13 – E14) and late (E16 – E17) EPI, respectively; Gas1/2a/2b, gastrulating cells, E13 – E17. For CyPGC and hPGC: ePGC, early CyPGC, E13 – E20; lPGC, late gonadal CyPGC, E36 – E55, or late gonadal hPGC, E45 – E48. Embryonic days are indicated below the heat maps, and color bars above and besides the heat maps indicate cell types. All genes are listed in Supplementary Table 1.
Extended Data Figure 9. Inductive effect of amniotic ectoderm-like cells on the onset of gastrulation-like events.
a. Schematic showing P-ELS; the PrePS-EPI-like compartment is divided into 4 quadrants (R1, R2, R3 and R4) for quantitation. BM, basal medium, consists E6 and FGF2 (20 ng mL−1). BMP4 (50 ng mL−1) is supplemented into the cell loading channel for the development of P-ELS.
b. Fluorescent and composite images showing dynamic BRACHYURY (T) expression in the PrePS-EPI-like compartment at indicated time points. Experiments were repeated twice with similar results.
c. Top: Dot plots of relative T intensity in different quadrants of the PrePS-EPI-like compartment at indicated time points. Red lines represent the median. Bottom: Spatial maps of average relative T intensity at indicated time points. ncyst = 22 (24 h), 20 (30 h) and 20 (36 h), respectively. Data were pooled from n = 2 independent experiments.
d. Live imaging with T-mNeonGreen hESC reporter line to track dynamic T expression in the PrePS-EPI-like compartment during the development of P-ELS.
e. Characterization of T-mNeonGreen hESC reporter line showing co-localization of neon green signal and immunostaining of T.
f. Representative confocal micrographs showing development of AMLCs by culturing hESCs on transwell membranes in basal medium (BM) supplemented with BMP4 (50 ng mL−1) for 48 h. Cells were stained for CDX2, NANOG and T (top) or TFAP2A and OCT4 (bottom).
g. Representative confocal micrographs showing AMLCs stained for CDX2, NANOG and T (top) or TFAP2A and OCT4 (bottom). AMLCs were generated from hESCs by first culturing in BM supplemented with BMP4 for 48 h before switching to fresh BM for another 48 h.
h. Transwell co-culture assays of AMLCs and hESCs. hESCs were first differentiated into AMLCs by culturing on transwell membranes in BM supplemented with BMP4 for 48 h. Culture medium was then switched to fresh BM before undifferentiated hESCs were seeded onto transwell membranes and co-cultured with AMLCs for another 48 h. Representative confocal micrographs show staining for CDX2, NANOG and T (top); TFAP2A, OCT4 and T (middle); E-CADHERIN (E-CAD), N-CADHERIN (N-CAD) and T (bottom).
i. Transwell co-culture assays of AMLCs and hESCs. hESCs were first differentiated into AMLCs by culturing on transwell membranes in BM supplemented with BMP4 (50 ng mL−1) for 48 h. Culture medium was then switched to fresh BM before undifferentiated hESCs were seeded onto the lower dish and co-cultured with AMLCs for another 48 h. Representative confocal micrographs show staining of cells on the lower dish for OCT4 and T (top); NANOG and T (middle); TFAP2C, NANOG and SOX17 (bottom), or cells on the transwell membrane for TFAP2C, NANOG and SOX17 as indicated.
In all immunostaining micrographs, DAPI counterstains nuclei. Boxed images show magnified views of selected areas. For h, zoom-in views are for hESC colonies seeded after AMLC differentiation as marked by white arrowheads. Scale bars in b, d & e, 40 μm. Scale bars in f - i, 160 μm and 10 μm (zoom-in views). Experiments were repeated three times with similar results.
Extended Data Figure 10. Mesoderm-like cell induction in posteriorized embryonic-like sac is inhibited by IWP2 but not by IWR1.
a. Schematic on the left shows transwell co-culture protocol. BM, basal medium, consists E6 and FGF2 (20 ng mL−). hESCs were first differentiated into AMLCs by culturing in BM supplemented with BMP4 (50 ng mL−) for 48 h. Culture medium was then switched to fresh BM supplemented with IWP2 (5 μM). At this point, undifferentiated hESCs were seeded onto transwell membranes and co-cultured with AMLCs for another 48 h. Representative confocal micrographs showing staining for CDX2, NANOG and BRACHYFJRY (T; top) or TFAP2A and OCT4 (bottom). Zoom-in views are for hESC colonies seeded after AMLC differentiation as marked by white arrowheads. Scale bars, 160 μm and 10 μm (zoom-in views).
b. Live imaging with the 6×TCF/Lef-hsp68-H2B-EGFP H9 hESC reporter line to track WNT/β-CATENIN signaling dynamics during embryonic-like sac development with or without WNT inhibitors IWR1 (10 μM) or IWP2 (5 μM) supplemented into the induction channel as indicated. Scale bars, 40 μm.
c. Representative confocal micrographs show P-ELS obtained at t = 48 h with IWR1 (10 μM) supplemented into the induction channel as indicated. P-ELS were stained for CDX2, EOMES and T (top) or TFAP2C, NANOG and SOX17 (bottom). Zoom-in images show magnified views of boxed regions. Scale bars, 40 μm.
For a & c, DAPI counterstains nuclei. Experiments were repeated twice with similar results.
Supplementary Material
ACKNOWLEDGMENTS
This work is supported by the University of Michigan Mechanical Engineering Startup Fund (J.F.), the Michigan-Cambridge Research Initiative (J.F.), the National Institutes of Health (R01 DK089933, D.L.G.) and the California Institute for Regenerative Medicine (RB5-07409, V.M.W.). Y.S. was partially supported by the University of Michigan Rackham Predoctoral Fellowship. The Lurie Nanofabrication Facility at the University of Michigan, a member of the National Nanotechnology Infrastructure Network (NNIN) funded by the National Science Foundation, is acknowledged for support in microfabrication.
Footnotes
COMPETING FINANCIAL INTERESTS
Y.Z., Y.S., S.N.E., D.L.G. and J.F. have filed a provisional patent related to this work (United States Provisional Patent Application No. 62/431,907).
REFERENCES
- 1.O'Rahilly R & Müller F Developmental Stages in Human Embryos. (Carnegie Institution of Washington, 1987). [Google Scholar]
- 2.Rossant J Mouse and human blastocyst-derived stem cells: vive les differences. Development 142, 9–12 (2015). [DOI] [PubMed] [Google Scholar]
- 3.Davidson KC, Mason EA & Pera MF The pluripotent state in mouse and human. Development 142, 3090–3099 (2015). [DOI] [PubMed] [Google Scholar]
- 4.Deglincerti A et al. Self-organization of the in vitro attached human embryo. Nature 533, 251–254 (2016). [DOI] [PubMed] [Google Scholar]
- 5.Shahbazi MN et al. Self-organization of the human embryo in the absence of maternal tissues. Nat. Cell Biol 18, 700–708 (2016). [DOI] [PMC free article] [PubMed] [Google Scholar]
- 6.Daley GQ et al. Setting global standards for stem cell research and clinical translation: The 2016 ISSCR guidelines. Stem Cell Rep. 6, 787–797 (2016). [DOI] [PMC free article] [PubMed] [Google Scholar]
- 7.Hyun I, Wilkerson A & Johnston J Revisit the 14-day rule. Nature 533, 169–171 (2016). [DOI] [PubMed] [Google Scholar]
- 8.ten Berge D et al. Wnt signaling mediates self-organization and axis formation in embryoid bodies. Cell Stem Cell 3, 508–518 (2008). [DOI] [PMC free article] [PubMed] [Google Scholar]
- 9.van den Brink SC et al. Symmetry breaking, germ layer specification and axial organisation in aggregates of mouse embryonic stem cells. Development 141, 4231–4242 (2014). [DOI] [PMC free article] [PubMed] [Google Scholar]
- 10.Warmflash A, Sorre B, Etoc F, Siggia ED & Brivanlou AH A method to recapitulate early embryonic spatial patterning in human embryonic stem cells. Nat. Methods 11, 847–854 (2014). [DOI] [PMC free article] [PubMed] [Google Scholar]
- 11.Harrison SE, Sozen B, Christodoulou N, Kyprianou C & Zernicka-Goetz M Assembly of embryonic and extra-embryonic stem cells to mimic embryogenesis in vitro. Science 356, eaal1810 (2017). [DOI] [PubMed] [Google Scholar]
- 12.Shao Y et al. Self-organized amniogenesis by human pluripotent stem cells in a biomimetic implantation-like niche. Nat. Mater 16, 419–425 (2017). [DOI] [PMC free article] [PubMed] [Google Scholar]
- 13.Xue X et al. Mechanics-guided embryonic patterning of neuroectoderm tissue from human pluripotent stem cells. Nat. Mater 17, 633–641 (2018). [DOI] [PMC free article] [PubMed] [Google Scholar]
- 14.Beccari L et al. Multi-axial self-organization properties of mouse embryonic stem cells into gastruloids. Nature 562, 272–276 (2018). [DOI] [PubMed] [Google Scholar]
- 15.Shao Y et al. A pluripotent stem cell-based model for post-implantation human amniotic sac development. Nat. Commun 8, 208 (2017). [DOI] [PMC free article] [PubMed] [Google Scholar]
- 16.Rivron NC et al. Blastocyst-like structures generated solely from stem cells. Nature 557, 106–111 (2018). [DOI] [PubMed] [Google Scholar]
- 17.Rivron NC et al. Debate ethics of embryo models from stem cells. Nature 564, 183–185 (2018). [DOI] [PubMed] [Google Scholar]
- 18.Shahbazi MN et al. Pluripotent state transitions coordinate morphogenesis in mouse and human embryos. Nature 552, 239 (2017). [DOI] [PMC free article] [PubMed] [Google Scholar]
- 19.Taniguchi K et al. Lumen formation is an intrinsic property of isolated human pluripotent stem cells. Stem Cell Rep. 5, 954–962 (2015). [DOI] [PMC free article] [PubMed] [Google Scholar]
- 20.Dobreva MP et al. Periostin as a biomarker of the amniotic membrane. Stem Cells Int. 2012, 987185 (2012). [DOI] [PMC free article] [PubMed] [Google Scholar]
- 21.Sasaki K et al. The germ cell fate of cynomolgus monkeys is specified in the nascent amnion. Dev. Cell 39, 169–185 (2016). [DOI] [PubMed] [Google Scholar]
- 22.Bernardo AS et al. BRACHYURY and CDX2 mediate BMP-induced differentiation of human and mouse pluripotent stem cells into embryonic and extraembryonic lineages. Cell Stem Cell 9, 144–155 (2011). [DOI] [PMC free article] [PubMed] [Google Scholar]
- 23.Nakamura T et al. A developmental coordinate of pluripotency among mice, monkeys and humans. Nature 537, 57–62 (2016). [DOI] [PubMed] [Google Scholar]
- 24.Kobayashi T et al. Principles of early human development and germ cell program from conserved model systems. Nature 546, 416–420 (2017). [DOI] [PMC free article] [PubMed] [Google Scholar]
- 25.Irie N et al. SOX17 is a critical specifier of human primordial germ cell fate. Cell 160, 253–268 (2015). [DOI] [PMC free article] [PubMed] [Google Scholar]
- 26.Sasaki K et al. Robust in vitro induction of human germ cell fate from pluripotent stem cells. Cell Stem Cell 17, 178–194 (2015). [DOI] [PubMed] [Google Scholar]
- 27.Aramaki S et al. A mesodermal factor, T, specifies mouse germ cell fate by directly activating germline determinants. Dev. Cell 27, 516–529 (2013). [DOI] [PubMed] [Google Scholar]
- 28.Mendjan S et al. NANOG and CDX2 pattern distinct subtypes of human mesoderm during exit from pluripotency. Cell Stem Cell 15, 310–325 (2014). [DOI] [PubMed] [Google Scholar]
- 29.Gadue P, Huber TL, Paddison PJ & Keller GM Wnt and TGF-β signaling are required for the induction of an in vitro model of primitive streak formation using embryonic stem cells. Proc. Natl. Acad. Sci. U.S.A 103, 16806–16811 (2006). [DOI] [PMC free article] [PubMed] [Google Scholar]
- 30.Séguin CA, Draper JS, Nagy A & Rossant J Establishment of endoderm progenitors by SOX transcription factor expression in human embryonic stem cells. Cell Stem Cell 3, 182–195 (2008). [DOI] [PubMed] [Google Scholar]
- 31.Villa-Diaz LG et al. Synthetic polymer coatings for long-term growth of human embryonic stem cells. Nat. Biotechnol 28, 581–583 (2010). [DOI] [PMC free article] [PubMed] [Google Scholar]
- 32.Watanabe K et al. A ROCK inhibitor permits survival of dissociated human embryonic stem cells. Nat. Biotechnol 25, 681–686 (2007). [DOI] [PubMed] [Google Scholar]
- 33.Zheng Y and Fu J Protocol for controlled modeling of human epiblast and amnion development using stem cells. Protocol Exchange (2019). DOI: 10.21203/rs.2.11520/v1. [DOI] [PMC free article] [PubMed] [Google Scholar]
- 34.Lacoste A, Berenshteyn F & Brivanlou AH An efficient and reversible transposable system for gene delivery and lineage-specific differentiation in human embryonic stem cells. Cell Stem Cell 5, 332–342 (2009). [DOI] [PubMed] [Google Scholar]
- 35.Cong L et al. Multiplex genome engineering using CRISPR/Cas systems. Science 339, 819–823 (2013). [DOI] [PMC free article] [PubMed] [Google Scholar]
- 36.Butler A, Hoffman P, Smibert P, Papalexi E & Satija R Integrating single-cell transcriptomic data across different conditions, technologies, and species. Nat. Biotechnol 36, 411–420 (2018). [DOI] [PMC free article] [PubMed] [Google Scholar]
- 37.Satija R, Farrell JA, Gennert D, Schier AF & Regev A Spatial reconstruction of single-cell gene expression data. Nat. Biotechnol 33, 495–502 (2015). [DOI] [PMC free article] [PubMed] [Google Scholar]
Associated Data
This section collects any data citations, data availability statements, or supplementary materials included in this article.
Supplementary Materials
Data Availability Statement
Data supporting the findings of this study are available within the article and its supplementary information files and from the corresponding author upon request. scRNA-seq data are also available at the Gene Expression Omnibus (GSE134571; www.ncbi.nlm.nih.gov/geo). All source data for graphs included in the paper are available for download from Nature.


