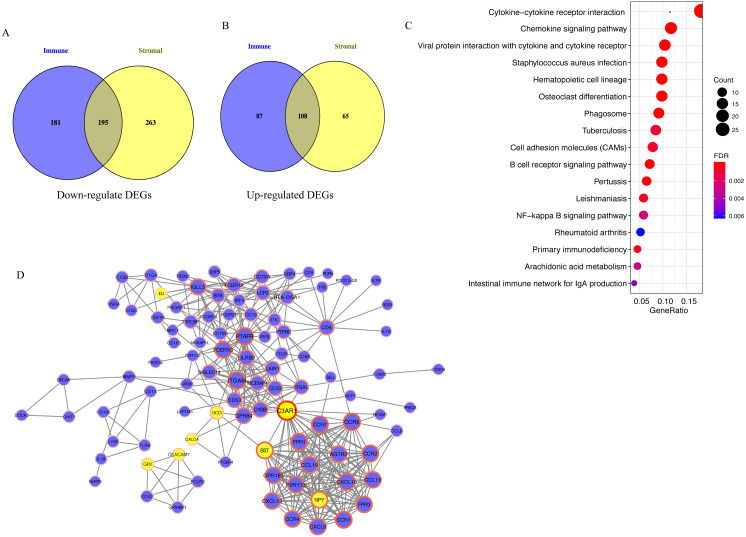
Figure 3. Analysis of 303 overlapping DEGs.
Analysis of 303 overlapping DEGs, including (A) 195 downregulated and (B) 108 upregulated overlapping DEGs. (C) Kyoto Encyclopedia of Genes and Genomes analysis of DEGs. (D) Protein-protein interaction network with confidence >0.9. Blue and yellow nodes represent upregulated and downregulated genes, respectively. DEGs, differentially expressed genes.

