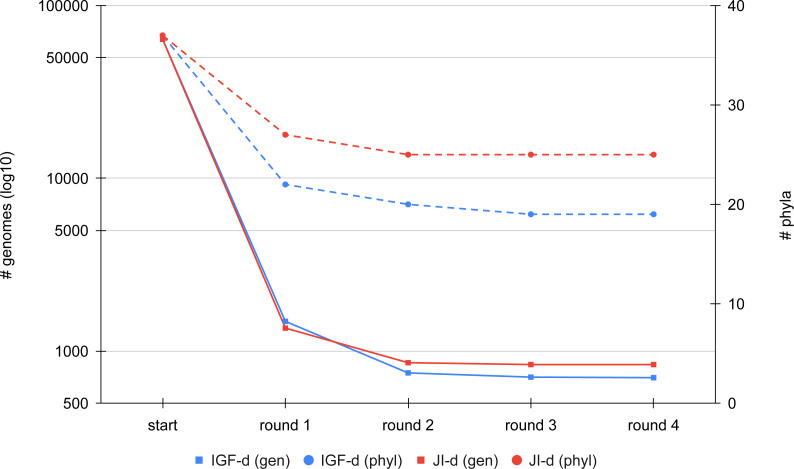
Figure 3. Comparison of the dereplication kinetics of TQMD when varying the distance metric.
Two runs were launched on all RefSeq Bacteria (63,836 genomes; 37 phyla) using the direct strategy, a pack size of 200 and the loose clustering mode, one with the Jaccard Index (JI-d, distance threshold of 0.84, red curves) and one with the Identical Genome Fraction (IGF-d, distance threshold of 0.66, blue curves). The left Y-axis shows the log10 of the number of remaining genomes (square dots and solids lines), whereas the right Y-axis shows the number of phyla for which at least one representative is still present at a given round of dereplication (round dots and dashed lines).

