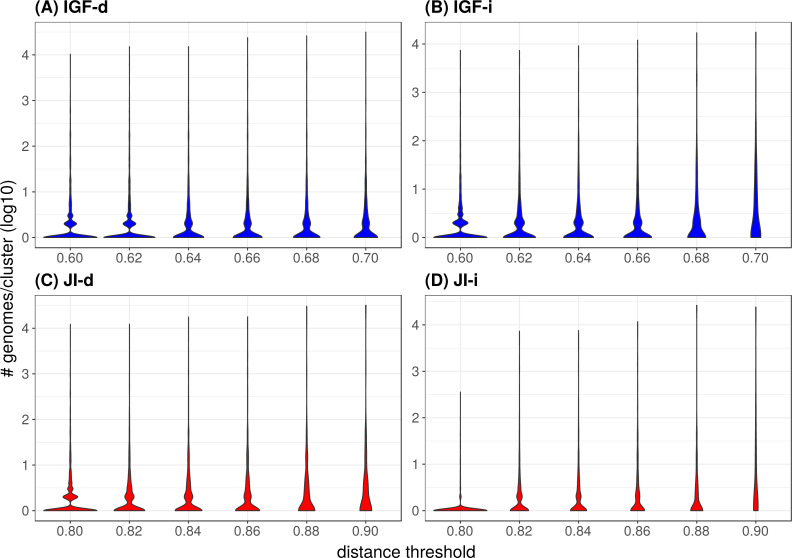
Figure 4. Distribution of the number of genomes per cluster when varying the distance metric, the distance threshold or the clustering strategy.
(A) IGF-d, (B) IGF-i, (C) JI-d, (D) JI-i. These violin plots are a companion to Table 3 and abbreviations are as in the latter table. The Y-axes are in log10 units and the violin plot width is proportional to the number of clusters containing the given number of genomes.

