Abstract
Acoustic radiation force optical coherence elastography (ARF-OCE) has been successfully implemented to characterize the biomechanical properties of soft tissues such as the cornea and the retina with high resolution using single-element ultrasonic transducers for ARF excitation. Most currently proposed OCE techniques, such as air-puff and ARF, have less capability to control the spatiotemporal information of the induced region of deformation, resulting in limited accuracy and low temporal resolution of the shear wave elasticity imaging. In this study, we propose a new method called 2D ultrasonic array-based optical coherence elastography imaging, which combines the advantages of 3D dynamic electronic steering of the 2D ultrasonic array and high-resolution optical coherence tomography (OCT). The 3D steering capability of the 2D array was first validated using a hydrophone. Then, the combined 2D ultrasonic array OCE system was calibrated using a homogenous phantom, followed by an experiment on ex vivo rabbit corneal tissue. The results demonstrate that our newly developed 2D ultrasonic array-based OCE system has the capability to map tissue biomechanical properties accurately, and therefore has the potential to be a vital diagnostic tool in ophthalmology.
Keywords: optical coherence elastography, 2D ultrasonic array, shear wave elastography, biomechanical properties
I. Introduction
AGING, disease, and other factors lead to changes in the biomechanical properties of the eye [1, 2]. Glaucoma, an optic neuropathy that is one of the main causes of irreversible blindness worldwide [3], has been shown to have a strong relationship with changes in the biomechanical properties of corneal tissue [1, 2, 4, 5]. Recent research predicts that there will be 80 million people suffering from glaucoma and over 3.2 million people blinded due to this disease burden [6]. Mechanical property changes in the cornea also carry important implications for medical interventions of the eye such as laser in situ keratomileusis (LASIK) [7]. LASIK procedures may cause a reduction in biomechanical integrity of the cornea and carry a potential risk for keratoconus, an ectatic corneal disorder, and iatrogenic keratectasia, a complication after LASIK that may compromise the integrity of the posterior stromal bed. [8–10] Optical Coherence Tomography (OCT), a recently developed high-resolution imaging modality, has been widely adopted in the clinic to assist ophthalmologists in the assessment of ocular disease. In recent research, Spectral Domain (SD)-OCT has been used for glaucoma diagnosis by measuring the average retinal nerve fiber layer (RNFL) thickness [11]. However, the ability of SD-OCT to discriminate healthy and glaucomatous eyes is limited [11]. Despite the fact that OCT imaging provides crucial information for the diagnosis of common eye conditions, its strength is limited in cases where disease is difficult to detect from subtle morphological changes only, especially at the early stages of disease progression.
Another example is keratoconus, for which the corneal biomechanical properties are important for early diagnosis [12]. Therefore, methods which can provide biomechanical properties at micrometer resolution hold significant promise for use in the clinical setting for diagnosis, as well as for the selection of therapies [13].
Different techniques, such as ocular response analyzer (ORA) and noncontact tonometry (Corvis ST, Oculus, Wetzlar, Germany), have been employed in clinical practice for measuring the biomechanical properties of cornea. These techniques analyze the response of the tissues to an air pulse to measure the tissues’ biomechanical properties [14, 15]. However, these methods can only be used to measure the average biomechanical properties of a large tissue area [1]. In addition, the air puff technique can generate large amplitude deformations in tissue, which leads to low accuracy results [13].
These issues limit the application of these techniques when mapping and detecting subtle stiffness differences of ocular diseases at an early stage.
Elastography is an imaging method with the capability to yield quantitative probing of biomechanical properties of soft tissue [16], making it a powerful tool for diagnosing diseases that lead to tissue elasticity changes such as cancer [17, 18] and fatty liver [19]. However, current clinically available elastography techniques such as ultrasound elastography [20, 21] and magnetic resonance elastography, do not produce high spatial resolution results, and are therefore inapplicable to ocular tissues which have thicknesses in the range of a few hundred microns [22–25]. Optical Coherence Elastography (OCE), utilizing high resolution OCT to detect the propagation of induced mechanical waves, has been recently developed to meet the requirements for ophthalmologic applications. The bandwidth and wavelength of generated mechanical waves for OCE depend on the temporal and spatial characteristics of the excitation push [1]. Currently utilized pushing sources for OCE imaging include either air-puff or pulsed laser excitation [1, 26, 27]. However, the air-puff method has certain limitations such as low bandwidth and low repetition rate while the pulsed laser approach has safety limitations. Compared with these pushing methods, acoustic radiation force (ARF) is non-contact, steerable in 2D with a matrix array, and is able to control the spatiotemporal characteristics of the induced mechanical waves, making it a promising pushing source for OCE.
In the current acoustic radiation force optical coherence elastography (ARF-OCE) approach, single-element-based ultrasonic transducers are typically used [28–30]. However, some disadvantages exist because of the natural characteristics of single-element ultrasonic transducers. First, the parameters of the transducer focal region – the beamwidth and depth of focus – are not adjustable. Second, the induced region of the pushing force is fixed unless there is mechanical scanning of the single-element ultrasonic transducer, which is an inherently time-consuming process. More recently, commercial 1D ultrasonic arrays with the capability to generate a steerable beam, have been applied in OCE systems ()[31]. However, commercial 1D arrays are designed for standard B-mode imaging, which requires wide bandwidth for high resolution. As a consequence, the output energy of the generated ARF force is insufficient due to the short pushing duration. In addition, array probes are not easily integrated with OCT systems in practice due to the inability to align them confocally. Lastly, the 1D ultrasonic array can only focus and steer the ARF beam along the azimuthal direction, resulting in significant sidelobes in the elevational direction. In addition, acoustic microtapping (AμT), as a method to generate ARF without using water as medium because of the application of an air coupled ultrasound transducer, is another promising approach [1, 32, 33]. But the high transmission voltage (up to 400Vpeak–to–peak) [32, 33] makes it difficult to design the array and system.
To overcome the limitations of the currently used ultrasonic transducers described above, we propose a novel 2D ultrasonic array-based OCT system. The 2D ultrasonic array is designed with a central opening as an optical window. In this paper, we will describe the design, fabrication, and evaluation of the new 2D array configuration. We will present results of the validated performance of the 2D array. A homogenous phantom was used for imaging tests and here we will present results that demonstrate the accuracy of the combined 2D array OCE system. Finally, we present imaging results on an ex vivo rabbit eye, demonstrating the applicability of the new system and technique to elastography imaging of ocular tissues.
II. Material and Methods
A. Array Design and Fabrication
A 2D ultrasonic array transducer with 3.5 MHz center frequency and 1.2λ pitch was designed for this study. Since the array was designed for excitation, the requirements of our array are different from arrays used for imaging. Single-element transducers having narrow bandwidth, with which acoustic waves with long pulse duration, and relatively low frequency are generated have been widely used for ARF pulse excitation [28, 29]. In this study, a similar concept is applied to a fully electronically controlled 2D array. To improve the performance for single frequency forcing, matching layers were not used at the front face of the array. We used an interposer filled with silver epoxy paste [Fig. 1(a)] as a light conducting backing and applied a PZT-Interposer-PCB structure [Fig. 1(b)] [34] for this array. Using the interposer as the backing relaxes the required tolerance on the flatness of the surface of the printed circuit board (PCB) or flexible printed circuit (FPC) for assembly. Normally, an interposer backing using acoustically attenuating material will provide significant attenuation of the acoustic wave, leading to reduced ringdown, and consequently a wider bandwidth at the expense of reduced receive sensitivity. This feature is advantageous for an imaging array, however not suitable for this design in which our main goal is to provide efficient forcing at a single design frequency. To match these requirements, we designed the interposer differently. To reduce the amount of backside attenuation, and thereby increase the resonance and output power of the elements, the conducting interposer pillars were designed to be a smaller volume fraction of the combined azimuthal and elevational pitch of the elements. In this way, the interposer is mainly a frame of acrylic, which makes it a low attenuation backing. More details of the array parameters are shown in Table I.
Fig. 1.
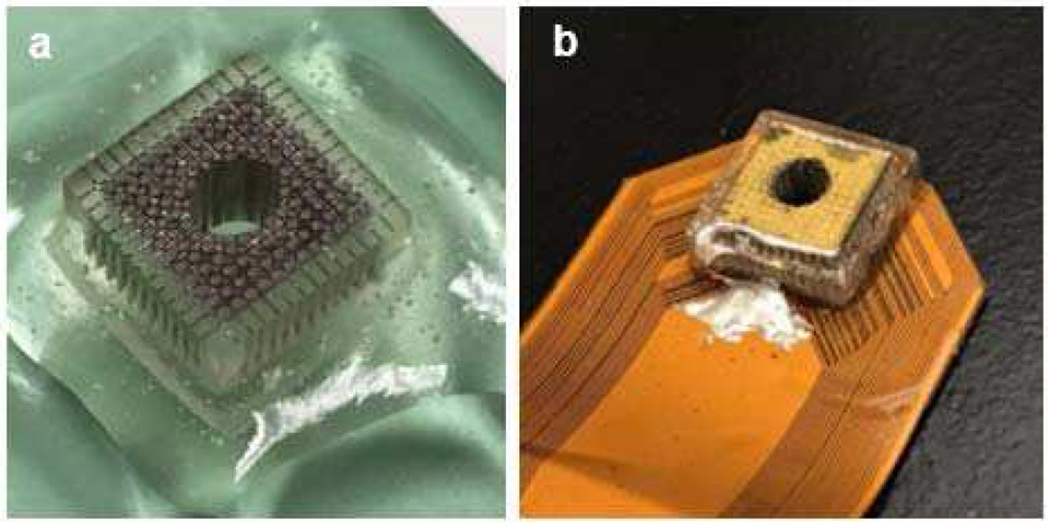
(a) Interposer filled with E-solder; (b) 2D array after assembly.
TABLE I.
2D Array Parameters
| Parameter | Value |
|---|---|
| Piezo Materials | Hard PZT |
| Matching Layer | N/A |
| Backing | Interposer + E-solder |
| Center Frequency | 3.5 MHz |
| −6dB Bandwidth | 37% |
| Pitch | 540 μm |
| Kerf | 40 μm |
| Number of Elements | 108 |
| Total Dimensions | 6.48 mm × 6.48 mm |
| Central Opening Diameter | 3.5 mm |
The fabrication process of the acoustic stack of the 2D array transducer is similar to our previous work [34]. The 1-3 piezo composite used for the 2D array transducer was fabricated first, using hard PZT material (DL-48, DeL Piezo Specialties, LLC, West Palm Beach, FL, USA) and insulating epoxy kerf filler (EPO-TEK 301, Epoxy Technology, Billerica, MA, USA). It had a pillar width of 140 μm and kerf width of 40 μm diced by a high-speed dicing saw (Tcar 864-1, Thermocarbon, Casselberry, FL, USA). The finished 1-3 piezo composite was lapped down to a thickness of 400 μm to achieve the designed center frequency (3.5 MHz) and then diced into a small section consisting of 36 × 36 pillars with a total dimension of 6.48 mm × 6.48 mm. Both top and bottom sides of the lapped 1-3 piezo composite sample were then mechanically polished and sputtered with a Cr/Au (50/100 nm) electrode using a sputtering system (NSC-3000 Sputter Coater, Nano-Master, Inc., Austin, TX, USA). An interposer backing was fabricated using the process described in detail in [35]: A 4 mm tall support grid with minimum wall thickness of 108 μm was 3D printed in acrylic (3D Systems, Rock Hill, SC, USA) and then filled with a conducting silver epoxy paste (E-Solder 3022, Von Roll Isola, New Haven, CT, USA). The E-solder forms pillars spaced at the array pitch (540 μm), and electrically isolated by acrylic walls. The 1-3 piezo composite was then bonded to the interposer backing using a thin layer of E-solder. After the assembly had cured, the 1-3 piezo composite was diced along both azimuthal and elevational directions to create 2D array elements consisting of 3 × 3 pillars with a pitch of 540 μm, resulting in a total of 12 × 12 2D array elements. The kerfs were filled with EPO-TEK 301 and allowed to cure. This was followed by sputtering a Cr/Au (50/100 nm) electrode to create the top electrode linking all the elements as the ground connection. As mentioned in the previous section, this array was designed to be a 2D array with a central opening used as an imaging window for the optical OCE beam. To ensure enough field-of-view for OCE imaging, the fabricated 2D array was drilled on a lathe to create the central opening with a diameter of 3.5 mm. The drilling process generated a lot of heat, and therefore, to avoid depolarization of the PZT caused by the influence of heat, the interposer and the PZT were drilled separately before assembly. The finished acoustic stack had 108 active elements in total.
After the fabrication was completed, the acoustic stack was bonded with the FPC using E-solder 3022. The FPC also comprised a connector for interface with a modified Philips/ATL L7-4 cable which was then connected to the ultrasound system (Vantage 128, Verasonics, Inc., Kirkland, WA, USA).
B. Array Performance Testing
Array performance was evaluated with pulse-echo (P/E) testing and hydrophone measurement. For P/E testing, a 32 channel ultrasound system (Vantage 32, Verasonics Inc, Kirkland, WA, USA) was used to drive the array. A 3 inch thick quartz cube was used as the target and placed in a deionized (DI) water filled tank at a depth of 15 mm, which was also the focal distance in the following tests and experiments. The array was securely attached to a controlled stage with micrometers to adjust the position in X- and Y- dimensions. One channel was turned on at a time, with each of the 108 2D array elements interrogated in turn. The frequency of the monocycle pulse was 3.5 MHz and the excitation voltage was 7 VPeak. To ensure signal uniformity of the P/E results, array tilt was corrected manually by monitoring the time-of-flight of each element and adjusting the physical orientation of the array.
A hydrophone measurement was carried out to evaluate the emitting field to verify that the customized Verasonics system control script was able to effectively steer the beam and translate the focal point. For the hydrophone measurement, a Vantage 128 ultrasound system was used to drive the array. A hydrophone (HGL-0085, ONDA Corp., Sunnyvale, CA, USA) was securely attached to a 3-D stepper motor (SGSP33-200, OptoSigma Corporation, Santa Ana, CA, USA), which was controlled by the PC to perform a full scan of a 2 cm by 2 cm plane parallel to the array. A function generator (AFG 3252 C, Tektronix, Beaverton, OR, USA) was used to synchronize the Verasonics system with the digitizer card in the PC. The drive frequency was 3.5 MHz, with two full cycles, and an output voltage of 10 VPeak. A small number of cycles and a low voltage was applied to the array to avoid generating a large acoustic signal that would damage the hydrophone.
C. Experimental Setup
A customized 20 kHz SD-OCT system with a central wavelength of 890 nm and bandwidth of 144 nm [28, 29, 36] and the Verasonics control system were synchronized using an Analog Discovery 2 instrument (DIGILENT Inc, Pullman, WA, USA) as illustrated in Fig. 2. More specifically, the SD-OCT system sent out one trigger signal through the Analog Discovery 2 instrument to the Verasonics system for each lateral scanning location. At that location, a total of 400 A-lines (one M-mode dataset) were acquired at 20 kHz. To establish the baseline or reference signal (i.e., the signal of initial tissue position without the pushing force) for the axial displacement curve calculation, the Verasonics system was excited 100 μs after the SD-OCT system started to acquire data.
Fig. 2.
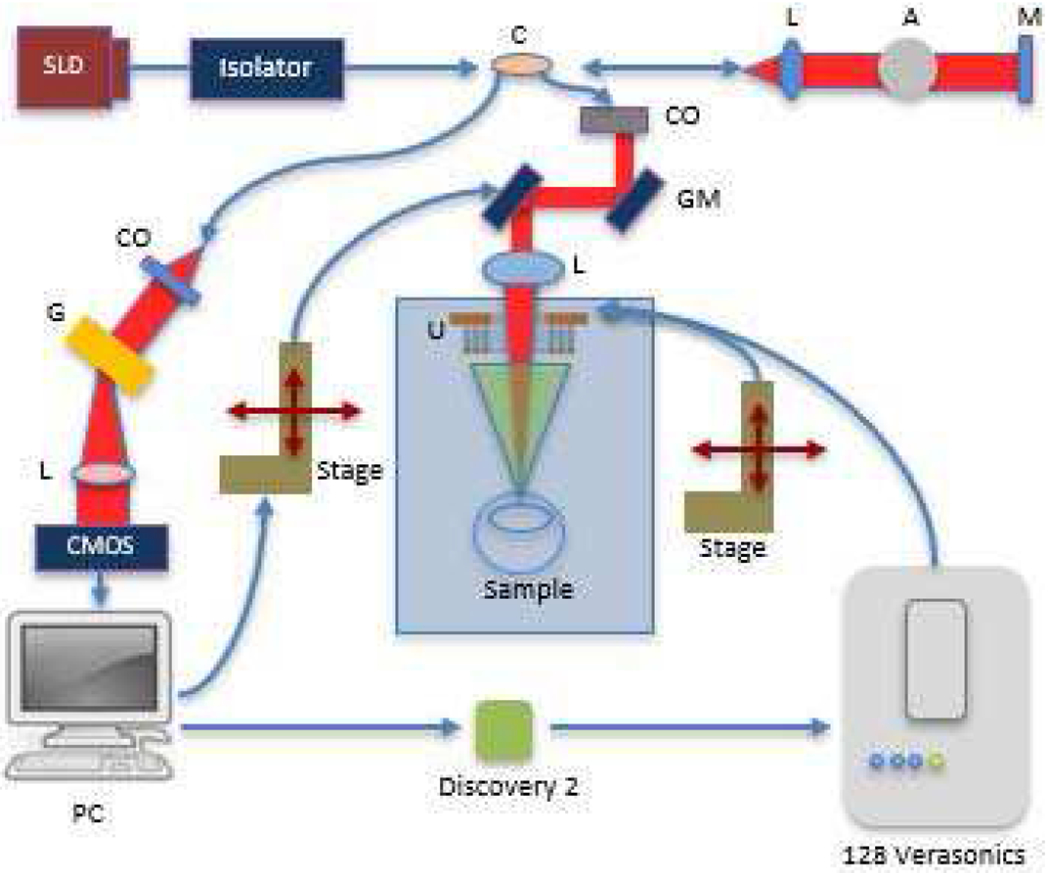
Block diagram of system setup (SLD : superluminescent diode; C: coupler; L: lens; A: attenuator; M: Mirror; CO: collimator; GM: galvo mirror; G: diffraction grating; U: Ultrasonic Array; PC: personal computer; Red beam: light path; Green beam: ARF path).
A 3.5 MHz tone burst sinusoidal wave with 5000 cycles at 40 Vpp was used by the Verasonics system to drive the 2D array per each trigger period. The 2D array was mounted on a precision controller stage in order to manually tilt the 2D array for confocal alignment. Before performing image acquisition, the steering angle and focal distance were electronically adjusted in real-time using a customized Verasonics script, and the tissue displacement results were simultaneously displayed in phase resolved Doppler OCT images to ensure that the two systems were well aligned and that the focal point was located on the target.
D. Image Processing
To obtain the biomechanical properties of the imaged phantom and tissues, group velocities of the generated shear waves were calculated by tracing the location of the wave surface over time. Shear wave intensity was not considered in the velocity calculations [37]. The raw data acquired using the setup represented the displacement that occurred in the scanned area (scanning direction versus axial direction) in the test samples. To calculate the group velocity of the shear wave, the raw data was first averaged to increase the signal to noise ratio, and it was then re-sliced based on a custom algorithm. The processed results represented the displacement along the scanning direction versus time, which indicates the propagation of the shear wave at different depths [37, 38]. More details of the images are presented in the phantom and ex vivo results sections.
E. Phantom and Biological Tissue Preparation
Gelatin (Gelatin G8-500, Fisher Scientific International, Inc., Hampton, NH, USA) based tissue-mimicking phantoms were designed and fabricated in this study. The homogenous phantoms comprised 7.5% gelatin and 0.5 % silicon carbide powder (S5631, Sigma-Aldrich, St. Louis, MO, USA) as sound scatters. The stiffness of the homogeneous phantom was measured using the gold standard of uniaxial mechanical testing (5942, Instron, Norwood, MA, USA). The phantoms were cut into several small bulk units to fit the device, and the average stiffness was 22.05 ± 0.73 kPa.
To image biological tissue, a healthy rabbit excised eyeball was collected from a local slaughterhouse (Sierra Medical Science, Inc., Whittier, CA, USA) within 12 hours of death. A 3% gelatin phantom was molded around the eyeball to keep the eye in place during imaging. Phosphate-buffered saline solution was used to preserve its freshness and as a medium for ultrasound coupling. All experiments were performed at room temperature.
III. Results
A. Array Performance
P/E test results of a representative element along with maps for the entire array are presented in Fig. 3. As shown in Fig. 3(a), the P/E response waveform exhibited a long pulse duration, corresponding to a narrow −6dB fractional bandwidth of 37%. This is also evident in the fast Fourier transform (FFT) of the P/E waveform in Fig. 3(a). The center frequency was calculated to be 3.5 MHz. All 108 elements were tested to measure the uniformity of response from individual elements. The normalized sensitivity and the center frequency test results of the 2D array are mapped in Figs. 3(b) and (c), respectively. As can be seen in Figs. 3(b) and (c), the performance of the array was uniform with a yield of 88% (13 elements have sensitivity lower than 20dB). Loss of element signal was mainly due to disconnections between those array elements and the PCB.
Fig. 3.

(a) P/E response (red solid line) and its FFT spectrum (blue solid line) of a representative array element (red dashed line represents −6dB); (b) sensitivity mapping and (c) center frequency mapping of the entire array elements.
After confirming functionality of each element, the acoustic field emitted by the array was evaluated by hydrophone measurement. Fig. 4 shows the hydrophone measurement results. Five different transmission patterns were tested to verify the ability of the array to generate a steerable beam. The average horizontal diameter of adult cornea ranges from 11.5 to 12 mm, and the vertical diameter is 1 mm smaller [39, 40]. In this case, a 4° steering angle is optimal for testing. At the 15 mm focal depth, the 4° steering angle provides 10 mm displacement of the focal point from the center point in both elevation and azimuth directions, which is enough to cover the entire extent of the cornea. Comparing the locations of the main lobe (red area) in Figs. 4(b)–(e), with its original location in Fig. 4(a), demonstrates that the beam was successfully steered in both the y and x directions. The red area distributed around the main lobe shows the location of the side lobes. The observed sidelobe level was due to the array having a designed 1.2 λ pitch for stronger ARF pulse generation, as well as a central opening to accommodate the optical window. Since the intensity of the side lobes was much lower than the main lobe, the influence is acceptable for this application.
Fig. 4.
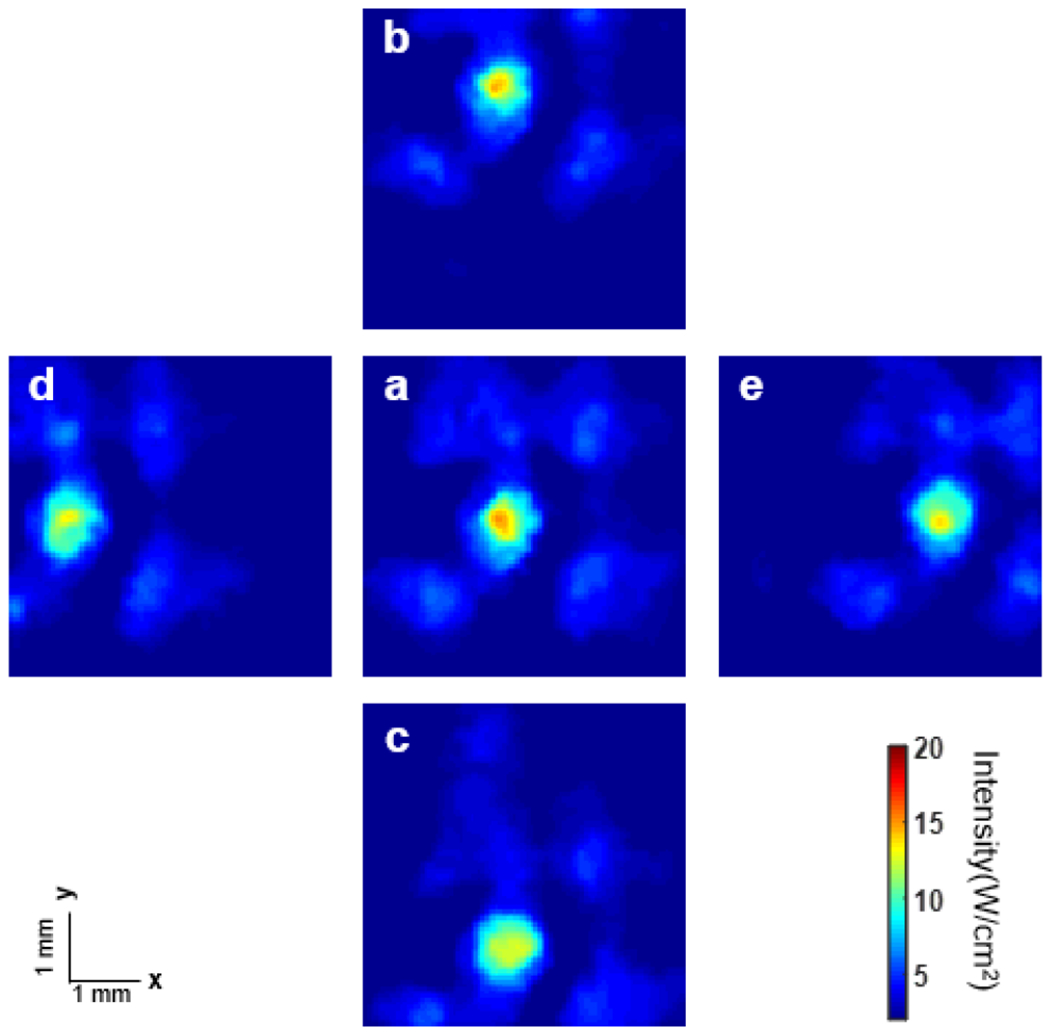
Hydrophone measurement results of the 2D array (focal distance: 15 mm) with different steering parameters: (a) original point; (b) y: 4°, x: 0°; (c) y: −4°, x: 0°; (d) y: 0°, x: −4°; e: y: 0°, x: 4°.
B. Phantom Results
The setup for phantom testing was the same as the setup in Fig. 2, with the imaged sample being replaced by the phantom. Experimentally acquired OCE images and OCT B-scans of the phantom are shown in Fig. 5. The OCT system acquired 500 A-lines with 50 kHz acquisition frequency and 4 μm spacing along the azimuthal direction. The drive signal for the array had a 3.5 MHz center frequency, the output voltage was 35 VPeak, and 8000 cycles were used. The size of the region of interest was mainly determined by the size of the optical window in the acoustic 2D array. Figs. 5(a) and (b) show OCT B-scan images with different steering parameters. The dark area (marked by the vertical white line) is the position where the travelling shear wave was initiated. To generate the OCE images, the displacement of each position at the same depth was rearranged according to its position along the azimuthal direction with time delay. The blue color in the images represents negative displacement. As can be seen by comparison of Figs. 5(c) and (d), the blue area appears at different azimuthal locations with a time delay, which indicates propagation of the mechanical wave at this depth. The peaks in the images are the location where the excitation occurred.
Fig. 5.
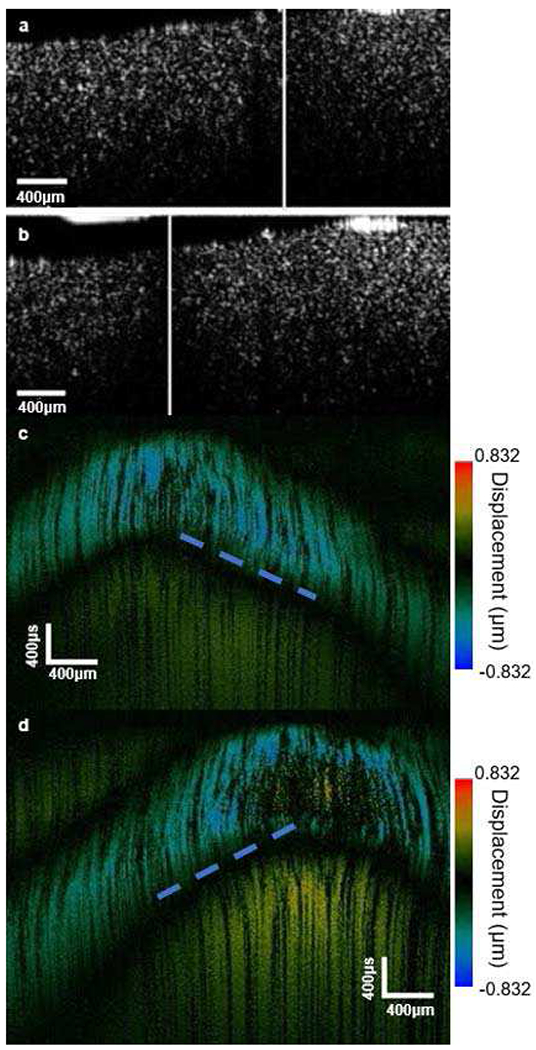
(a) and (b) Phantom OCT B-scan imaging; (c) and (d) phantom OCE imaging [Steering parameters: (a) and (c) original point; (b) and (d) elevation: 0°, azimuth: 0.06 radian].
Comparing the locations of the peaks in Figs. 5(c) and (d) to dark areas (white lines) in Figs. 5(a) and (b), we find that the excitation occurred in a different location when the transmission parameters were changed. This shows that the design functions properly, with the ARF beam being steered to stimulate a specific area. Another very important observation is that in all four images, there is only a single excitation at the focal point. This indicates that the sidelobes which were found in the acoustic hydrophone measurement (Fig. 4) did not influence the phantom images with the OCT system. Dashed blue lines in Figs. 5(c) and (d) indicate the edge of the propagation trail of the mechanical wave (blue area). To calculate the group velocity of the shear wave, dashed lines were drawn along the blue area in Figs. 5(c) and (d). Assume the two ends of a dashed line locate at (x1, y1) and (x2, y2). As mentioned above, the x-direction in the figure represent the azimuthal position and y-direction represents the time delay. Then the absolute value of x1-x2 is the distance that the shear wave propagated within the prescribed time period, which would be given by the absolute value of y1-y2. Therefore, the group velocity of the shear wave is given by the slope of the dashed line. The group velocity was calculated to be 2.66 ± 0.08 m/s. The Young’s modulus of the tissue can be found using the following equation:
| (1) |
where E is the Young’s modulus, ρ is the density of the tissue, and c is the group velocity of the mechanical wave. Using Equation (1), E of the phantom was calculated to be 21.28 ± 1.3 kPa. Comparing with the gold standard uniaxial mechanical test result (described above), the error was less than 10%.
C. Ex Vivo Imaging
After validating the array functionality as described above with the phantom, tissue sample imaging was performed next to examine the performance of the array with real tissue. The system setup was the same as described above for the phantom images with the combined acoustic and OCT system. The drive signal to the array had a 3.5 MHz center frequency, 40 VPeak output voltage, and 2000 cycles. OCE results and the propagation map acquired with the system as described are shown in Fig. 6.
Fig. 6.
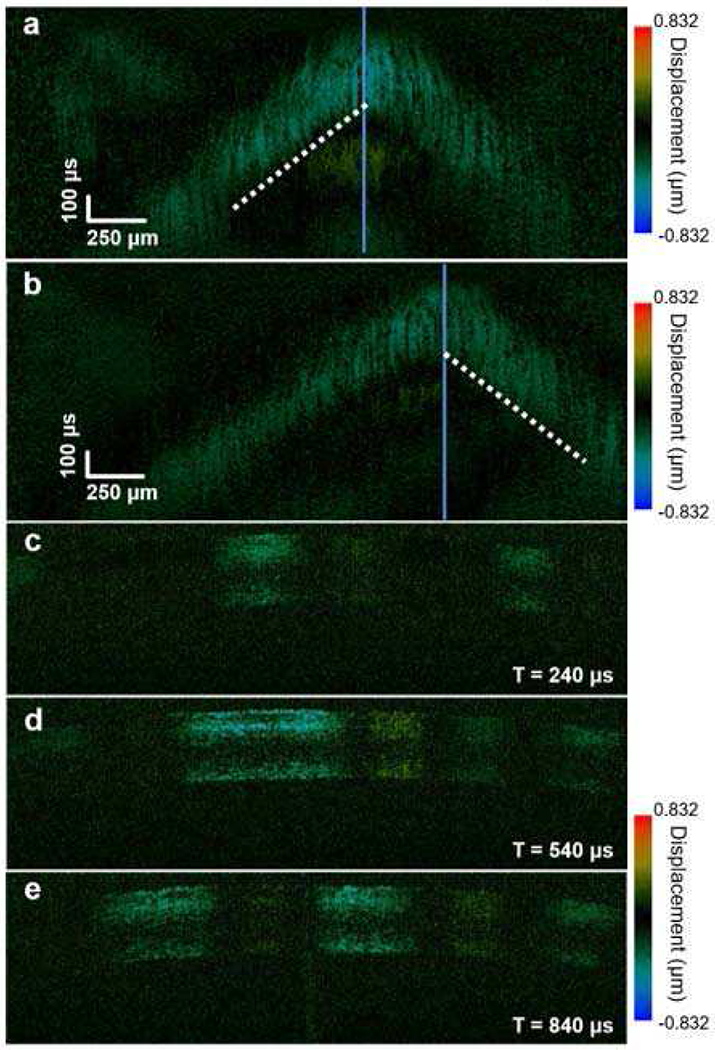
Ex vivo OCE imaging of a rabbit eye: (a) and (b) spatiotemporal displacement map; (c-e) shear wave propagation map.
As with the data analysis performed for the phantom images (Fig. 5), dashed lines in Fig. 6(a) and (b) mark the edge of the propagation trail of the shear wave (blue/green area) and the group velocity was calculated to be 1.38 ± 0.1 m/s. Applying Eq. (1), the Young’s modulus (E) of the rabbit cornea was calculated to be 5.72 ± 0.42 kPa. Note that Eq.(1) assumes a homogeneous bulk material [41]. These results are similar to previously reported measurements of group velocity [42]. Finally, shear wave propagation vs. elapsed time is shown in Figs. 6(c)–(e), where T = 0 is the time point when the initial trigger from the OCT system was first sent to the Verasonics system.
IV. Discussion and Conclusions
In this study, we reported the design, fabrication, and testing of a co-registered 2D ultrasonic array-based OCE system. The presented hydrophone measurement results verified that the proposed 2D array had the ability to transmit a tightly focused and steerable pushing beam in the 2D spatial domain. The performance of the 2D ultrasonic array-based OCE system was first validated using a homogenous phantom, and then tested in ex vivo rabbit eye. To the best of our knowledge, this is the first reported result for a system capable of generating a controllable spatiotemporal pushing force using a fully programmable 2D ultrasonic array.
The ARF-OCE technique has successfully been shown to obtain high resolution OCE images of corneal [29] and retinal [28] tissues through the tracking of shear wave propagation induced by a single-element ultrasonic transducer. However, due to refraction and redirection of the acoustic and laser beam in the optical lens, a fixed acoustic beam makes it difficult to colocalize the acoustic stimulation point and the optical focal point when focused on deeper tissue such as the retina at the back of the eye [43]. This makes it challenging to use the single-element transducer based ARF-OCE approach in practice. In addition, to scan and map the biomechanical properties of the 2D plane with a single-element ultrasonic transducer, a mechanical scanning operation is necessary which leads to a long acquisition time. These issues can be alleviated using an electronically scanned and focused 2D array similar to the one which we fabricated and described above. The hydrophone measurement results prove the ability of the array to generate and steer a highly focused acoustic forcing beam. The application in imaging phantoms and ex vivo tissues with a mechanically co-registered OCT system verifies the ability to stimulate the tissue and generate a shear wave strong enough to be detected.
This study demonstrated the first working prototype of 2D ultrasonic array-based OCE, and highlighted opportunities for further improvement. First, only corneal tissue from rabbit eye was imaged with the current prototype. More disease models need to be tested to further demonstrate the functionality of the system with varying tissue morphology and stiffness. Second, in both the phantom and corneal tissue imaging experiments, all the targets were located at the focal point of the beam. The potential influence of defocusing on the accuracy of the acquired stiffness gradients needs to be investigated in future work. Third, acoustic propagation through the crystalline lens of the eye is one main barrier for ARF-OCE being used to image deeper areas such as the back of the eye and retina. In contrast, the distortion caused by transmission through the sclera is minimal [43], and therefore avoiding the lens will improve the sensitivity of the system. This can be accomplished by increasing the size of the optical window so that there is less overlap between the lens and the acoustic aperture of the array. In addition, a larger optical window will also provide a wider scanning area. Finally, more work needs to be done to solve the problem of the safety of the acoustic excitation. This study is still at an early stage using ex-vivo tissue and ultrasound phantoms as the imaging targets. The peak intensity and the mechanical index (MI) according to the hydrophone measurement results at the focal point were 230.4 W/cm2 and 0.87, respectively. To adhere to the MI limit of 0.23 for human ocular tissue in future applications, lower excitation power will be necessary. However, a lower excitation power will result in reduced sensitivity of the overall system. This problem can be solved by using a wide beam for excitation and increasing the sensitivity of the OCT system.
In summary, a 2D ultrasonic array transducer with a central opening as an optical window can improve ARF-OCE in many aspects, such as acquisition time, setup complexity, imaging pattern, and energy delivery. The developed array prototype demonstrated promising performance in precisely detecting the tissue elasticity via shear wave elastography with 2D ultrasonic array stimulation. In the future, this technique will provide a powerful tool to fully scan the target with high acquisition rate for ARF-OCE in clinical ophthalmology.
Acknowledgments
This work was supported by US National Institutes of Health (NIH) under grant R01EY026091, R01EY028662, R01EY030126 and NIH P30EY029220. Unrestricted departmental grant from research to prevent blindness.
Biographies

Haochen Kang received the B.Eng. degree in electrical engineering from the Huazhong University of Science and Technology, Wuhan, China, in 2015 and the M.S. degree in electrical engineering from the University of Southern California, Los Angeles, CA, USA, in 2017, where he is currently pursuing the Ph.D. degree in biomedical engineering. His research is focused on the design and application of 2-D ultrasound systems.

Xuejun Qian received his B.S. degree in electrical engineering from Xidian University, China, in 2012. He received his M.S. degree in electrical engineering and Ph.D degree in Biomedical Engineering from University of Southern California, Los Angeles, CA, USA in 2014 and 2018. He joined NIH Ultrasonic Transducer Resource Center (UTRC) as a Research Assistant under the supervision of Dr. Qifa Zhou and Dr. K. Kirk Shung. His research interests include high-frequency ultrasound elastography, optical coherence elastography, super-resolution microvessel imaging and multi-modality imaging

Ruimin Chen received his B.S. degree in Biomedical Engineering from University of Electronics Science and Technology of China, Chengdu, China in 2006, and both his M.S. and his Ph.D. degrees in Biomedical Engineering from University of Southern California, Los Angeles, CA, in 2008 and 2014, respectively. He worked as a postdoctoral research associate and resource manager in the NIH Ultrasonic Transducer Resource Center at the Department of Biomedical Engineering of University of Southern California.
His research interests include the design, modeling, and fabrication of high-frequency ultrasonic transducers and arrays for medical imaging applications, piezoelectric material characterization, and photoacoustic imaging.

Robert Wodnicki received the B.Eng. and M. Eng. degrees in Electrical Engineering from McGill University in 1992 and 1996, respectively and the PhD in Biomedical Engineering from the University of Southern California in 2020. From 1995 to 2014, he was employed as an ASIC designer for GE Global Research in Niskayuna, NY. He is currently employed as a Postdoctoral Scholar at the University of Southern California Roski Eye Institute. His research is focused on the implementation of 2D ultrasound systems utilizing highly integrated ASIC electronics interfaced to single-crystal transducer arrays and applications of high frequency ultrasound imaging.

Yizhe Sun is a graduate student pursuing his Ph.D. degree in Biomedical Engineering at the Viterbi School of Engineering at the University of Southern California (USC). He received his B.S. degree in Aircraft Engineering and Design at Nanjing University of Aeronautics and Astronautics in 2017. From Jan-July 2018, he worked as a Research Assistant in Hong Kong University of Science and Technology. He is proficient in Mechanical Engineering and Microelectromechanical Systems (MEMS). Currently, he is a Researcher at the Ultrasound Transducer Research Center working to develop the Ultrasound Array and Single Element Transducers. He plans to continue his work in academia include the design, and fabrication of high-frequency ultrasonic transducers and arrays.

Runze Li received his B.S. degree in Biomedical Engineering from Huazhong University of Science and Technology, Wuhan, China in 2014, and M.S. degree in Biomedical Engineering from University of Southern California, Los Angeles, CA, in 2017. He is currently a Ph.D. student at the Department of Biomedical Engineering of University of Southern California. His research interests include development of high frequency transducer, ultrasonic elastography and optical coherence elastography.

Yan Li received the Ph.D. degrees in Biomedical Engineering from the University of California, Irvine in 2020. She is currently a Postdoctoral Scholar in Beckman Laser Institute. Her research interests include multimodal endoscopic imaging techniques and optical coherence elastography.

K. Kirk Shung (S’73–M’75–SM’89–F’93–LF’11) received the B.S. degree in electrical engineering from Cheng Kung University, Tainan, Taiwan, in 1968, and the Ph.D. degree in electrical engineering from the University of Washington, Seattle, WA, USA, in 1975.
In 2013, he joined the Viterbi School of Engineering, University of Southern California (USC), as a Dean’s Professor of biomedical engineering, an endowed position. Since 1997, he has been the Director of the NIH Resource Center on Medical Ultrasonic Transducer Technology, USC, where he has been a Professor of biomedical engineering, since 2002. He has authored or coauthored over 500 papers and book chapters. His research interest is in ultrasonic transducers, high-frequency ultrasonic imaging, and ultrasound microbeam.
Dr. Shung is a fellow of the American Institute of Ultrasound in Medicine. He is a Founding Fellow of the American Institute of Medical and Biological Engineering. He was a recipient of the IEEE Engineering in Medicine and Biology Society Early Career Award in 1985. He coauthored the paper that received the Best Paper Award for the IEEE Transactions on Ultrasonics, Ferroelectrics, and Frequency Control (TUFFC) in 2000. He received the Holmes Pioneer Award in Basic Science from the American Institute of Ultrasound in Medicine in 2010, the Academic Career Achievement Award from the IEEE Engineering in Medicine and Biology Society in 2011, and the IEEE Biomedical Engineering Award in 2016. He was elected an Outstanding Alumnus of Cheng-Kung University, Taiwan, in 2001. He was selected as the Distinguished Lecturer of the IEEE UFFC Society from 2002 to 2003. He is an Associate Editor of the IEEE TUFFC and IEEE Transactions on Biomedical Engineering and Medical Physics.

Zhongping Chen received the B.S. degree in applied physics from Shanghai Jiao Tong University, Shanghai, China, in 1982, the M.S. degree in electrical engineering from Cornell University, NY, USA, in 1987, and the Ph.D. degree in applied physics from Cornell University in 1993. He is currently a Professor of biomedical engineering and the Director of F-OCT Laboratory at the University of California, Irvine, CA, USA. He is a cofounder and the Board Chairman of OCT Medical Imaging, Inc. His research interests encompass the areas of biomedical photonics, microfabrication, biomaterials, and biosensors. His research group has pioneered the development of functional optical coherence tomography, which simultaneously provides high-resolution 3-D images of tissue structure, blood flow, and birefringence. He has published more than 220 peer-reviewed papers and review articles and holds a number of patents in the fields of biomaterials, biosensors, and biomedical imaging. Dr. Chen is a Fellow of the American Institute of Medical and Biological Engineering (AIMBE), a Fellow of SPIE, and a Fellow of the Optical Society of America.

Qifa Zhou received his Ph.D. degree from the Department of Electronic Materials and Engineering at Xi’an Jiaotong University, China in 1993. He is currently a professor of Biomedical Engineering and Ophthalmology at the University of Southern California.
Dr. Zhou is a fellow of the Institute of Electrical and Electronics Engineers (IEEE), the International Society for Optics and Photonics (SPIE), and the American Institute for Medical and Biological Engineering (AIMBE). He is also a member of the Technical Program Committee of the IEEE International Ultrasonics Symposium, and is an Associate Editor of the IEEE Transactions on Ultrasonics, Ferroelectrics, and Frequency Control. His research focuses on the development of piezoelectric high-frequency ultrasonic transducers/array for biomedical ultrasound and photoacoustic imaging, including intravascular imaging, elastography and ophthalmic imaging. He is also actively exploring ultrasonic mediated therapeutic technology including trans-sclera drug delivery, as well as ultrasound for retinal and brain stimulation. He has published more than 280 peer-reviewed articles in journals and edited two books.
Contributor Information
Haochen Kang, Department of Biomedical Engineering and USC Roski Eye institute, University of Southern California, Los Angeles CA 90089, USA.
Xuejun Qian, Department of Biomedical Engineering and USC Roski Eye institute, University of Southern California, Los Angeles CA 90089, USA.
Ruimin Chen, Department of Biomedical Engineering, Viterbi School of Engineering, University of Southern California, Los Angeles, CA 90089 USA, and also with the USC Roski Eye Institute, Keck School of Medicine, University of Southern California, Los Angeles, CA 90089 USA. He is now with Masimo Corporation, Irvine, CA 92618 USA.
Robert Wodnicki, Department of Biomedical Engineering and USC Roski Eye institute, University of Southern California, Los Angeles CA 90089, USA.
Yizhe Sun, Department of Biomedical Engineering and USC Roski Eye institute, University of Southern California, Los Angeles CA 90089, USA.
Runze Li, Department of Biomedical Engineering and USC Roski Eye institute, University of Southern California, Los Angeles CA 90089, USA.
Yan Li, Department of Biomedical Engineering and the Beckman Laser Institute, University of California, Irvine, CA 92697 USA.
K. Kirk Shung, Department of Biomedical Engineering, University of Southern California. Los Angeles CA 90089, USA.
Zhongping Chen, Department of Biomedical Engineering and the Beckman Laser Institute, University of California, Irvine, CA 92697 USA.
Qifa Zhou, Department of Biomedical Engineering and USC Roski Eye institute, University of Southern California, Los Angeles CA 90089, USA.
References
- [1].Kirby MA, Pelivanov I, Song S et al. “Optical coherence elastography in ophthalmology,” Journal of biomedical optics, vol. 22, no. 12, pp. 121720, 2017. [DOI] [PMC free article] [PubMed] [Google Scholar]
- [2].Qian X, Ma T, Shih C-C et al. , “Ultrasonic microelastography to assess biomechanical properties of the cornea,” IEEE Transactions on Biomedical Engineering, vol. 66, no. 3, pp. 647–655, 2018. [DOI] [PMC free article] [PubMed] [Google Scholar]
- [3].Dascalescu D, Corbu C, Constantin M et al. , “Correlations between Corneal Biomechanics and Glaucoma Severity in Patients with Primary Open Angle Glaucoma,” Maedica, vol. 10, no. 4, pp. 331, 2015. [PMC free article] [PubMed] [Google Scholar]
- [4].Pillunat KR, Hermann C, Spoerl E et al. , “Analyzing biomechanical parameters of the cornea with glaucoma severity in open-angle glaucoma,” Graefe’s Archive for Clinical and Experimental Ophthalmology, vol. 254, no. 7, pp. 1345–1351, 2016. [DOI] [PubMed] [Google Scholar]
- [5].Costin BR, Fleming GP, Weber PA et al. , “Corneal biomechanical properties affect Goldmann applanation tonometry in primary open-angle glaucoma,” Journal of glaucoma, vol. 23, no. 2, pp. 69–74, 2014. [DOI] [PubMed] [Google Scholar]
- [6].Flaxman SR, Bourne RR, Resnikoff S et al. , “Global causes of blindness and distance vision impairment 1990–2020: a systematic review and meta-analysis,” The Lancet Global Health, vol. 5, no. 12, pp. e1221–e1234, 2017. [DOI] [PubMed] [Google Scholar]
- [7].Jaycock PD, Lobo L, Ibrahim J et al. , “Interferometric technique to measure biomechanical changes in the cornea induced by refractive surgery,” Journal of cataract & refractive surgery, vol. 31, no. 1, pp. 175–184, 2005. [DOI] [PubMed] [Google Scholar]
- [8].Binder PS, Lindstrom RL, Stulting RD et al. , “Keratoconus and corneal ectasia after LASIK,” Journal of refractive surgery, vol. 21, no. 6, pp. 749–752, 2005. [DOI] [PubMed] [Google Scholar]
- [9].Seiler T, Koufala K, and Richter G, “Iatrogenic keratectasia after laser in situ keratomileusis,” Journal of refractive surgery, vol. 14, no. 3, pp. 312–317, 1998. [DOI] [PubMed] [Google Scholar]
- [10].Haw WW, and Manche EE, “Iatrogenic keratectasia after a deep primary keratotomy during laser in situ keratomileusis,” American journal of ophthalmology, vol. 132, no. 6, pp. 920–921, 2001. [DOI] [PubMed] [Google Scholar]
- [11].Bussel II, Wollstein G, and Schuman JS, “OCT for glaucoma diagnosis, screening and detection of glaucoma progression,” British Journal of Ophthalmology, vol. 98, no. Suppl 2, pp. ii15–ii19, 2014. [DOI] [PMC free article] [PubMed] [Google Scholar]
- [12].Gatzioufas Z, and Seitz B, “Determination of corneal biomechanical properties in vivo: a review,” Materials Science and Technology, vol. 31, no. 2, pp. 188–196, 2015. [Google Scholar]
- [13].Singh M, Li J, Vantipalli S et al. , “Noncontact elastic wave imaging optical coherence elastography for evaluating changes in corneal elasticity due to crosslinking,” IEEE Journal of Selected Topics in Quantum Electronics, vol. 22, no. 3, pp. 266–276, 2015. [DOI] [PMC free article] [PubMed] [Google Scholar]
- [14].Luce DA, “Determining in vivo biomechanical properties of the cornea with an ocular response analyzer,” Journal of Cataract & Refractive Surgery, vol. 31, no. 1, pp. 156–162, 2005. [DOI] [PubMed] [Google Scholar]
- [15].Valbon BF, Ambrósio R, Fontes BM et al. , “Ocular biomechanical metrics by CorVis ST in healthy Brazilian patients,” Journal of refractive surgery, vol. 30, no. 7, pp. 468–473, 2014. [DOI] [PubMed] [Google Scholar]
- [16].Ophir J, Cespedes I, Ponnekanti H et al. , “Elastography: a quantitative method for imaging the elasticity of biological tissues,” Ultrasonic imaging, vol. 13, no. 2, pp. 111–134, 1991. [DOI] [PubMed] [Google Scholar]
- [17].McKnight AL, Kugel JL, Rossman PJ et al. , “MR elastography of breast cancer: preliminary results,” American journal of roentgenology, vol. 178, no. 6, pp. 1411–1417, 2002. [DOI] [PubMed] [Google Scholar]
- [18].Cochlin DL, Ganatra R, and Griffiths D, “Elastography in the detection of prostatic cancer,” Clinical radiology, vol. 57, no. 11, pp. 1014–1020, 2002. [DOI] [PubMed] [Google Scholar]
- [19].Yoneda M, Suzuki K, Kato S et al. , “Nonalcoholic fatty liver disease: US-based acoustic radiation force impulse elastography,” Radiology, vol. 256, no. 2, pp. 640–647, 2010. [DOI] [PubMed] [Google Scholar]
- [20].Qian X, Ma T, Yu M et al. , “Multi-functional ultrasonic micro elastography imaging system,” Scientific reports, vol. 7, no. 1, pp. 1–11, 2017. [DOI] [PMC free article] [PubMed] [Google Scholar]
- [21].Shih C-C, Qian X, Ma T et al. , “Quantitative assessment of thin-layer tissue viscoelastic properties using ultrasonic micro-elastography with Lamb wave model,” IEEE transactions on medical imaging, vol. 37, no. 8, pp. 1887–1898, 2018. [DOI] [PubMed] [Google Scholar]
- [22].Lerner RM, Parker KJ, Holen J et al. , “Sono-elasticity: Medical elasticity images derived from ultrasound signals in mechanically vibrated targets,” Acoustical imaging, pp. 317–327: Springer, 1988. [Google Scholar]
- [23].Ophir J, Alam SK, Garra BS et al. , “Elastography: imaging the elastic properties of soft tissues with ultrasound,” Journal of medical ultrasonics, vol. 29, no. 4, pp. 155, 2002. [DOI] [PubMed] [Google Scholar]
- [24].Mariappan YK, Glaser KJ, and Ehman RL, “Magnetic resonance elastography: a review,” Clinical anatomy, vol. 23, no. 5, pp. 497–511, 2010. [DOI] [PMC free article] [PubMed] [Google Scholar]
- [25].Muthupillai R, Lomas D, Rossman etal P., “Magnetic resonance elastography by direct visualization of propagating acoustic strain waves,” science, vol. 269, no. 5232, pp. 1854–1857, 1995. [DOI] [PubMed] [Google Scholar]
- [26].Li C, Guan G, Huang Z et al. , “Noncontact all-optical measurement of corneal elasticity,” Optics letters, vol. 37, no. 10, pp. 1625–1627, 2012. [DOI] [PubMed] [Google Scholar]
- [27].Li J, Wang S, Singh M et al. , “Air-puff OCE for assessment of mouse cornea in vivo.” p. 893004, 2014. [Google Scholar]
- [28].Qu Y, He Y, Zhang Y et al. , “Quantified elasticity mapping of retinal layers using synchronized acoustic radiation force optical coherence elastography,” Biomedical optics express, vol. 9, no. 9, pp. 4054–4063, 2018. [DOI] [PMC free article] [PubMed] [Google Scholar]
- [29].Qu Y, Ma T, He Y et al. , “Acoustic radiation force optical coherence elastography of corneal tissue,” IEEE Journal of Selected Topics in Quantum Electronics, vol. 22, no. 3, pp. 288–294, 2016. [DOI] [PMC free article] [PubMed] [Google Scholar]
- [30].Du Z, Li R, Qian X et al. , “Quantitative confocal optical coherence elastography for evaluating biomechanics of optic nerve head using Lamb wave model,” Neurophotonics, vol. 6, no. 4, pp. 041112, 2019. [DOI] [PMC free article] [PubMed] [Google Scholar]
- [31].Song S, Le NM, Wang RK et al. , “Quantitative shear wave optical coherence elastography (SW-OCE) with acoustic radiation force impulses (ARFI) induced by phase array transducer.” p. 93270U. [Google Scholar]
- [32].Ambroziński Ł, Pelivanov I, Song S et al. , “Air-coupled acoustic radiation force for non-contact generation of broadband mechanical waves in soft media,” Applied physics letters, vol. 109, no. 4, pp. 043701, 2016. [DOI] [PMC free article] [PubMed] [Google Scholar]
- [33].Ambroziński Ł, Song S, Yoon SJ et al. , “Acoustic micro-tapping for non-contact 4D imaging of tissue elasticity,” Scientific reports, vol. 6, pp. 38967, 2016. [DOI] [PMC free article] [PubMed] [Google Scholar]
- [34].Wodnicki R, Kang H, Adhikari J et al. , “Modular Fabrication and Assembly of Large 2D Arrays with Interface Asics, Pin-Pmn-Pt Composite, and 3D Printed Backing.” pp. 1–4. [Google Scholar]
- [35].Wodnicki R, Kang H, Zhang R et al. , “PIN-PMN-PT single crystal composite and 3D printed interposer backing for ASIC integration of large aperture 2D array.” pp. 1–4. [Google Scholar]
- [36].Qi W, Chen R, Chou L et al. , “Phase-resolved acoustic radiation force optical coherence elastography,” Journal of biomedical optics, vol. 17, no. 11, pp. 110505, 2012. [DOI] [PMC free article] [PubMed] [Google Scholar]
- [37].He Y, Qu Y, Zhu J et al. , “Confocal shear wave acoustic radiation force optical coherence elastography for imaging and quantification of the in vivo posterior eye,” IEEE Journal of Selected Topics in Quantum Electronics, vol. 25, no. 1, pp. 1–7, 2018. [DOI] [PMC free article] [PubMed] [Google Scholar]
- [38].Huang S, Piao Z, Zhu J et al. , “In vivo microvascular network imaging of the human retina combined with an automatic three-dimensional segmentation method,” Journal of biomedical optics, vol. 20, no. 7, pp. 076003, 2015. [DOI] [PMC free article] [PubMed] [Google Scholar]
- [39].Rüfer F, Schröder A, and Erb C, “White-to-white corneal diameter: normal values in healthy humans obtained with the Orbscan II topography system,” Cornea, vol. 24, no. 3, pp. 259–261, 2005. [DOI] [PubMed] [Google Scholar]
- [40].DelMonte DW, and Kim T, “Anatomy and physiology of the cornea,” Journal of Cataract & Refractive Surgery, vol. 37, no. 3, pp. 588–598, 2011. [DOI] [PubMed] [Google Scholar]
- [41].Pelivanov I, Gao L, Pitre J et al. , “Does group velocity always reflect elastic modulus in shear wave elastography?,” Journal of biomedical optics, vol. 24, no. 7, pp. 076003, 2019. [DOI] [PMC free article] [PubMed] [Google Scholar]
- [42].Twa MD, Li J, Vantipalli S et al. , “Spatial characterization of corneal biomechanical properties with optical coherence elastography after UV cross-linking,” Biomedical optics express, vol. 5, no. 5, pp. 1419–1427, 2014. [DOI] [PMC free article] [PubMed] [Google Scholar]
- [43].Lizzi FL, and Coleman DJ, “History of ophthalmic ultrasound,” Journal of ultrasound in medicine, vol. 23, no. 10, pp. 1255–1266, 2004. [DOI] [PubMed] [Google Scholar]


