
Figure 2.
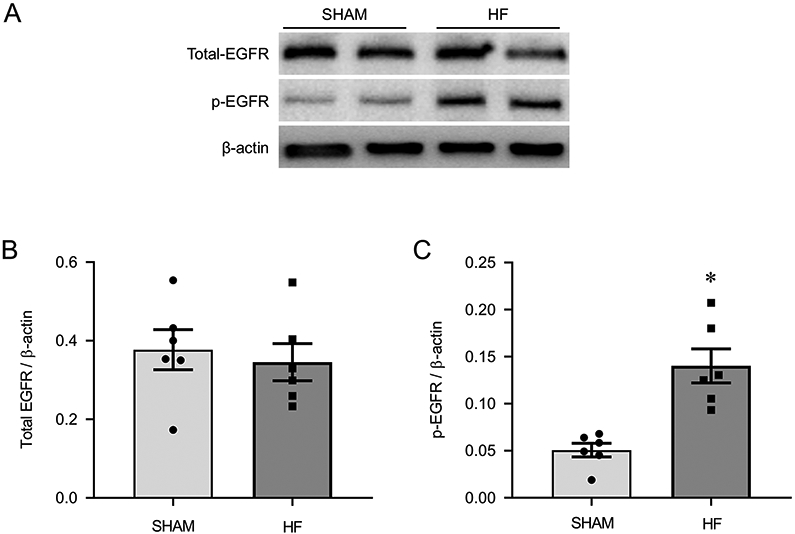
Representative Western blots (A) and protein levels of total EGFR (B) and phosphorylated (p-) EGFR (C) in the PVN of heart failure (HF) rats 4 weeks after coronary artery ligation and age-matched sham-operated (Sham) control rats. Values are mean ± SEM (n = 6 for each group). *p<0.05, vs Sham.