

In the absence of evidence-based laboratory guidelines, the workup and interpretation of tracheal aspirate (TA) cultures remains controversial and confusing within the fields of clinical microbiology, infectious diseases, and critical care. Between 22 January and 24 February 2020, we conducted a national, web-based survey of microbiology laboratory personnel in free-standing pediatric hospitals and adult hospitals containing pediatric facilities regarding the laboratory practices used for TA specimens.
KEYWORDS: clinical microbiology, bacteriology, clinical laboratory, critical care, pneumonia, respiratory pathogens, stewardship, tracheal aspirate
ABSTRACT
In the absence of evidence-based laboratory guidelines, the workup and interpretation of tracheal aspirate (TA) cultures remains controversial and confusing within the fields of clinical microbiology, infectious diseases, and critical care. Between 22 January and 24 February 2020, we conducted a national, web-based survey of microbiology laboratory personnel in free-standing pediatric hospitals and adult hospitals containing pediatric facilities regarding the laboratory practices used for TA specimens. We hypothesized there would be substantial center-level variability in laboratory processing of TA cultures. The response rate for the survey was 48% (73/153). There was a high level of variability in the criteria used for all processes, including specimen receipt, Gram staining, and culture reporting. Most respondents (77%) reported they do not reject TA specimens based on Gram stain criteria, and 44% of labs do not require that a minimum number of Gram stain fields be reviewed prior to reporting results. Overall, nonacademic hospital laboratories and pediatric-only laboratories are more likely to identify, report, and perform susceptibility testing on organisms from TA cultures, regardless of organism quantity or predominance. There is a substantial amount of process variability among pediatric microbiology laboratories that affects TA culture reporting, and which guides treatment decisions. This variation within and among labs makes clinical outcome studies related to TA cultures difficult to interpret. This study serves as a pragmatic step in informing the development of robust clinical guidelines. Clinical outcome and implementation studies are necessary to determine the effectiveness of guidelines for TA cultures.
INTRODUCTION
Clinically, tracheal aspirates (TAs) are obtained from patients to evaluate for ventilator-associated pneumonia (VAP), tracheitis, or etiology of fever (1), but these cultures have a low diagnostic specificity for VAP and are greatly limited by contamination with normal respiratory flora (2), and thus may or may not represent pathogenicity. Bacterial colonization of the trachea precedes VAP, but only a fraction of patients who are colonized with potential VAP pathogens will develop pneumonia caused by a pathogen identified in culture (2). Moreover, tracheitis in ventilated patients is a commonly treated entity, though no standard criteria for diagnosis exist (3). Regardless of specimen quality, the culture results from TA specimens drive antimicrobial use, particularly in ICUs where studies demonstrate the initiation of a new antimicrobial agent based on TA culture results in patients who do not meet clinical VAP criteria, and where antimicrobial use for pneumonia was inappropriate (4, 5).
There is no gold standard for TA culture workup in the laboratory, and no consensus in the literature as to how reporting results of these cultures to clinicians should occur. The College of American Pathologists (CAP) requires that laboratories use Gram stain results to determine specimen acceptability for sputum samples (6), but no such requirements exist for TA specimens. Opportunity for variability exists at many stages in the collection and processing of TA specimens (see Table S1 in the supplemental material). To understand variation in TA culture laboratory practices and testing, we conducted a national survey of U.S. pediatric microbiology laboratories. The survey focused on four major laboratory components, including (i) specimen receipt and processing, (ii) Gram staining, (iii) the culture process, and (iv) organism identification and susceptibility testing. We hypothesized that there is large variability in all culture-related laboratory practices in pediatric microbiology laboratories in the United States. Results from this survey should elucidate practice variability and provide context to existing and future VAP or tracheitis research, while also identifying lab processes that might be the most amenable to change or standardization.
MATERIALS AND METHODS
Study population.
The target population included laboratories at acute care hospitals within the United States. Our initial source to build a sampling frame was 203 hospitals listed in the Children’s Hospital Association database, which includes free-standing pediatric hospitals as well as adult hospitals that have units and wards dedicated to the treatment of children. The primary investigator (A.P.) obtained information for the hospitals and laboratories from their respective hospital websites. A total of 50 laboratories were excluded from the study population because they either stated upon first email contact that they did not perform TA cultures, were not a part of a hospital with acute care services, contact information for the laboratory could not be found, or the laboratory was considered a reference laboratory based on processing and culturing specimens from organizations or health systems outside its own. From August to December 2019, all remaining 153 laboratories were contacted via email announcing the upcoming survey, explaining the purpose of the survey, and asking about the most appropriate person to answer questions regarding laboratory procedures. Only one survey was sent to each institution, and if the primary contact felt it was necessary to include other members of the lab, we asked that only one survey be completed. If email contact information for a laboratory could not be determined, the laboratory was contacted by phone to obtain email address information. These correspondences were used to create a final email contact list for all survey subjects (Fig. 1).
FIG 1.
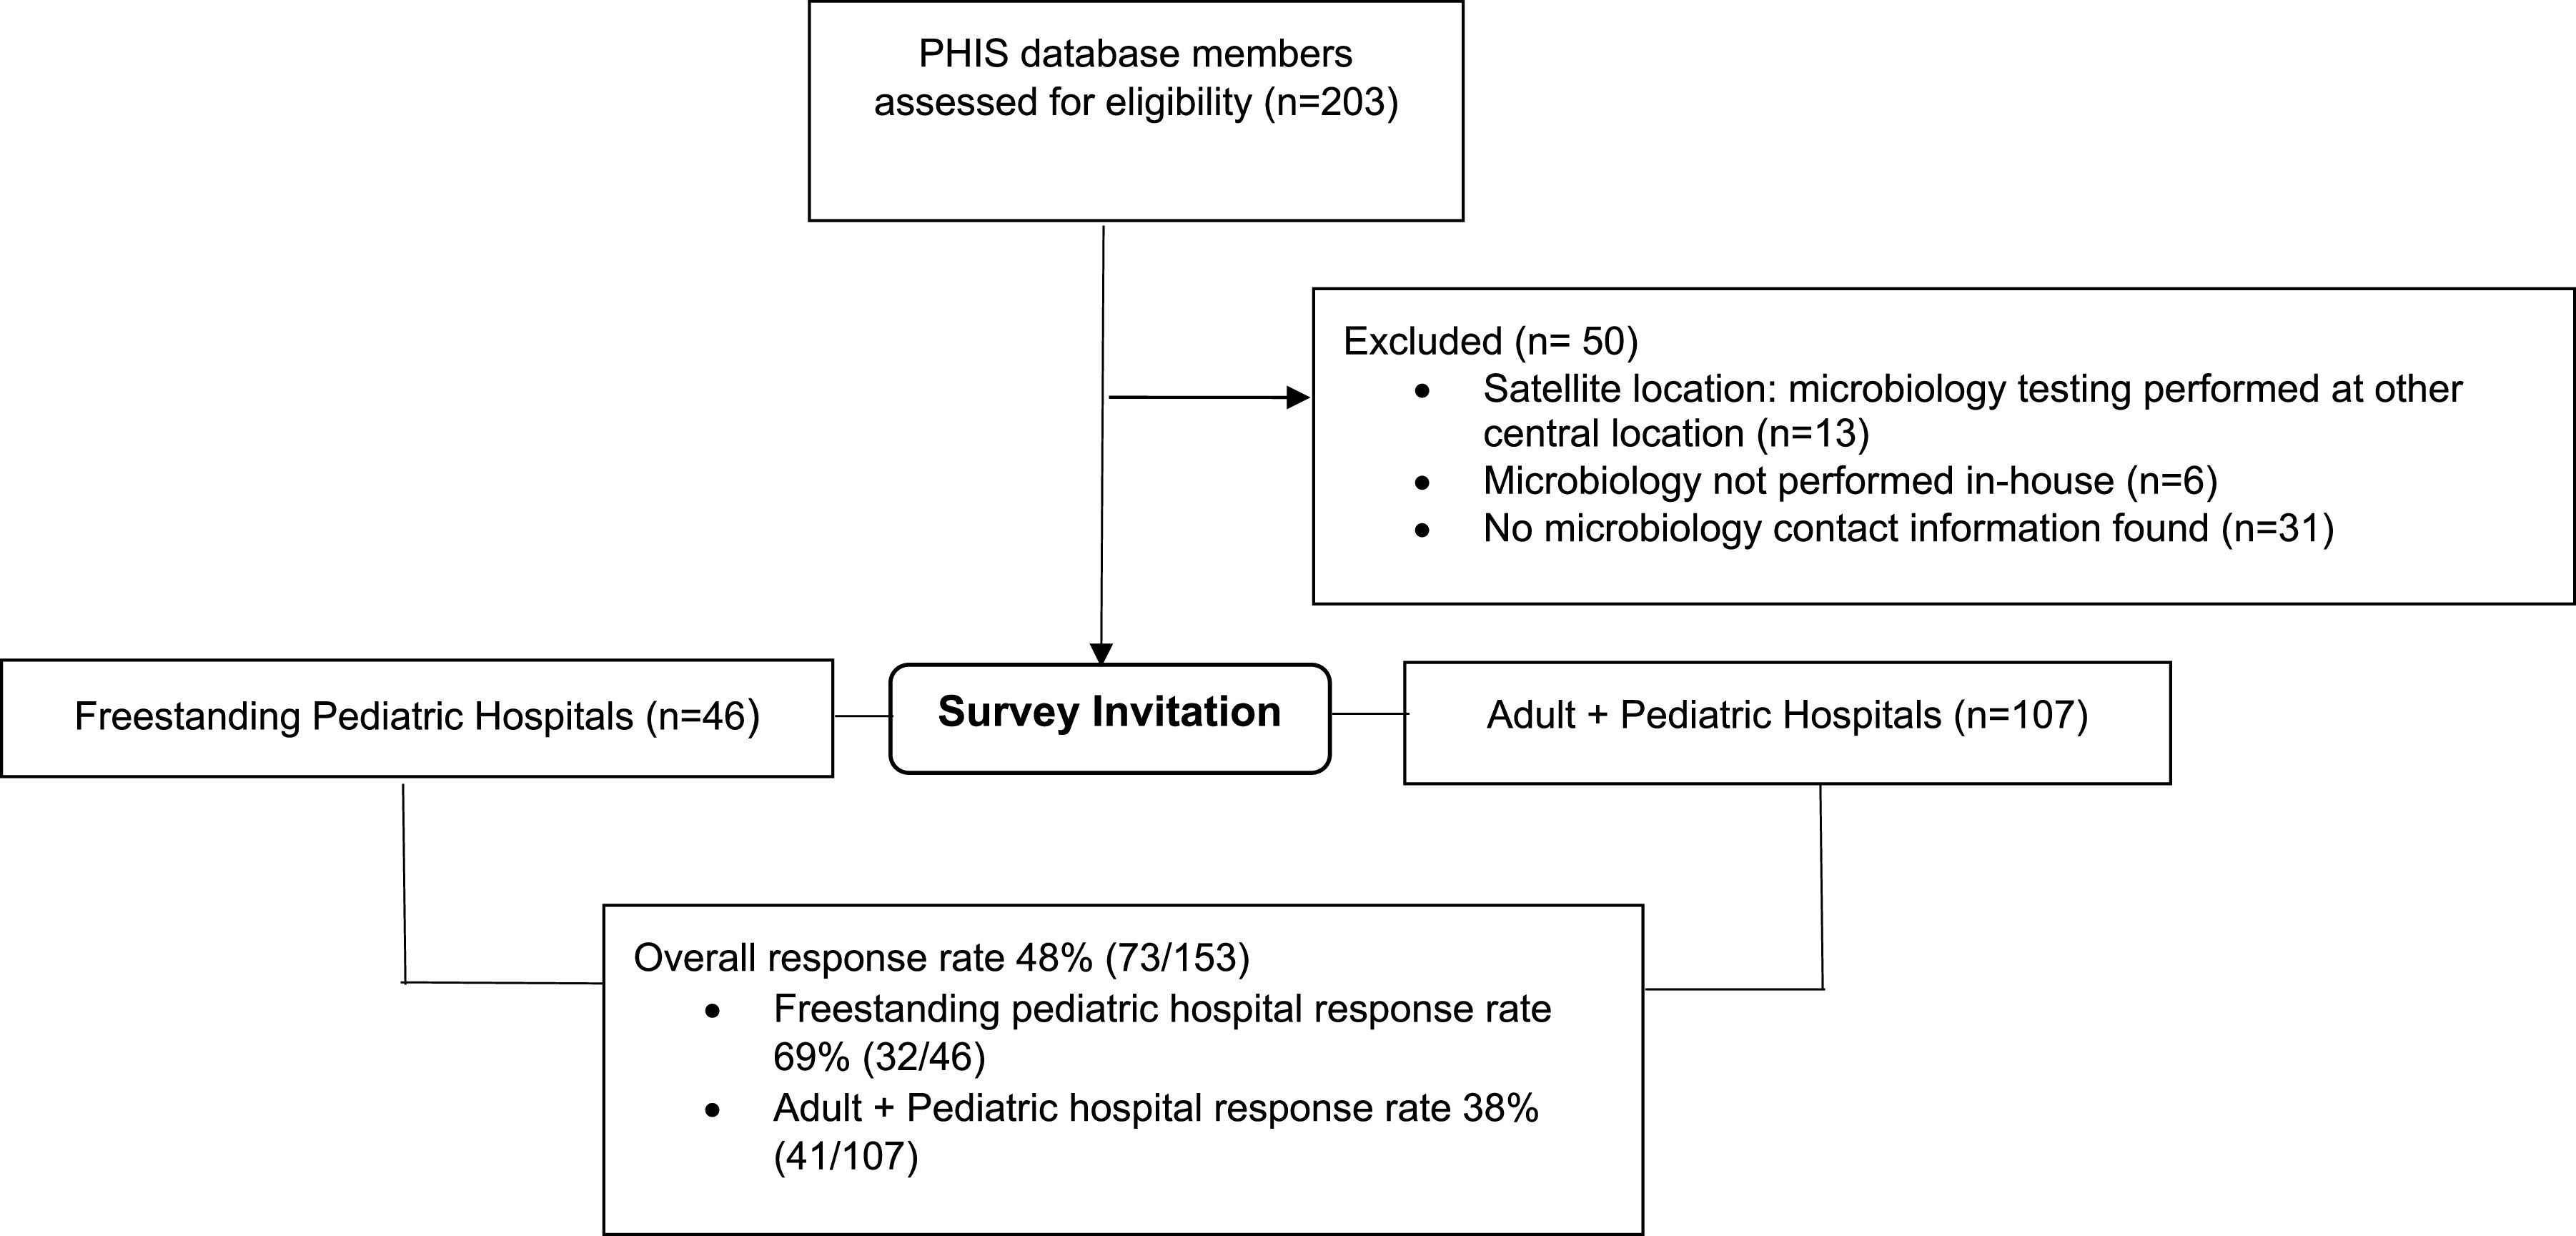
Sample creation and survey administration process.
Survey design.
The survey instrument was designed (7, 8) using a combination of extensive literature review, a formal process of survey development, and expert opinion. Four cognitive interviews were conducted prior to survey distribution, and adjustments were made to the survey based on feedback from the interviews. This study was reviewed by the Colorado Multiple Institution Review Board (COMIRB) and was given exempt status.
Survey domains.
The survey questions were divided into 3 domains based on the following laboratory process components: (i) specimen collection and receipt, (ii) Gram staining, and (iii) specimen culture (culture process, organism identification, and susceptibility testing). For specimen collection and receipt, participants were asked about specimen rejection criteria based on delay of transport and container type, as well as knowledge of specimen dilution upon receipt. In the Gram staining and plating domain, participants were asked about slide preparation, microscopic techniques (use of objectives for cell and organism quantitation, minimum field review requirements), Gram stain rejection criteria and reporting, including the use of the Q score system that assigns values to different types of cells seen in a Gram stain and evaluates specimen quality (9), and specimen plating. The specimen culture domain contained questions about the identification and susceptibility processes for major respiratory pathogens (Streptococcus pyogenes, Streptococcus pneumoniae, Staphylococcus aureus, Pseudomonas aeruginosa, enteric Gram-negative rods, nonfermenting Gram-negative rods, Haemophilus influenzae, fungus, and yeast). Participants were asked to choose the process most closely resembling their own for the identification, reporting and susceptibility testing of each organism: (a) always, regardless of quantity in culture, predominance or Gram stain results; (b) performed if the organism is growing in pure culture, predominant in culture, or seen in significant amounts in the Gram stain; or (c) other.
Data collection.
The survey was conducted between 22 January and 24 February 2020. Participants were sent an email containing instructions and a link to the survey, which was administered through the REDCap system (10). Participants were sent a reminder once per week, on alternating days each week to account for different schedule availabilities among subjects. A total of five reminders were sent during the survey period. Survey participants were asked to submit only one survey response for their institution. Respondents were not compensated.
Statistical analysis.
SAS 9.4 was used to perform the analyses for this study. Descriptive analyses were performed to obtain frequencies and percentages. Demographic covariates were tested against outcomes of interest to assess for confounding. Bivariate analyses were performed using Fisher’s exact test, and logistic regression was performed to further explore the relationships between outcomes of interest and academic status, as well as laboratory type. For ease of graphic display, we dichotomized all identification and susceptibility testing variables into “always” versus all other response categories. The dichotomization of the variables did not change the significance of the bivariate relationship except for four variables where the dichotomization led to a P value of >0.05. All P values shown are based on the analyses using the dichotomized variables (Fig. 2).
FIG 2.

Comparison of hospital laboratory culture workup processes; *, indicates significant relationship at P < 0.05.
Nonresponse bias assessment.
We knew if the laboratory of each of our potential survey respondents belonged to an institution that was Magnet certified or whether it was affiliated with a larger health system, and we were therefore able to assess if nonresponse bias related to these variables was likely to be present in our survey statistics of interest. Multivariable logistic regression was performed to determine the relationship between hospital Magnet status and survey participation. Additionally, the relationship between hospital Magnet status and key variables in the data set was determined. Using the normalized inverse predicted probabilities of the logistic regression as nonresponse bias weights, we performed sensitivity analyses to determine the appropriateness of applying weights to the entire data set. Academic status was only known for respondents, so the potential nonresponse bias between academic and nonacademic centers could not be assessed.
RESULTS
Nonresponse bias weight analysis.
Of 78 laboratories, 43 (55%) from Magnet-certified institutions responded to the survey compared to 29/73 (40%) from non-Magnet-certified institutions (P = 0.008). Additionally, 47/107 (44%) laboratories that identified as being a part of a larger health system responded compared to 25/44 (57%) of hospitals that did not identify as being a part of a larger system (P = 0.15). A multivariable logistic regression model determined that only Magnet certification significantly increased the odds of survey participation by 2-fold (P = 0.01). The only variable of interest from the data set that was significantly associated with Magnet certification (and thereby potentially subject to nonresponse bias) was the identification of Pseudomonas aeruginosa from culture (P = 0.02). The estimates from our weighted and unweighted analyses for Pseudomonas aeruginosa differed by only a few percentage points and yielded the same conclusions. Since nonresponse bias weighting is generally only recommended if there are strong associations between sampling frame variables and survey participation, as well as several key survey statistics of interest, nonresponse bias weighting did not seem warranted for this study (11).
Study population.
The overall response rate (RR2) was 48% (73/153), including 69% (32/46) for free-standing pediatric laboratories (12). Table 1 describes the hospital and laboratory characteristics of the responding laboratories. Most respondents, 56/73 (78%) reported being a part of an academic institution or teaching hospital. Hospitals from all bed size categories were represented, ranging from less than 50 beds to greater than 400 beds, with 49% (35/72) of respondents reporting a hospital size between 100 and 400 beds. Surveyed laboratories included facilities that handle pediatric specimens only, as well as facilities that handle both adult and pediatric specimens. Respondents represented a variety of roles within the laboratory, including directors, managers, and lead clinical scientists.
TABLE 1.
Descriptive characteristics of participating hospital laboratories
| Characteristic | No. (%) |
|---|---|
| Hospital characteristics (n = 73) | |
| Free-standing pediatric hospital | 32 (44) |
| Children's hospital within a hospital | 41 (56) |
| Hospital with a pediatric unit(s) only (no neonatal) | 1 (2) |
| Hospital with pediatric and neonatal units | 39 (98) |
| Size by bed number (n = 72) | |
| Less than 50 | 6 (8) |
| 50–100 | 16 (22) |
| 100–400 | 35 (49) |
| >400 | 15 (21) |
| Academic hospital | 56 (78) |
| Laboratory Characteristics | |
| Type of specimen processing | |
| Pediatric specimens only | 22 (30) |
| Adult and pediatric specimens | 51 (70) |
| Role of survey participant | |
| Laboratory director (of at least 1 lab including microbiology) | 19 (26) |
| Laboratory manager (of at least 1 lab including microbiology) | 3 (4) |
| Laboratory supervisor (of at least 1 lab including microbiology) | 3 (4) |
| Lead microbiologist or senior clinical lab scientist | 3 (4) |
| Microbiology director | 24 (33) |
| Microbiology manager or supervisor | 21 (29) |
Specimen collection and receipt.
Eighty-four percent (61/73) of labs said that they handle all TA specimens in-house and do not send them to reference laboratories for culture. Five percent (4/73) of laboratories reported being aware that they receive surveillance TA specimens for culture (Table 2). When asked about specimen dilution during collection, only 7% (5/71) of labs reported that they know when a specimen is diluted with saline during the collection process and prior to transport to the lab (Table 2). Forty-four percent (32/72) of laboratories reported the use of specimen rejection criteria based on delay of transport, but the criteria used varied widely across the labs. Of 72 laboratories, 27 (38%) reported the use of rejection criteria based on container type.
TABLE 2.
Tracheal aspirate specimen collection, processing, and Gram staining
| Laboratory process | No. (%) |
|---|---|
| Specimen collection and receipt | |
| Labs that are aware if a tracheal aspirate specimen has been diluted with saline upon receipt in the laboratory (n = 71) | 5 (7) |
| Labs with rejection criteria for tracheal aspirate specimens based on time from collection to delivery in the microbiology laboratory (n = 72) | 32 (44) |
| Criteria of laboratories with time rejection criteria (n = 31) | |
| >2 hours after collection if refrigerated OR >24 hours after collection | 24 (75) |
| After 30 min to 1 hour of collection | 3 (9) |
| >4 days after collection | 1 (3) |
| Same day | 1 (3) |
| Other | 3 (9) |
| Labs with rejection criteria for tracheal aspirate specimens based on container type (n = 72) | 27 (38) |
| Labs performing surveillance tracheal aspirate cultures (n = 73) | 4 (5) |
| Labs that process tracheal aspirate specimens for culture in-house (n = 73) | 61 (84) |
| Tracheal aspirate Gram staining | |
| Labs that prepare a tracheal aspirate Gram stain by selecting the most purulent area of the specimen and spreading it on to a slide (n = 61) | 60 (98) |
| Labs that reject tracheal aspirate specimens for culture based on Gram stain criteria (n = 61) | 14 (23) |
| Criteria for rejection based on Gram stain (n = 14) | |
| Rejection based on number of epithelial cells seen | 7 (50) |
| Rejection based on Q score | 1 (7) |
| Rejection based on a combination of epithelial cell, PMN, and organism quantities | 6 (43) |
| Microscope objective used to observe human cells in tracheal aspirate Gram stains (n = 61) | |
| 10× | 39 (64) |
| 40× | 6 (10) |
| 100× | 14 (23) |
| 10× for epithelial cells, 100× for PMNS | 2 (3) |
| Labs using the 100× microscope objective to view organisms on tracheal aspirate Gram stains | 60 (98) |
| Labs using minimum Gram stain field review criteria | 34 (56) |
| Criteria used for minimum field review (n = 34) | |
| 5–15 fields | 8 (23) |
| 20–40 fields | 19 (56) |
| 50–100 fields | 4 (12) |
| "several" | 2 (6) |
| 1/2 of the slide | 1 (3) |
| Gram stain quantitative methods (n = 61) | |
| Quantitatively (e.g., X number of organisms or cells per high power field) | 3 (5) |
| Semiquantitatively (e.g., rare, few, moderate, heavy) | 57 (93) |
| No form of quantitation (organisms or cells are listed) | 1 (2) |
| Labs culturing tracheal aspirate specimens in-house (n = 60) | 60 (100) |
| Lab plating methods for tracheal aspirate cultures (n = 61) | |
| Semiquantitative: quadrants are streaked on the plate and growth is reported as either a version of rare, few, moderate, heavy, or 1+, 2+, 3+, 4+ | 56 (92) |
| Quantitative: colonies are counted and multiplied by a dilution factor | 3 (5) |
| Other | 2 (3) |
Gram staining and plating.
Of the laboratories that process TA specimens in-house (61/73), 98% of respondents said they prepare the TA Gram stain by identifying the most purulent-looking portion of the specimen and spreading it on to a slide. Of laboratories that process their own specimens, 77% (47/61) do not use Gram stain rejection criteria (Table 2). Of these, 50% (7/14) reported they reject specimens based on the quantity of epithelial cells seen on Gram stain, 7% (1/14) said they reject specimens based on a Gram stain Q-score system, and 43% (6/14) said they reject specimens based on a combination of epithelial cell, polymorphonuclear cell, and organism quantities. When asked which microscope objective is used to observe epithelial and polymorphonuclear cells, 64% (39/61) of respondents said the 10× objective, 10% (6/61) report using the 40× objective, 23% (14/61) use the 100× objective, and 3% (2/61) use a combination of 10× for epithelial cells and 100× for polymorphonuclear cells.
Of the 61 laboratories responding in the Gram stain domain of the survey, 34 (56%) reported having minimum Gram stain field review criteria in place. The criteria themselves were variable, with 56% (19/34) of respondents reporting that they require anywhere between 20 and 40 fields to be reviewed before a final Gram stain report can be issued, 23% (8/34) require between 5 and 15 fields, 12% (4/34) require between 50 and 100 fields, 6% (2/34) require “several” fields, although this value was not specified, and 3% (1/34) require at least half of the slide. The majority of respondents, 57/61 (93%) reported that they quantitate organisms and cells on the Gram stain using a semiquantitative method (rare, few, moderate, or heavy, for example), while 5% (3/61) reported using a quantitative method and 2% (1/61) did not quantitate at all, with cells and organisms simply listed. Ninety-two percent of respondents (56/61) reported that they plate TA specimens using a semiquantitative method involving quadrant streaking.
Specimen culture.
Respondents were asked to describe the processes by which they identify and perform susceptibility testing on organisms in culture that can cause pneumonia in children (Table 3).
TABLE 3.
Organism identification and susceptibility methods
| Method | P. aeruginosa (no. [%]) | Enteric Gram-negative rods (no. [%]) | Nonfermenting Gram-negative rods (no. [%]) | H. influenzae (no. [%]) | S. pneumoniae (no. [%]) | S. pyogenes (no. [%]) | S. aureus (no. [%]) |
|---|---|---|---|---|---|---|---|
| Identification (n = 60 [GNR]; n = 61 [GPO])a | |||||||
| Always identified and reported, regardless of purity, quantity, or original Gram stain | 26 (43) | 12 (20) | 12 (20) | 14 (23) | 23 (38) | 49 (80) | 22 (36) |
| Fully identified if predominant, in pure culture, or seen in the original Gram stain | 34 (57) | 47 (78) | 47 (78) | 45 (75) | 38 (62) | 12 (20) | 33 (54) |
| MRSA is always ruled out and reported if present in any quantity. MSSA is only reported if in pure culture or is the predominant organism | NA | NA | NA | NA | NA | NA | 5 (8) |
| Other | NA | 1 (2) | 1 (2) | 1 (2) | NA | NA | 1 (2) |
| Susceptibility testing (n = 61) | |||||||
| Always performed, regardless of purity, quantity, or original Gram stain | 25 (41) | 7 (11) | 11 (18) | 3 (5) | 18 (29) | 5 (8) | 16 (26) |
| Performed if predominant, in pure culture, or seen in the original Gram stain | 36 (59) | 52 (85) | 47 (77) | 15 (24) | 42 (69) | 4 (7) | 37 (61) |
| Only performed on provider request | NA | 1 (2) | 2 (3) | 4 (7) | 1 (2) | 52 (85) | NA |
| A beta lactamase is performed, additional susceptibility testing performed only on request | NA | NA | NA | 39 (64) | NA | NA | NA |
| Screening methods are used to rule out MRSA. Susceptibilities are always performed on MRSA, MSSA only gets susceptibility testing if it is the predominant organism or in pure culture | NA | NA | NA | NA | NA | NA | 6 (10) |
| Other | NA | 1 (2) | 1 (2) | NA | NA | NA | 2 (3) |
GNR, Gram-negative rods; GPO, Gram-positive organisms; NA, not applicable.
Gram-negative organisms. Survey participants were asked about their identification and susceptibility methods for Pseudomonas aeruginosa, enteric Gram-negative rods, nonfermenting Gram-negative rods other than Pseudomonas aeruginosa, and Haemophilus influenzae. For P. aeruginosa, 43% (26/60) of respondents said they would always identify and report the organism, 57% (34/60) of respondents said that they would only identify and report P. aeruginosa if it was predominant or in pure culture, or seen in the original Gram stain. For susceptibility testing of P. aeruginosa, 41% (25/61) of respondents said they always perform susceptibility testing while 59% (36/61) of respondents said susceptibility testing is only performed if the organism is predominant, growing pure in culture, or seen in the original Gram stain (Table 3).
When asked about enteric Gram-negative rods, 20% (12/60) of respondents reported that they always identify and report them, and 11% (7/61) said they always perform susceptibility testing. Seventy-eight percent (47/60) of respondents reported that they identify and report enteric Gram-negative rods only when they are predominant, growing in pure culture, or are seen in significant amounts in the original Gram stain. Eighty-five percent (52/61) reported they only perform susceptibility testing on these organisms when they are predominant, in pure culture, or seen in the original Gram stain. Two percent (1/61) reported susceptibility testing on enteric Gram-negative rods is only performed when the clinician requests it.
When asked about nonfermenting Gram-negative rods (e.g., Acinetobacter spp., Stenotrophomonas maltophilia, or Burkholderia cepacia), 20% (12/60) of respondents reported that they always identify and report these organisms and 18% (11/61) reported they always perform susceptibility testing. Seventy-eight percent (47/60) of respondents indicated that these organisms are fully identified and reported only when the organism is growing pure in culture, predominant, or seen in significant amounts in the original Gram stain. Seventy-seven percent (47/61) of respondents reported that they only perform susceptibility testing on nonfermenting Gram-negative rods when the same criteria of pure culture, predominance, or significant Gram-stain results are met (Table 3).
For Haemophilus influenzae, 23% (14/60) always identified and reported the organisms and 5% (3/61) always perform susceptibility testing. Seventy-five percent (45/61) indicated that they identify and report H. influenzae from TA cultures only when it is predominant, growing in pure culture, or seen in the original Gram stain. Sixty-four percent (39/61) reported that they perform a beta-lactamase test but leave additional susceptibility testing up to the request of a clinician, and 24% (15/61) performed susceptibility testing when the organism was predominant or in pure culture.
Gram-positive organisms. Survey participants were asked about their identification and susceptibility methods for Streptococcus pneumoniae, Streptococcus pyogenes, and Staphylococcus aureus (Table 3). With respect to S. pneumoniae, 38% (23/61) of respondents indicated they always identified and reported the organism, while 29% (18/61) responded that they always performed susceptibility testing. Sixty-two percent (38/61) of respondents indicated that they only identify and report S. pneumoniae when the organism is predominant, demonstrates pure growth in culture, or is seen in the original Gram stain, and 69% (42/61) of respondents reported that they only perform susceptibility testing on the organism when the same set of criteria are met. Two percent (1/61) of respondents indicated that regardless of organism quantity or predominance seen in culture, susceptibility testing is only performed on S. pneumoniae when requested by a clinician.
When asked about culture practices involving S. pyogenes, 80% (49/61) of respondents reported that they always identify and report the organism regardless of quantity of growth in culture. Twenty percent (12/61) of respondents indicated that they only identify and report the organism if it is predominant, growing in pure culture, or seen in the original Gram stain. Eighty-five percent (52/61) reported that susceptibility testing is only performed when requested by a clinician, while 8% (5/61) reported that susceptibility testing is always performed, and 7% (4/61) reported they only perform susceptibility testing when the organism is predominant, growing in pure culture, or seen in the original Gram stain.
For S. aureus, 36% (22/61) of respondents indicated that they always identify and report the organism, regardless of the quantity seen in culture. In contrast, 54% (33/61) of respondents indicated that S. aureus is only identified and reported if it is predominant or growing in pure culture. Eight percent (5/61) of respondents indicated that identification and reporting of the organism depends on if the organism is methicillin-susceptible S. aureus (MSSA) or methicillin-resistant S. aureus (MRSA); MRSA is always ruled out and reported in any quantity and MSSA is only reported if it is predominant or growing in pure culture. Sixty-one percent (37/61) of respondents said that even if MRSA is identified, neither MRSA nor MSSA get susceptibility testing unless they are predominant in culture, growing in pure culture, or organisms resembling MRSA/MSSA are seen in the Gram stain in significant quantities. Twenty-six percent (16/61) of respondents indicated that all S. aureus (MRSA and MSSA) isolates get susceptibility testing regardless of quantity of growth on a plate or on Gram stain, while 10% (6/61) reported that susceptibility testing relies first on screening methods such as the PBP2a antigen test or the cefoxitin screen to rule out MRSA. If MRSA is identified, susceptibility testing is performed, but if MSSA is identified, susceptibility testing is only performed if it is predominant in culture, growing in pure culture, or seen in the original Gram stain.
Identification of fungi and yeasts. Survey participants were asked to describe their identification processes for fungi and yeast growing from TA cultures (Table 4). Seventy-seven percent (47/61) of respondents reported that they always identify and report fungi if seen in culture, while 13% (8/61) indicated they would give a presumptive identification of “fungus” and perform full identification only at the request of the provider. Twenty percent (12/61) of respondents indicated they always report yeast regardless of quantity or predominance in culture, while 10% (6/61) provide the presumptive identification of “yeast” and perform full identification upon further request from a clinician. Twenty-nine percent (18/61) of respondents reported they fully identify yeasts if they are predominant or growing in pure culture, 28% (17/61) rule out Cryptococcus spp. first and then identification depends on predominance or growth in pure culture, 2% (1/61) report “yeast” with no further identification, and 3% (2/61) use a germ tube test to identify Candida and perform additional identification on further request by a clinician.
TABLE 4.
Identification of fungi and yeast in tracheal aspirate cultures
| Method | Fungi (no. [%]) |
Yeast (no. [%]) |
|---|---|---|
| Identification (n = 61)a | ||
| Always identified and reported, regardless of quantity seen in culture | 47 (77) | 12 (20) |
| Reported as “fungus” or “yeast” and full identification performed on further request | 8 (13) | 6 (10) |
| Identified when predominant or in pure culture | NA | 18 (29) |
| Reported as “yeast,” no further identification | NA | 1 (2) |
| Always rule out Cryptococcus, additional identification depends on predominance or in pure culture | NA | 17 (28) |
| Perform germ tube test to identify Candida, otherwise identification performed on further request | NA | 2 (3) |
| Other | 6 (10) | 5 (8) |
NA, not applicable.
Miscellaneous laboratory information. To further understand laboratory identification and susceptibility practices, survey participants were asked a series of questions pertaining to antimicrobial stewardship, the use of antibiograms, and laboratory-based organism identification methods. All 73 survey respondents reported having an antimicrobial stewardship team at their facility. Thirty-five percent (25/71) of respondents reported using unit-specific antibiograms at their hospitals. Eighty-seven percent (62/71) of respondents said that they have a matrix-assisted laser desorption ionization–time of flight mass spectrometry (MALDI-TOF MS) instrument in their laboratory and that it is used for organism identification. When asked about additional organism identification methods, 4% (3/69) indicated they use biochemical methods, 10% (7/69) use some sort of automated system such as Vitek or Microscan, 77% (53/69) use a combination of automated systems and biochemical methods, and 9% (6/69) reported using some other process.
Relationships between hospital characteristics and laboratory processes.
We hypothesized that laboratory processes could be significantly different between the following two hospital and laboratory characteristics: (i) whether a laboratory is a part of an academic (teaching) hospital or not, and (ii) whether a laboratory handles only pediatric specimens or handles both adult and pediatric specimens.
Academic (teaching) facilities compared to nonacademic facilities. The academic status of the hospitals for which laboratories responded to the survey was significantly related to several organism identification and susceptibility processes (Fig. 2). Nonacademic laboratories were more likely to always identify and report S. pneumoniae (P = 0.02), S. aureus (P = 0.02), P. aeruginosa (P = 0.05), enteric Gram-negative rods (P = 0.006), and nonfermenting Gram-negative rods (P = 0.006), regardless of factors like purity, predominance in culture, or original Gram stain results. Additionally, nonacademic laboratories were more likely to always perform susceptibility testing on S. aureus (P = 0.005) compared to academic laboratories.
Comparison of laboratories that handle only pediatric specimens to those that handle both adult and pediatric specimens. Free-standing pediatric laboratories were more likely to always identify and report S. pyogenes (P = 0.02) and P. aeruginosa (P = 0.03), regardless of other factors like purity, predominance in culture, or original Gram stain results. Additionally, free-standing pediatric laboratories were more likely to always perform susceptibility testing on P. aeruginosa (P = 0.006) and H. influenzae (P = 0.02) (Fig. 2).
Respondent opinions of tracheal aspirate processes.
The survey included a free-response section where respondents could provide additional insight into their opinions on the TA culture process. Overall, laboratory personnel reported they find existing processes to be frustrating and challenging and in need of formal guidance, with one respondent saying, “we essentially perform full workup and antimicrobial susceptibility testing on these cultures since there are no clear guidelines available for significance. A guideline would be immensely helpful.” Another respondent supported this by saying, “these cultures are, as you probably know, often a complex mix of opportunistic pathogens of various levels of virulence. Workup is thus unsatisfying “mixed flora” often being reported. I'm hoping that this group develops evidence-based guidelines that are then disseminated through the American Society for Microbiology or Clinical and Laboratory Standards Institute. Thank you.”
DISCUSSION
In this national survey of microbiology laboratories, we have identified the primary methods used in the workup of TA specimens, as well as the heterogeneity that exists among laboratory practice patterns. Given the absence of any laboratory guidelines for TA culture workup, this variability is not surprising, and is likely driven by a lack of quality evidence in the TA literature.
Clinical microbiology laboratories play a key role in antimicrobial and diagnostic stewardship. These laboratories are responsible for ensuring the most appropriate specimen is used for testing, but also for the accurate and timely release of results, which has a direct impact on patient care and various clinical outcomes. In the absence of evidence-based clinical guidelines, laboratories are often left to design their TA culture protocol primarily around the preferences of clinicians at their institution. Variability in the TA culture process begins when the decision is made by a clinician to order the culture, and is seen throughout the specimen collection process, a factor that affects specimen quality and culture results before the specimen ever reaches the laboratory (13). These cultures are often overordered and overtreated, which is fueled by the lack of consensus on how to best collect, process, culture, and interpret them (15). Importantly, clinicians may not understand the limitations of the TA culture process and cannot discern specimen quality and significance of the results when they are making treatment decisions. Additionally, the variability among laboratory practices makes findings from VAP and tracheitis research studies nearly impossible to interpret or generalize (16). Without standardization of the TA culture process, this research will continue to be limited and is unlikely to move forward.
This is the first reported national survey of microbiology laboratories that focuses on the TA culture process. Strengths include the high overall response rate of 48% and the collection of detailed data representing all components of the laboratory process from specimen receipt through result reporting.
There are some limitations to note in this study. While the response rate was high for an electronic survey (14), these data may not be representative of all pediatric hospitals across the United States. Although we performed analyses to address the differences between respondents and nonrespondents, there could be differences we did not account for. Additionally, there may be practice differences among laboratory personnel that were not represented by the individual who responded to the survey. As this survey focused on laboratory practices, we did not evaluate clinical processes and decisions, such as how and why specimens are obtained, or who obtains them. These factors could potentially impact specimen quality and subsequent workup of the culture in the laboratory. Last, it is important to note that the reason for ordering a TA culture varies between institutions, and laboratories will typically design their culture protocols around the hospital’s patient population and needs of the clinicians who utilize TA cultures. The pre-pre-analytic and pre-analytic variability that occurs prior to the laboratory processes for TA cultures should be considered during guideline development and implementation. Decades of research has demonstrated that while TA cultures may be clinically useful in specific patient populations, lack of standardization in the laboratory is a major contributor to diagnostic variability and improving this process should be prioritized (13). Future research should include studies that demonstrate the feasibility and safety of laboratory-based interventions (such as Gram stain rejection criteria), structured implementation research that involves the monitoring of the impact of such interventions, and demonstration of how optimization of the use of this test impact key factors like clinical outcomes and cost.
In conclusion, this survey suggests that the management of TA specimens for culture varies greatly among pediatric institutions. Additionally, attention should be paid to all levels of specimen workup, not just one component like the Gram-staining process. The clear heterogeneity of these laboratory processes demonstrates that laboratory and clinical collaboration is needed to inform the development of evidence-based laboratory guidelines for TA culture, followed by correlative studies that demonstrate the clinical impact of these guidelines.
Supplementary Material
ACKNOWLEDGMENTS
We acknowledge all respondents for their participation in this survey.
This research received support from REDCap (NIH/NCRR Colorado CTSI grant number UL1 TR002535) and was also supported by NIH/NCATS Colorado CTSA grant number TL1 TR002533. The contents are the authors’ sole responsibility and do not necessarily represent official NIH views.
APPENDIX
IMPORTANT DEFINITIONS
- endotracheal aspirate culture
Collection of material obtained through endotracheal tube or tracheostomy tube. This is not the same as a sputum specimen.
- surveillance cultures
Cultures collected routinely regardless of symptoms. These may be daily, weekly, biweekly, or monthly.
- nonfermenting Gram-negative rods
These are the non-Pseudomonas Gram-negative rods that do not ferment glucose. Examples include Burkholderia cepacia, Stenotrophomonas maltophilia, and Acinetobacter species.
- coliform
A lactose-fermenting Gram-negative rod belonging to the Enterobacterales.
- susceptibility testing
Obtaining minimum inhibitory concentrations (MICs) through either an automated instrument method, broth dilution, disk diffusion, antimicrobial gradient diffusion, or agar dilution.
- biochemical methods
Nonautomated identification methods including rapid kits, analytical profile index (API) systems, media tubes and plates.
- pure culture
Growth of an organism alone in culture (i.e., it is the only organism growing).
- predominant
The predominant organism will be the organism that is growing more than any other organism. For example, on a plate with semiquantitative streaking, organism A would be predominant if it grew into the fourth quadrant while all other organisms only grew into the second quadrant. On a plate with quantitative streaking, the predominant organism would be the one with more colonies than any other organism.
Footnotes
Supplemental material is available online only.
REFERENCES
- 1.Foglia E, Meier MD, Elward A. 2007. Ventilator-associated pneumonia in neonatal and pediatric intensive care unit patients. Clin Microbiol Rev 20:409–425. doi: 10.1128/CMR.00041-06. [DOI] [PMC free article] [PubMed] [Google Scholar]
- 2.Kabak E, Hudcova J, Magyarics Z, Stulik L, Goggin M, Szijártó V, Nagy E, Stevens C. 2019. The utility of endotracheal aspirate bacteriology in identifying mechanically ventilated patients at risk for ventilator associated pneumonia: a single-center prospective observational study. BMC Infect Dis 19:756–756. doi: 10.1186/s12879-019-4367-7. [DOI] [PMC free article] [PubMed] [Google Scholar]
- 3.Mhanna MJ, Elsheikh IS, Super DM. 2013. Risk factors and outcome of Ventilator Associated Tracheitis (VAT) in pediatric trauma patients. Pediatr Pulmonol 48:176–181. doi: 10.1002/ppul.22588. [DOI] [PMC free article] [PubMed] [Google Scholar]
- 4.Claassen CC, Keenan WJ. 2019. Challenging the “culture” of the tracheal aspirate. NeoReviews 20:e145–e151. doi: 10.1542/neo.20-3-e145. [DOI] [PubMed] [Google Scholar]
- 5.Iosifidis E, Stabouli S, Tsolaki A, Sigounas V, Panagiotidou E-B, Sdougka M, Roilides E. 2015. Diagnosing ventilator-associated pneumonia in pediatric intensive care. Am J Infect Control 43:390–393. doi: 10.1016/j.ajic.2015.01.004. [DOI] [PubMed] [Google Scholar]
- 6.College of American Pathologists. 2014. CAP accredidation program microbiology checklist, p 102. College of American Pathologists, Northfield, IL. [Google Scholar]
- 7.Ziniel SI, McDaniel CE, Beck J. 2019. Bringing scientific rigor to survey design in health care research. Hosp Pediatr 9:743–748. doi: 10.1542/hpeds.2019-0101. [DOI] [PubMed] [Google Scholar]
- 8.Artino AR, La Rochelle JS, Dezee KJ, Gehlbach H. 2014. Developing questionnaires for educational research: AMEE guide no. 87. Med Teach 36:463–474. doi: 10.3109/0142159X.2014.889814. [DOI] [PMC free article] [PubMed] [Google Scholar]
- 9.Matkoski C, Sharp SE, Kiska DL. 2006. Evaluation of the Q score and Q234 systems for cost-effective and clinically relevant interpretation of wound cultures. J Clin Microbiol 44:1869–1872. doi: 10.1128/JCM.44.5.1869-1872.2006. [DOI] [PMC free article] [PubMed] [Google Scholar]
- 10.Harris PA, Taylor R, Thielke R, Payne J, Gonzalez N, Conde JG. 2009. Research electronic data capture (REDCap)—a metadata-driven methodology and workflow process for providing translational research informatics support. J Biomed Inform 42:377–381. doi: 10.1016/j.jbi.2008.08.010. [DOI] [PMC free article] [PubMed] [Google Scholar]
- 11.Little RJ, Vartivarian S. 2005. Does weighting for nonresponse increase the variance of survey means? Statistics Canada 31:161–168. [Google Scholar]
- 12.American Association for Public Opinion Survey. 2016. Standard definitions: final dispositions of case codes and outcome rates for surveys, p 62–65. American Association for Public Opinion Survey. https://www.aapor.org/AAPOR_Main/media/publications/Standard-Definitions20169theditionfinal.pdf. [Google Scholar]
- 13.Willson DF, Conaway M, Kelly R, Hendley JO. 2014. The lack of specificity of tracheal aspirates in the diagnosis of pulmonary infection in intubated children. Pediatr Crit Care Med 15:299–305. doi: 10.1097/PCC.0000000000000106. [DOI] [PubMed] [Google Scholar]
- 14.Nulty DD. 2008. The adequacy of response rates to online and paper surveys: what can be done? Assessment & Evaluation in Higher Education 33:301–314. doi: 10.1080/02602930701293231. [DOI] [Google Scholar]
- 15.Klompas M, Platt R. 2007. Ventilator-associated pneumonia—the wrong quality measure for benchmarking. Ann Intern Med 147:803–805. doi: 10.7326/0003-4819-147-11-200712040-00013. [DOI] [PubMed] [Google Scholar]
- 16.Nagendra S, Bourbeau P, Brecher S, Dunne M, LaRocco M, Doern G. 2001. Sampling variability in the microbiological evaluation of expectorated sputa and endotracheal aspirates. J Clin Microbiol 39:2344–2347. doi: 10.1128/JCM.39.6.2344-2347.2001. [DOI] [PMC free article] [PubMed] [Google Scholar]
Associated Data
This section collects any data citations, data availability statements, or supplementary materials included in this article.