

Abstract
Introduction:
The Medication Regimen Complexity -Intensive Care Unit (MRC-ICU) is the first tool for measuring medication regimen complexity in critically ill patients. This study tested machine learning (ML) models to investigate the relationship between medication regimen complexity and patient outcomes.
Methods:
This study was a single-center, retrospective observational evaluation of 130 adults admitted to the medical ICU. The MRC-ICU score was utilized to improve the inpatient model’s prediction accuracy. Three models were proposed: model I, demographic data without medication data; model II, demographic data and medication regimen complexity variables; and model III: demographic data and the MRC-ICU score. A total of 6 ML classifiers was developed: k-nearest neighbor (KNN), naïve Bayes (NB), random forest, support vector machine, neural network, and logistic classifier (LC). They were developed and tested using electronic health record data to predict inpatient mortality.
Results:
The results demonstrated that adding medication regimen complexity variables (model II) and the MRC-ICU score (model III) improved inpatient mortality prediction.. The LC outperformed the other classifiers (KNN and NB), with an overall accuracy of 83%, sensitivity (Se) of 87%, specificity of 67%, positive predictive value of 93%, and negative predictive value of 46%. The APACHE III score and the MRC-ICU score at the 24-hour interval were the 2 most important variables.
Conclusion and Relevance:
Inclusion of the MRC-ICU score improved the prediction of patient outcomes on the previously established APACHE III score. This novel, proof-of-concept methodology shows promise for future application of the MRC-ICU scoring tool for patient outcome predictions.
Keywords: critical care, clinical pharmacy, administration, clinical practice, medical informatics
Introduction
The Medication Regimen Complexity–Intensive Care Unit (MRC-ICU) scoring tool has been previously correlated with patient acuity scores, mortality, and pharmacist interventions, with the ultimate goal of being a reliable predictor of pharmacist resources.1,2 Although other tools to predict patient outcomes (eg, mortality) and resource allocation (eg, APACHE III, SOFA, SAPS) have been developed, none of these incorporate medication therapies.3 Furthermore, tools that do incorporate medication therapies to predict pharmacist workload have been developed but not specifically for the ICU setting or for external use beyond site-specific academic medical centers.4–6 Thus, the MRC-ICU is the first and only validated tool using medication regimen complexity in critically ill patients with the intent to predict both patient outcomes and pharmacist interventions; however, further validation is necessary.7
Ideally, the developed scoring value would build on existing patient acuity scores (eg, APACHE III) providing enhanced and more pharmacy-oriented information. Although APACHE III was developed to predict hospital mortality, it was never intended to be used as a personnel allocation strategy.8 Patient acuity scores such as APACHE have been used to determine physician and nurse to patient ratios, but complex medication regimens requiring pharmacist expertise are seen throughout the spectrum of patient care (eg, community to ambulatory to ICU).9,10 Previously, it has been suggested that pharmacist allocation may be best justified by the hybrid of patient acuity and medication regimen complexity.7
To imbed a tool like the MRC-ICU into a real-time, automated decision support system requires further external validation measures through health information technology–based resources—namely, machine learning (ML) methods. Recently, ML methods have been developed and used to predict sepsis,11,12 early warning of sepsis,13,14 unplanned transfer to the ICU,15 ICU discharge,16 acute kidney injury,17 complications in the critical care setting,18 and hospital mortality.18 These ML methods can support complex interactions in large data, identify hidden patterns, and provide timely predictions in critical care. ML provides an alternative strategy to statistical modeling and often shows superiority over traditional statistics.19
Thus, we proposed the development of an alternative validation strategy for the existing MRC-ICU tool using several ML models. Previously, the MRC-ICU tool was found to correlate with inpatient mortality and patient acuity. Here, a reverse engineering approach is proposed, with the development of a ML prediction model to predict inpatient mortality by including medication regimen complexity related binary variables and the MRC-ICU score. The primary goal of this study is to evaluate whether the MRC-ICU score at 24 hours is correlated with patient mortality.
Methods
Study Design
This ML study was designed using previously published data from the development and validation of the MRC-ICU.7 The central hypothesis is that addition of medication regimen complexity variables and the MRC-ICU score into ML models improves on APACHE III scores’ prediction of mortality in critically ill patients. This study was reviewed by the institutional review board (IRB) and deemed exempt from review.
Data Sources
The data were collected retrospectively from the medical ICU (MICU) of Augusta University Medical Center from November 2016 to June 2017. Briefly, patient demographics, patient outcomes, and individual medication components of the MRC-ICU were extracted from the electronic medical record system. The study data included a total of 130 MICU patients ≥18 years of age. Patients were excluded for an ICU length of stay (LOS) of less than 24 hours in the MICU, active transfer, or change in code status to hospice at 24 hours.7
MRC-ICU Scoring Tool
The MRC-ICU is an objective, quantitative scoring tool that describes the relative complexity of medication regimens in critically ill patients.12 The score consists of 39 components of different medication therapies (eg, vancomycin, aminoglycosides, heparin) and includes a weighted scoring system for the relative complexity of each individual agent (eg, vancomycin is weighted as 3 points, whereas a continuous infusion of crystalloid fluids is weighted as 1 point). The MRC-ICU scoring table is included in the online material (Supplemental Table 1, available online). Although the MRC-ICU can be scored at any time, evaluation at the 24-hour interval is the most studied and is used in the present study. The score has undergone validation testing for both internal and external validity, criterion-related validity, test-retest reliability, interrater reliability, and convergent-and divergent-related validity. The complete analytic algorithm has been reported elsewhere.7
Machine Learning Models
The data set has a total of 50 variables, which include patient demographics, admission information, and medication record (refer to summary Table 1 and Results section). For simplicity, the original variable “diagnosis at admission” was recoded into 6 categories: infection, gastrointestinal bleeding (GI_bleed), respiratory failure/distress (respiratory_dysfunction), substance overdoses, sepsis, and others. Three ML models are proposed:
Model I (Base model): This model included variables—namely, age, gender, admission weight, diagnosis at admission, LOS, home medications, total medications at 24 hours, and the APACHE III score. Medication regimens and MRC-ICU scores were omitted from this model.
Model II (Medication complexity model): This model included model I variables with the addition of each individual medication as a binary variable. The MRC-ICU score was omitted from this model. In this case, medications were not weighted as they are in the MRC-ICU score.
Model III (MRC-ICU model): This model included model I variables as well as the MRC-ICU score at 24 hours.
Table 1.
Baseline Demographics of the Study Population and Description of the Medication Regimens.
| Characteristics | Value |
|---|---|
| Age (min, mean, max), years | (21, 78, 85) |
| Gender (%) | |
| Male | 46 |
| Female | 54 |
| Admission weight (min, mean, max), kg | (32, 85, 250) |
| Diagnosis at admission (%) | |
| Sepsis | 20 |
| Respiratory problems | 30 |
| Infection | 12 |
| GI bleed | 5 |
| Substance overdose | 5 |
| Others (DKA, SIRS, cardiogenic shock, NSTEMI, etc) | 28 |
| Length of ICU stays (min, mean, max), days | (2, 5.7, 26) |
| Mortality (%) | |
| Alive | 79 |
| Died | 21 |
| Home medications at hospital admission (%) | |
| 0 = 0–4 | 29 |
| 1 = 5–10 | 45 |
| 2 = 11+ | 26 |
| Total number of medication orders at 24 hours (min, mean, max) | (10, 31, 69) |
| Total medications at 24 hours (min, mean, max) | (6, 17, 30) |
| MRC-ICU scoring tool components (%) | |
| Aminoglycosides | 5 |
| Antiarrhythmics | 4 |
| Anticonvulsants | 6 |
| Therapeutic heparins | 22 |
| Vancomycin (IV) | 58 |
| Continuous infusions (excludes those listed elsewhere) | 69 |
| Thromboembolic prophylaxis (exclude heparin infusion, enoxaparin) | 56 |
| Stress ulcer prophylaxis (excludes pantoprazole infusion) | 76 |
| Glycemic control (subcutaneous insulin, excludes IV insulin) | 34 |
| Bowel regimen | 22 |
| Chlorhexidine | 48 |
| Opioids/sedatives (scheduled and PRN) | 77 |
| Continuous opioid/sedative infusions (propofol, fentanyl, dexmedetomidine, ketamine, benzos) | 58 |
| Antimicrobials (includes HIV medications, excludes those listed elsewhere) | 43 |
| Restricted antimicrobials (includes PR vancomycin) | 70 |
| Dialysis | 19 |
| Mechanical ventilation | 60 |
| Othersa | 10 |
Abbreviations: DKA, diabetic ketoacidosis; GI, gastrointestinal; ICU, intensive care unit; IV, intravenous; max, maximum; min, minimum; MRC-ICU, Medication Regimen Complexity–ICU; NSTEMI, non–ST-elevation myocardial infarction; SIRS, systemic inflammatory response syndrome.
Anticoagulants (1%), azole antifungals (1%), chemotherapy (1%), digoxin (1%), theophylline (1%), TPN (nonpharmacist managed, 2%), immunosuppressants (3%), warfarin (3%).
Model Development and Statistical Analysis
For each model, 6 classifiers were developed and tested: support vector machine (SVM),20 naive Bayes (NB),21 a sample-based classifier k-nearest neighbor (KNN),22 the decision tree classifiers classification random forest (RF),21 neural network (NN),22 and logistic classifier (LC).23 These classification algorithms were chosen for their simplicity in implementation and interpretation. In brief, LC is the baseline supervised ML classification method, which estimates the probability of class membership in combination with a decision rule that makes dichotomous outcome; an NB classifier is a simple algorithm for classifying data based on the Bayes theorem, where it assumes that the presence of a particular feature in a class is unrelated to the presence of any other feature; a KNN classifier is a simple algorithm that stores all available cases and classifies new cases based on the assumption that similar things exist in close proximity, where it uses a similarity measure such as distance; RF is a tree-based supervised algorithm that identifies mutually exclusive subgroups that share similar important predictors of the outcome of interest through a series of binary recursive partitioning; an SVM classifier is a nonprobabilistic binary linear classifier where a hyperplane separates data across a decision boundary (plane) determined by only a small subset of the data called feature vectors in a 2-dimensional space; a NN classifier mimics the learning process occurring in human brains, where it consists of parameters, often called neurons, arranged in layers, which convert an input vector into some output (classes).20–23 R package caret was used for LC, NB, and KNN; e1071 for RF and SVM; and nnet for NN.
During data preparation, a single imputation approach was used to impute the 3 missing values for the variable APACHE score. Imputation was performed using mice functionality from the mice package.23 We assessed the correlation as pairwise variables using the Pearson correlation coefficient, whereas multicollinearity among the independent variables was tested using the Farrar-Glauber test for each model.24 None of the variables revealed multicollinearity. The data set was randomly segregated into training (80% of total data set) and test data (20% of total data set). The automatic grid search algorithm from the caret package was utilized to find the ML algorithm with the strongest predictive abilities. For the KNN classifier, optimal number of clusters (k = 5) were utilized for 3 models, and RF was built using mtry = 5’. For SVM, the tuning was performed using the tune function and determined the fixed cost function as 4 and cost = 4, with gamma as 0.0625. For NN, the parameters chosen were size = 4, decay = 0.0001, and maxit = 500.
In determining the optimal classification results, k-fold cross-validation (k = 10) was estimated for 10 repetitions. Area under the receiver operator characteristics curve (AUC) was selected as an overall performance measure because it provides an efficient measure independent of the class sizes and the classification threshold.25 Additional metrics included were sensitivity (Se; ability of the classifier to correctly classify an individual as dead at inpatient), specificity (Sp; ability of the classifier to correctly classify an individual as alive at inpatient), positive predictive value (PPV; it is the probability that, following a mortality prediction, the sample is truly deceased) and negative predictive value (NPV; it is the probability that the sample is truly alive). A 95% CI was calculated for each metric, and the results for 6 classifiers are developed and tested for a single-train data split for each model. After that, the top 3 classifiers were tested using over 100 random train-test splits to produce estimates of the mean and SD of the classifier’s performance. All analyses were performed using R (R Core Team, 2019), and figures were produced using the package ggplot2.26
Results
A total of 130 patients were included. Demographic information has been published previously, but in summary, patients were 54% female with an average age of 57.9 (SD = ±14.6) years. A large proportion of patients survived the ICU admission (79%) and underwent mechanical ventilation (60%).1 The diagnosis of respiratory failure and sepsis accounted for (50%) of ICU admissions. The total number of medication orders were 3985 (average ± SD: 30 ± 12 per patient), and the total number of medications administered were 2171 (average ± SD: 16.7 ± 5.19 per patient). The majority of the medications prescribed at the 24-hour interval were restricted antimicrobials (70%), opioids, and sedatives (77%). Demographic characteristics and medication classes are summarized in Table 1.
Tables 2, 3, and 4 present the performance measures of the 6 ML algorithms after a single-train data split for model I, model II, and model III, respectively. Precision/PPV was defined as percentage of patients predicted to die who did die during the inpatient stay. In model I, LC outperformed the other classifiers with a precision of 98% and a 94% overall prediction accuracy for patient death. Moreover, LC correctly classified patients who died with a Se of 93% (see Figure 1A and Table 2). Notably, all classifiers including LC were able to predict that patients did not die during the inpatient stay (NPV) on average at a rate of 62%, with a wide range of predictive values. The APACHE score (Admi_APACHE) calculated during the admission was identified as the most important feature (see Supplemental Figure 1, available online) for the top 4 classifiers (LC, KNN, NB, RF), ranked based on precision.
Table 2.
Performance of the Machine Learning Algorithms on Model I.
| AUC (95% CI) | Se (95% CI) | Sp (95% CI) | PPV (95% CI) | NPV (95% CI) | |
|---|---|---|---|---|---|
| LC | 0.94 (0.79, 0.99) | 0.93 (0.66, 0.99) | 0.94 (0.38, 1.00) | 0.98 (0.87, 1.00) | 0.62 (0.28, 0.94) |
| NB | 0.81 (0.64, 0.93) | 0.88 (0.70, 0.98) | 0.50 (0.12, 0.88) | 0.88 (0.70, 0.98) | 0.50 (0.12, 0.88) |
| RF | 0.88 (0.71, 0.96) | 0.92 (0.75, 0.99) | 0.67 (0.22, 0.96) | 0.92 (0.75, 0.99) | 0.67 (0.22, 0.96) |
| KNN | 0.78 (0.60, 0.91) | 0.85 (0.66, 0.96) | 0.40 (0.05, 0.85) | 0.88 (0.70, 0.98) | 0.33 (0.04, 0.78) |
| SVM | 0.88 (0.71, 0.96) | 0.92 (0.75, 0.99) | 0.92 (0.22, 0.96) | 0.92 (0.75, 0.99) | 0.67 (0.22, 0.96) |
| NN | 0.72 (0.53, 0.86) | 0.95 (0.74, 1.00) | 0.38 (0.14, 0.68) | 0.69 (0.48, 0.86) | 0.83 (0.36, 1.00) |
Abbreviations: AUC, area under the receiver operator characteristics curve; KNN, k-nearest neighbor; LC, logistic classifier; NB, naive Bayes; NN, neural network; NPV, negative predictive value; PPV, positive predictive value; RF, random forest; Se, sensitivity; Sp, specificity; SVM, support vector machine.
Table 3.
Performance of the Machine Learning Algorithms on Model II.
| AUC (95% CI) | Se (95% CI) | Sp (95% CI) | PPV (95% CI) | NPV (95% CI) | |
|---|---|---|---|---|---|
| LC | 0.94 (0.79, 0.99) | 0.96 (0.80, 1.00) | 0.83 (0.36, 1.00) | 0.96 (0.80, 1.00) | 0.83 (0.36, 1.00) |
| NB | 0.81 (0.64, 0.93) | 0.86 (0.67, 0.96) | 0.50 (0.07, 0.93) | 0.92 (0.75, 0.99) | 0.33 (0.04, 0.78) |
| RF | 0.78 (0.60, 0.91) | 0.85 (0.66, 0.96) | 0.40 (0.05, 0.85) | 0.88 (0.70, 0.98) | 0.33 (0.04, 0.78) |
| KNN | 0.88 (0.71, 0.96) | 0.84 (0.66, 0.95) | 0.75 (0.19, 0.99) | 0.96 (0.80, 1.00) | 0.50 (0.12, 0.88) |
| SVM | 0.81 (0.64, 0.93) | 0.91 (0.72, 0.99) | 0.92 (0.16, 0.84) | 0.85 (0.65, 0.96) | 0.67 (0.22, 0.96) |
| NN | 0.81 (0.64, 0.93) | 0.91 (0.71, 0.99) | 0.50 (0.16, 0.84) | 0.85 (0.65, 0.96) | 0.67 (0.22, 0.96) |
Abbreviations: AUC, area under the receiver operator characteristics curve; KNN, k-nearest neighbor; LC, logistic classifier; NB, naive Bayes; NN, neural network; NPV, negative predictive value; PPV, positive predictive value; RF, random forest; Se, sensitivity; Sp, specificity; SVM, support vector machine.
Table 4.
Performance of the Machine Learning Algorithms on Model III.
| AUC (95% CI) | Se (95% CI) | Sp (95% CI) | PPV (95% CI) | NPV (95% CI) | |
|---|---|---|---|---|---|
| LC | 0.94 (0.84, 0.99) | 0.93 (0.86, 0.99) | 1.00 (0.52, 1.00) | 1.00 (0.87, 1.00) | 0.67 (0.22, 0.96) |
| NB | 0.81 (0.64, 0.93) | 0.88 (0.70, 0.98) | 0.50 (0.12, 0.88) | 0.88 (0.70, 0.98) | 0.50 (0.12, 0.88) |
| RF | 0.84 (0.67, 0.95) | 0.89 (0.71, 0.98) | 0.60 (0.15, 0.95) | 0.92 (0.75, 0.99) | 0.50 (0.18, 0.68) |
| KNN | 0.84 (0.67, 0.95) | 0.86 (0.68, 0.96) | 0.67 (0.09, 0.99) | 0.96 (0.80, 1.00) | 0.33 (0.04, 0.78) |
| SVM | 0.81 (0.64, 0.93) | 0.88 (0.70, 0.98) | 0.88 (0.12, 0.88) | 0.88 (0.70, 0.98) | 0.50 (0.12, 0.88) |
| NN | 0.84 (0.67, 0.95) | 0.92 (0.74, 0.99) | 0.57 (0.18, 0.90) | 0.88 (0.70, 0.98) | 0.67 (0.28, 0.96) |
Abbreviations: AUC, area under the receiver operator characteristics curve; KNN, k-nearest neighbor; LC, logistic classifier; NB, naive Bayes; NN, neural network; NPV, negative predictive value; PPV, positive predictive value; RF, random forest; Se, sensitivity; Sp, specificity; SVM, support vector machine.
Figure 1.
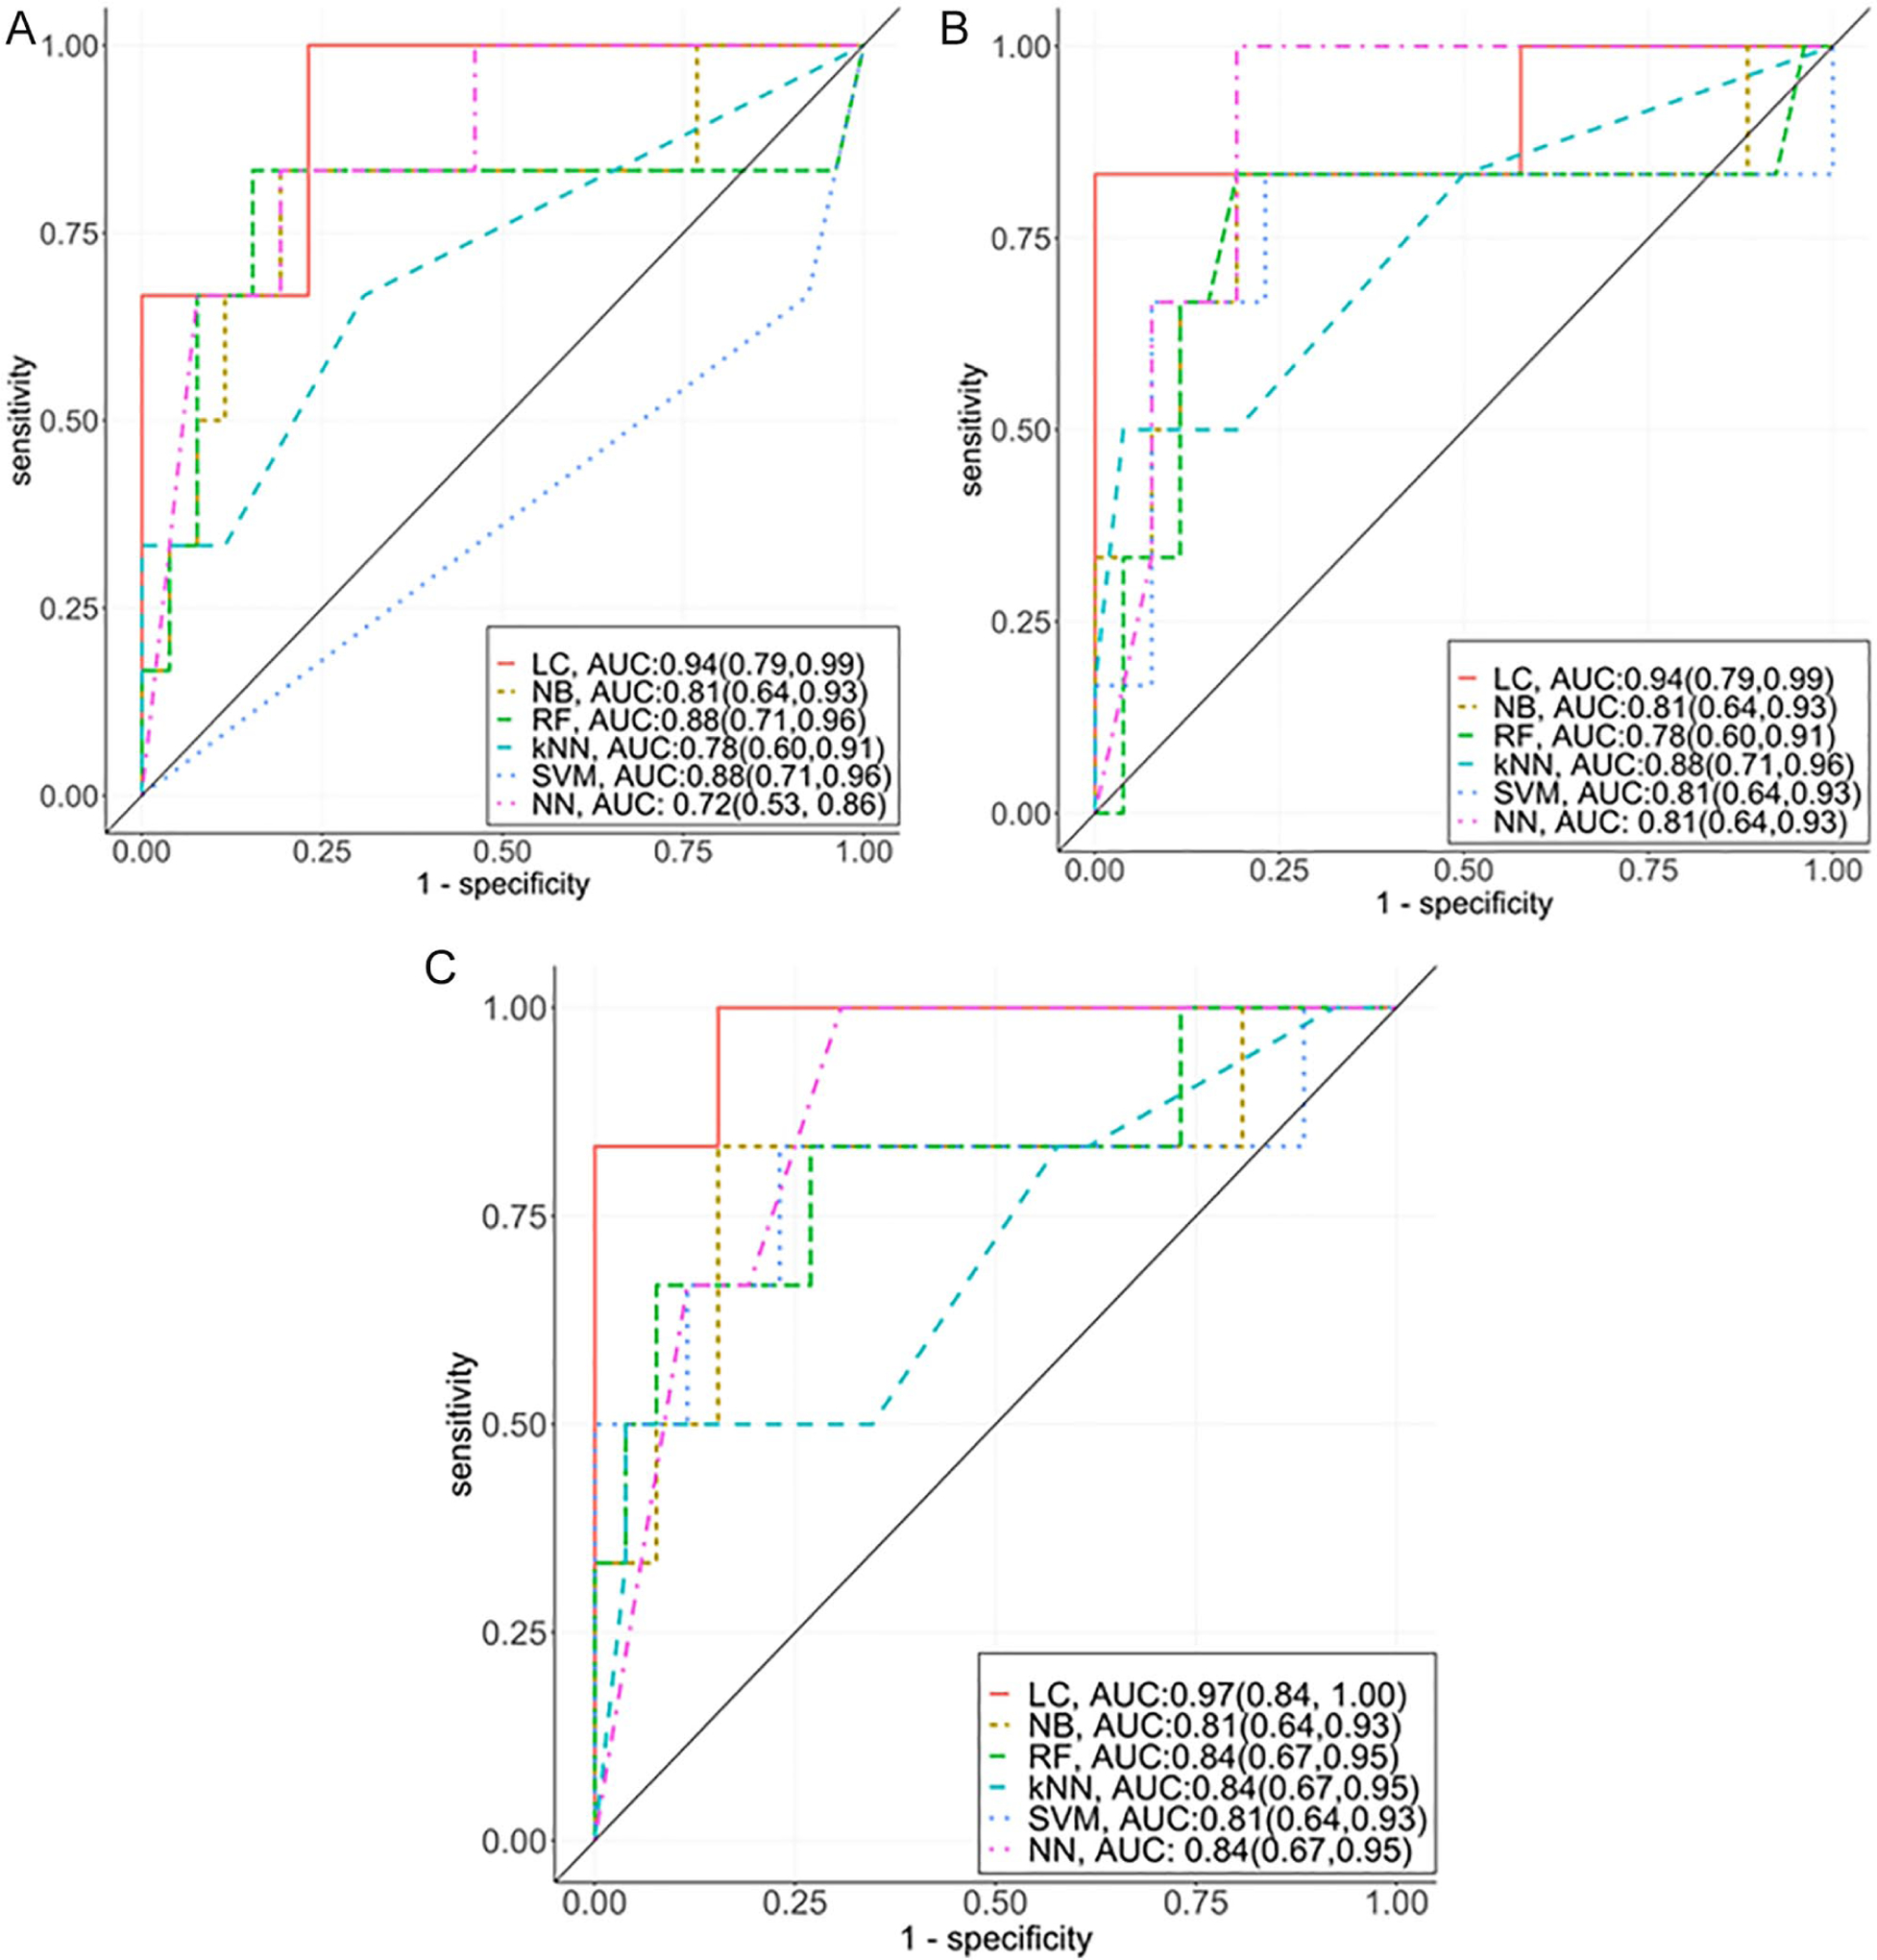
Performance matrix of the machine learning algorithms for predicting mortality among critically ill patients using 3 different model setups. Model I: base model without medication regimen complexity and MRC-ICU values at 24 hours; model II: model I + medication regimen complexity; and model III: model I + MRC-ICU values at 24 hours.
Abbreviations: KNN, k-nearest neighbor; LC, logistic classifier; MRC-ICU, Medication Regimen Complexity–intensive care unit; NB, naive Bayes; NN, neural network; RF, random forest; SVM, support vector machine.
When incorporating medication regimens as binary variables in model II, the LC classifier maintained the overall accuracy, remaining the same; however, Se (see Figure 1B) and NPV values improved significantly (see Table 3). Moreover, LC provided lower precision and specific values as compared with model I. The medication regimen variables such as intravenous vancomycin, restricted antimicrobials, and therapeutic heparins are seen in the top 5 important features (see Supplemental Figure 2) for the top 4 classifiers (LC, KNN, NB, RF, ranked based on precision).
In model III, adding the MRC-ICU score improved the CIs for Se (95% CI = 0.86–0.99), Sp (95% CI = 0.52–1.00), and precision (95% CI = 0.87–1.00), and overall NPV = 0.67 (95% CI = 0.22,0.96), when compared with model I and model II for LC algorithms (see Figure 1C). The variable importance plot denotes that the MRC-ICU (labeled: MRC_score) was the second most important feature in prediction of inpatient mortality for all 4 classifiers (LC, KNN, NB, and RF; see Supplemental Figure 3).
To address overfitting for model III, 100 random train-test splits were executed for the top 3 classifiers (LC, NB, and KNN). Table 5 presents a summary of the performance metric results. The LC classifier outperformed both the NB and KNN algorithms for predicting inpatient mortality in terms of overall accuracy (83%), Se (87%), and NPV (46%). However, KNN provided the highest precision (98%) when compared with either the LC (92%) or NB (95%) classifiers. Furthermore, KNN outperformed regarding the Sp (75%) when compared with the LC (67%) and NB (60%) classifiers. The feature importance table identifies the admission APACHE III scores to be the most important feature, and the MRC-ICU score at 24 hours also was identified to be within the top 3 most important features for all 3 classifiers (see Table 6).
Table 5.
Performance Metrics for Top 3 Classification Systems for Model III.
| AUC | Se | Sp | PPV | NPV | |
|---|---|---|---|---|---|
| KNN | 0.82 (0.07) | 0.83 (0.06) | 0.75 (0.36) | 0.98 (0.03) | 0.22 (0.15) |
| NB | 0.80 (0.06) | 0.83 (0.06) | 0.60 (0.36) | 0.95 (0.05) | 0.26 (0.19) |
| LC | 0.83 (0.07) | 0.87 (0.06) | 0.67 (0.28) | 0.93 (0.06) | 0.46 (0.19) |
Abbreviations: AUC, area under the receiver operator characteristics curve; KNN, k-nearest neighbor; LC, logistic classifier; NB, naive Bayes; NPV, negative predictive value; PPV, positive predictive value; Se, sensitivity; Sp, specificity.
Table 6.
Feature Importance Given by the Top 3 Classifiers, Evaluated Over 100 Train-Test Data Splits for Model III.a
| Importance (classifiers) | Rank | |||||
|---|---|---|---|---|---|---|
| Features | KNN | NB | LC | KNN | NB | LC |
| Age | 0.57 (0.03) | 0.57 (0.03) | 0.49 (0.37) | 4 | 4 | 8 |
| Gender | 0.54 (0.03) | 0.54 (0.02) | 0.97 (0.53) | 5 | 5 | 6 |
| Admi_weight | 0.53 (0.02) | 0.53 (0.02) | 1.45 (0.58) | 6 | 6 | 4 |
| Admi_APACHE | 0.76 (0.03) | 0.76 (0.03) | 3.61 (0.25) | 1b | 1b | 1b |
| Tot_orders_24h | 0.60 (0.03) | 0.60 (0.03) | 0.49 (0.44) | 3b | 3b | 7 |
| Tot_medica_24h | 0.53 (0.02) | 0.53 (0.02) | 1.26 (0.57) | 7 | 7 | 5 |
| Mecha_ventilation | 0.53 (0.02) | 0.53 (0.02) | 2.25 (0.41) | 8 | 8 | 2b |
| MRC_score_24h | 0.65 (0.03) | 0.65 (0.03) | 1.82 (0.42) | 2b | 2b | 3b |
Abbreviations: 24h, 24 hours; Admi, admission; KNN, k-nearest neighbor; LC, logistic classifier; Mecha, mechanical; MRC-ICU, Medication Regimen Complexity–intensive care unit; NB, naive Bayes; Tot_medica, total medication.
Importance values are presented as raw values as mean (SD).
Top 3 features (1, 2, and 3, respectively).
Discussion
In this first study to evaluate medication regimen complexity as a mortality predictor, the addition of the MRC-ICU scoring tool improves on traditional mortality prediction measures when added to a ML algorithm. Furthermore, these results corroborate previous findings in which the MRC-ICU scoring tool is closely correlated with patient characteristics (ie, APACHE III score) and patient outcomes (ie, inpatient mortality and LOS).1,2 Overall, these results support the hypothesis in which the medication regimen complexity tool is a predictor of mortality through the addition of medication information to model II and the incorporation of the MRC-ICU in model III. Both models II and III demonstrate improved performance when compared with an APACHE III score–driven model I. Prior to implementation of the tool at a patient care level, the development and utilization of a ML algorithm is required to investigate overall utility.
Six ML classification algorithms were developed to classify inpatient mortality using 3 model constructs, with the best (eg, most closely correlated) 3 algorithms chosen. When incorporating medications into model II, an improved prediction occurred in comparison to model I. The results of a performance measurement utilizing 100 random train-test splits identified that the use of the LC classifier provided a stronger correlation of inpatient mortality prediction while providing similar overall accuracy when compared with the NB and KNN classifiers. The variable importance plots for 3 models demonstrate that the APACHE score at admission was the most important feature. To further investigate, a submodel analysis utilizing model I was created omitting the APACHE score. For this submodel, LC showed 85% precision (PPV) and Se, where overall accuracy was 75% (see Supplemental Table 2). Moreover, KNN also provided similar Se and precision; however, all the classifiers underperformed (see Supplemental Figure 4) when compared with model III. Notably, the MRC_score_24h is the most important variable for all top classifiers (KNN, NB, RF, and LC; see Supplemental Figure 5). In total, these exercises confirmed that adding the analytic medication regimen complexity scores improved the prediction of patient outcomes.
Historically, LC, NB, KNN, and decision tree (RF) classifiers have been used in a multitude of applications for clinical decision making.14,16,27,28 Furthermore, SVM and NN are considered state-of the-art ML algorithms for classification.29 Utilizing these 6 classifiers, the 3 most strongly correlated classifiers were chosen with consideration of the best predictive receiver operating characteristic (ROC) curves and computational complexity reduction (LC, KNN, and NB, listed in order of decreasing ROC curve in Figure 1). Notably, the LC often provides appropriate baseline prediction unless the classification task requires complex decision boundaries (eg, SVM and NN). In the setting of increasing the variance in the explanatory and noise variables, LC consistently performed with higher overall accuracy as compared with RF.30 SVM, NN, and RF were excluded because of multiple feasibility considerations. First, NN outperformed the LC classifier in large data sets; however, the present data set is limited by size and number of features. Second, SVMs prefer high-dimensional data because of a linear separation. SVMs are easy to locate and were successful for predicting breast cancer,31,32 substrates of the breast cancer resistance protein,33 and chemotherapy resistance.34 Furthermore, the possibility exists that more cross-validation and complex feature engineering methods are required to obtain the best prediction accuracy using small data sets. Notably, choosing an optimal classifier is not a one-size-fits-all solution and depends on which individual metrics (eg, AUC, Se, Sp, PPV, and NPV) are required by the classification task.
Whereas patient acuity and medication regimen complexity are intertwined (eg, more acute patients often require more robust and intensive pharmacotherapy regimens), these results prove that they are not interchangeable factors, which has novel implications when applied at the bedside. First, the MRC-ICU is a potentially modifiable risk factor for reducing adverse patient outcomes. The utility of applying a weighted scoring tool over general inclusion of the sum of medication orders or individual medications (eg, vancomycin attributed weighted score of 3 points as opposed to simply presence or absence) lends credence to the concept that specialized content knowledge of medication therapy has the potential to improve outcomes. Application of high-level content knowledge by critical care pharmacists is an intriguing approach. Historically, critical care pharmacists have been identified as vital members of the interdisciplinary team because of various outcome improvements; however, the mechanism of their benefit and how to maximize their value are key knowledge gaps.35 These findings pose a unique hypothesis bridging pharmacist activity (measured as interventions) to patient outcomes (eg, mortality, LOS) through the mitigation of medication regimen complexity. Furthermore, MRC-ICU’s specific orientation toward pharmacists as a resource allows for prediction of pharmacist interventions, which has been previously established as correlating to the MRC-ICU.1,2 Algorithm-based prediction of pharmacist interventions (a measurement of workload) could then be translated to both times needed for patient care and the quantity of patients cared for during a customary 8-hour shift, which ultimately translates to a pharmacist-to-patient ratio. Indeed, provider-to-patient ratio is a known modifiable factor that improves outcomes, but no pharmacist-to-patient ratio has been established for critically ill patients. A previous evaluation noted that a majority of pharmacists care for >30 patients daily, which was associated with perceptions of reduced safety and, a priori, is likely too many patients to achieve optimal pharmacist-mediated patient benefit.35 Although the present study is unable to answer these questions because of lack of pharmacist intervention data and sample size, these results are a vital first step in the optimization of an underutilized resource known to improve patient outcomes.35
This study has several limitations. First, the selected best classifiers can predict the inpatient mortality on average 90%, whereas their NPV values are <50%. This low NPV may be the result of a small sample size and type of included data. Indeed, these ML models may be enhanced by including more detailed hourly data of patient physiological status (eg, vital signs, continuous infusion medications). Second, the excluded classifiers (SVM, NN, and RF) require appropriate feature selection algorithms (eg, SVM with backward feature selection (SVM-BW), SVM with forward feature selection (SVM-FW)), and larger sample sizes are required to improve the prediction performance. The current MRC-ICU scoring tool considers all medications within a predefined 24-hour period and is thus a static measurement of complexity. Finally, the single-center data used here limit external validity, and implementation of feature selection algorithms in multicohort data sets will be required. We recognize that the ideal tool is likely a clinically applicable electronic health record dashboard incorporating both real-time MRC-ICU values and detailed individual patient information that would result in individualized predictions for pharmacist interventions and patient outcomes. Overall, these results are highly promising given high performance with a relatively small data set and previously published data demonstrating external validity of the MRC-ICU for other clinical outcomes.
Conclusion and Relevance
A ML algorithm that includes traditional prediction measures (ie, APACHE III) with the added dimension of medication regimen complexity with the MRC-ICU scoring tool improves the ability to predict mortality in critically ill patients. This novel, proof-of-concept methodology sets the stage for incorporation of more data into ML models to both predict further patient outcomes (eg, LOS, duration of mechanical ventilation) and also pharmacist allocation metrics (eg, pharmacist interventions and workload).
Supplementary Material
Funding
The authors disclosed receipt of the following financial support for the research, authorship, and/or publication of this article: Supported by the National Center for Advancing Translational Sciences (NCATS) of the National Institutes of Health (NIH) under Award Numbers UL1TR002378 and KL2TR002381.
Footnotes
Declaration of Conflicting Interests
The authors declared no potential conflicts of interest with respect to the research, authorship, and/or publication of this article.
Supplemental Material
Supplemental material for this article is available online.
References
- 1.Newsome AS, Anderson D, Gwynn ME, Waller JL. Characterization of changes in medication complexity using a modified scoring tool. Am J Health Syst Pharm. 2019;76(suppl 4):S92–S95. doi: 10.1093/ajhp/zxz213 [DOI] [PubMed] [Google Scholar]
- 2.Newsome AS, Smith SE, Olney WJ, et al. Medication regimen complexity is associated with pharmacist interventions and drug-drug interactions: a use of the novel MRC-ICU scoring tool. Am Coll Clin Pharm. 2020;3:47–56. [Google Scholar]
- 3.Granko RP, Poppe LB, Savage SW, Daniels R, Smith EA, Leese P. Method to determine allocation of clinical pharmacist resources. Am J Health Syst Pharm. 2012;69:1398–1404. doi: 10.2146/ajhp110510 [DOI] [PubMed] [Google Scholar]
- 4.Alves-Conceicao V, Rocha KSS, Silva FVN, Silva ROS, Silva DTD, Lyra DP Jr. Medication regimen complexity measured by MRCI: a systematic review to identify health outcomes. Ann Pharmacother. 2018;52:1117–1134. doi: 10.1177/1060028018773691 [DOI] [PubMed] [Google Scholar]
- 5.Naseman RW, Lopez BR, Forrey RA, Weber RJ, Kipp KM. Development of an inpatient operational pharmacy productivity model. Am J Health Syst Pharm. 2015;72:206–211. doi: 10.2146/ajhp130803 [DOI] [PubMed] [Google Scholar]
- 6.Giannini HM, Ginestra JC, Chivers C, et al. A machine learning algorithm to predict severe sepsis and septic shock: development, implementation, and impact on clinical practice. Crit Care Med. 2019;47:1485–1492. doi: 10.1097/CCM.0000000000003891 [DOI] [PMC free article] [PubMed] [Google Scholar]
- 7.Nemati S, Holder A, Razmi F, Stanley MD, Clifford GD, Buchman TG. An interpretable machine learning model for accurate prediction of sepsis in the ICU. Crit Care Med. 2018;46:547–553. doi: 10.1097/CCM.0000000000002936 [DOI] [PMC free article] [PubMed] [Google Scholar]
- 8.Churpek MM, Yuen TC, Winslow C, Meltzer DO, Kattan MW, Edelson DP. Multicenter comparison of machine learning methods and conventional regression for predicting clinical deterioration on the wards. Crit Care Med. 2016;44:368–374. doi: 10.1097/CCM.0000000000001571 [DOI] [PMC free article] [PubMed] [Google Scholar]
- 9.Ginestra JC, Giannini HM, Schweickert WD, et al. Clinician perception of a machine learning-based early warning system designed to predict severe sepsis and septic shock. Crit Care Med. 2019;47:1477–1484. doi: 10.1097/CCM.0000000000003803 [DOI] [PMC free article] [PubMed] [Google Scholar]
- 10.Wellner B, Grand J, Canzone E, et al. Predicting unplanned transfers to the intensive care unit: a machine learning approach leveraging diverse clinical elements. JMIR Med Inform. 2017;5:e45. doi: 10.2196/medinform.8680 [DOI] [PMC free article] [PubMed] [Google Scholar]
- 11.McWilliams CJ, Lawson DJ, Santos-Rodriguez R, et al. Towards a decision support tool for intensive care discharge: machine learning algorithm development using electronic healthcare data from MIMIC-III and Bristol, UK. BMJ Open. 2019;9:e025925. doi: 10.1136/bmjopen-2018-025925 [DOI] [PMC free article] [PubMed] [Google Scholar]
- 12.Koyner JL, Carey KA, Edelson DP, Churpek MM. The development of a machine learning inpatient acute kidney injury prediction model. Crit Care Med. 2018;46:1070–1077. doi: 10.1097/CCM.0000000000003123 [DOI] [PubMed] [Google Scholar]
- 13.Meyer A, Zverinski D, Pfahringer B, et al. Machine learning for real-time prediction of complications in critical care: a retrospective study. Lancet Respir Med. 2018;6:905–914. doi: 10.1016/S2213-2600(18)30300-X [DOI] [PubMed] [Google Scholar]
- 14.Thottakkara P, Ozrazgat-Baslanti T, Hupf BB, et al. Application of machine learning techniques to high-dimensional clinical data to forecast postoperative complications. PLoS One. 2016;11:e0155705. doi: 10.1371/journal.pone.0155705 [DOI] [PMC free article] [PubMed] [Google Scholar]
- 15.Knaus WA, Wagner DP, Draper EA, et al. The APACHE III prognostic system: risk prediction of hospital mortality for critically ill hospitalized adults. Chest. 1991;100:1619–1636. doi: 10.1378/chest.100.6.1619 [DOI] [PubMed] [Google Scholar]
- 16.Kleinpell R, Ward NS, Kelso LA, Mollenkopf FP Jr, Houghton D. Provider to patient ratios for nurse practitioners and physician assistants in critical care units. Am J Crit Care. 2015;24:e16–e21. doi: 10.4037/ajcc2015274 [DOI] [PubMed] [Google Scholar]
- 17.Franco JVA, Terrasa SA, Kopitowski KS. Medication discrepancies and potentially inadequate prescriptions in elderly adults with polypharmacy in ambulatory care. J Family Med Prim Care. 2017;6:78–82. doi: 10.4103/2249-4863.214962 [DOI] [PMC free article] [PubMed] [Google Scholar]
- 18.Gwynn ME, Poisson MO, Waller JL, Newsome AS. Development and validation of a medication regimen complexity scoring tool for critically ill patients. Am J Health Syst Pharm. 2019;76:S34–S40. doi: 10.1093/ajhp/zxy054 [DOI] [PubMed] [Google Scholar]
- 19.Mitchell T Machine Learning. McGraw-Hill; 1999. [Google Scholar]
- 20.Breiman L Random forests. Mach Learn. 2001;45:5–32. [Google Scholar]
- 21.Gurney K An Introduction to Neural Networks. CRC Press; 2018. [Google Scholar]
- 22.van Buuren S, Groothuis-Oudshoor CG. Mice: multivariate imputation by chained equations in R. J Stat Softw. 2011;45(3).doi: 10.18637/jss.v045.i03 [DOI] [Google Scholar]
- 23.Goldberger AS. A Course in Econometrics. Harvard University Press; 1991. [Google Scholar]
- 24.Fawcett T An introduction to ROC analysis. Pattern Recognit Lett. 2006;27:861–874. [Google Scholar]
- 25.Cheng G, Mustari MJ, Khanna S, Porter JD. Comprehensive evaluation of the extraocular muscle critical period by expression profiling in the dark-reared rat and monocularly deprived monkey. Invest Ophthalmol Vis Sci. 2003;44:3842–3855. [DOI] [PubMed] [Google Scholar]
- 26.Wickham H. ggplot2: Elegant Graphics for Data Analysis Using the Grammar of Graphics. Springer-Verlag; 2016. [Google Scholar]
- 27.Knisley CV, Damato JJ, McClatchy JK, Brennan PJ. Rapid and sensitive identification of Mycobacterium tuberculosis. J Clin Microbiol. 1985;22:761–767. [DOI] [PMC free article] [PubMed] [Google Scholar]
- 28.Watson DS, Krutzinna J, Bruce IN, et al. Clinical applications of machine learning algorithms: beyond the black box. BMJ. 2019;364:l886. doi: 10.1136/bmj.l886 [DOI] [PubMed] [Google Scholar]
- 29.Sevakula RK, Au-Yeung WTM, Singh JP, Heist EK, Isselbacher EM, Armoundas AA. State-of-the-art machine learning techniques aiming to improve patient outcomes pertaining to the cardiovascular system. J Am Heart Assoc. 2020;9:e013924. doi: 10.1161/JAHA.119.013924 [DOI] [PMC free article] [PubMed] [Google Scholar]
- 30.Couronné R, Probst P, Boulesteix AL. Random forest versus logistic regression: a large-scale benchmark experiment. BMC Bioinformatics. 2018;19:270. doi: 10.1186/s12859-018-2264-5 [DOI] [PMC free article] [PubMed] [Google Scholar]
- 31.Huang S, Cai N, Pacheco PP, Narrandes S, Wang Y, Xu W. Applications of support vector machine (SVM) learning in cancer genomics. Cancer Genomics Proteomics. 2018;15:41–51. doi: 10.21873/cgp.20063 [DOI] [PMC free article] [PubMed] [Google Scholar]
- 32.Henneges C, Bullinger D, Fux R, et al. Prediction of breast cancer by profiling of urinary RNA metabolites using support vector machine-based feature selection. BMC Cancer. 2009;9:104. doi: 10.1186/1471-2407-9-104 [DOI] [PMC free article] [PubMed] [Google Scholar]
- 33.Hazai E, Hazai I, Ragueneau-Majlessi I, Chung SP, Bikadi Z, Mao Q. Predicting substrates of the human breast cancer resistance protein using a support vector machine method. BMC Bioinformatics. 2013;14:130. doi: 10.1186/1471-2105-14-130 [DOI] [PMC free article] [PubMed] [Google Scholar]
- 34.Han M, Dai J, Zhang Y, et al. Support vector machines coupled with proteomics approaches for detecting biomarkers predicting chemotherapy resistance in small cell lung cancer. Oncol Rep. 2012;28:2233–2238. doi: 10.3892/or.2012.2037 [DOI] [PubMed] [Google Scholar]
- 35.Newsome AS, Smith SE, Jones TW, et al. A survey of critical care pharmacists to patient ratios and practice characteristics in intensive care units. J Am Coll Clin Pharm. 2020;3:68–74. [Google Scholar]
Associated Data
This section collects any data citations, data availability statements, or supplementary materials included in this article.