Correction to: Adv Ther 10.1007/s12325-020-01613-6
In the original article, Table 2 was incorrectly published. The correct Table 2 is given below.
Table 2.
Patient clinical characteristics at the initiation of eribulin
| All | TNBC | |
|---|---|---|
| n = 513 | n = 256 | |
| Line of therapy at initiation of eribulin (n, %) | ||
| 3 | 400 (78.0) | 225 (87.9) |
| 4 | 77 (15.0) | 25 (9.8) |
| ≥ 5 | 36 (7.0) | 6 (2.3) |
| ECOG-PS Categorical (n, %) | ||
| 0/1 | 313 (61.0) | 168 (65.6) |
| ≥ 2 | 199 (38.8) | 88 (34.4) |
| Unknown | 1 (0.2) | 0 (0.0) |
| Sites of metastases at initiation of eribulin (n, %) | ||
| Adrenal gland | 63 (12.3) | 26 (10.2) |
| Brain | 22 (4.3) | 15 (5.9) |
| Local lymph node(s) | 56 (10.9) | 40 (15.6) |
| Gastrointestinal system | 10 (2.0) | 1 (0.4) |
| Genitourinary system | 10 (2.0) | 4 (1.6) |
| Ovary | 14 (2.7) | 5 (2.0) |
| Liver | 294 (57.3) | 159 (62.1) |
| Lung | 342 (66.7) | 179 (69.9) |
| Lytic or mixed lytic-blastic bone | 99 (19.2) | 33 (12.9) |
| Pleura, pericardial, and/or peritoneal cavity | 28 (5.5) | 16 (6.3) |
| Othera | 4 (0.8) | 3 (1.2) |
| Duration of follow-up from metastatic diagnosisb, months | ||
| Mean, STD | 32.5 (16.8) | 28.5 (16.0) |
| Median, IQR | 29.9 (22.7) | 25.9 (20.6) |
ECOG-PS Eastern Cooperative Oncology Group performance status, IQR interquartile range, STD standard deviation, TNBC triple negative breast cancer
aIncluding chest wall and those with missing site information
bUntil last visit with provider or at clinic
The original article has been updated.
There is an error in result section of abstract. The correct sentence read as “Among the 49.9% of patients with TNBC, ORR was 55.1%, median PFS was 5.8 months (95% CI 5.1, 6.4), and median OS was 9.8 months (95% CI 8.6, 11.0)”.
There is an error in second paragraph of Duration of Eribulin Therapy. The correct sentence read as “Following discontinuation of eribulin, 175 (34.1%) of all patients and 99 (38.7%) of TNBC patients initiated another line of therapy”.
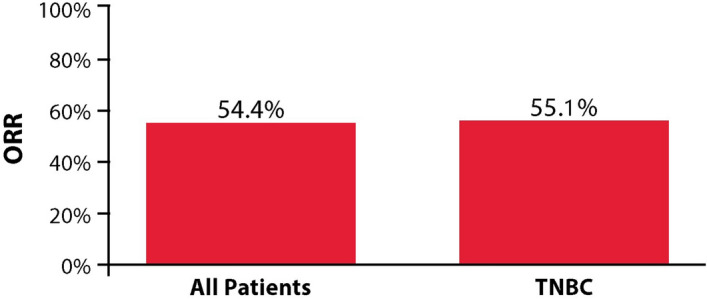
There is an error in the section Disease Response. The correct sentence read as “In the overall population, ORR was 54.4% (95% CI 50.0–58.7%) (Fig. 1). The CBR was 56.7% (95% CI 52.3–61.0%). A total of 41 patients (8.0%) had a CR, 238 (46.4%) had a PR, 88 (17.2%) had SD and 146 (28.5%) had PD”.
The duration of best response among the 261 patients with a CR or PR and known dates of initial response and progression was a median of 4.5 months (IQR 2.9, 7.1).
For patients in the TNBC subgroup, ORR was 55.1% (95% CI 48.8–61.2%) (Fig. 1). The CBR was 57.4% (95% CI: 51.1–63.5%).
At the time of data cut-off, 402 (78.4%) patients, including 219 (85.5%) in the TNBC subgroup, had progressed on eribulin therapy. The landmark PFS is presented in Fig. 2.
The landmark OS is presented in Fig. 4. At the 12-month landmark, 43.9% (95% CI 39.6–48.2%) of patients were alive in the overall population, while at the 24-month landmark, 23.9% (95% CI 20.2–27.7%) were alive (Fig. 4).
The figure 1 was incorrectly published. The correct Fig. 1 is given below.
Fig. 1.

ORR to eribulin treatment in all patients and the TNBC subgroup


