

Abstract
Lead (Pb) exposure is often determined through the analysis of whole blood though venipuncture poses ethical, economic, and logistical barriers. Dried Blood Spots (DBS) may help overcome such barriers though past studies measuring Pb in DBS have been challenged with quality control, small sample volumes, and other issues. Total Reflection X-Ray Fluorescence (TXRF) may help address some of these challenges but has yet to be used to measure Pb in DBS. As such, the aim of the current study was to develop, validate, and apply a method to analyze Pb in DBS samples using TXRF for use in human biomonitoring studies. First, we developed a novel method (tested a range of parameters), and then used blood reference materials to validate the method against performance criteria listed in ICH Q2A and Q2B and the European Bioanalysis Forum. Finally, we applied the method to two populations who exemplify divergent conditions (41 university members with relatively low Pb exposures sampled in a clinical environment; 40 electronic waste workers with relatively high Pb exposures sampled in a contaminated field setting). The limits of detection and quantification of the method were 0.28 and 0.69 μg/dL, respectively. The overall precision and accuracy of the method were 15% and 111%, respectively. The mean (±SD) DBS Pb levels by TXRF in the university members and e-waste workers were 0.78 (± 0.46) and 3.78 (± 3.01) μg/dL, respectively, and these were not different from Pb measures in venous whole blood using ICP-MS. Bland-Altman plot analyses indicated good agreement between DBS Pb measures by TXRF versus whole blood Pb measures by ICP-MS in both groups. By combining data from the two population groups, there was no significant constant bias (intercept of 0.02 μg/dL) or proportional bias (slope was −0.02) between the two measures, and the lower and upper LoA were −0.86 and 0.91 μg/dL, respectively, with a LoA range of 1.77 μg/dL. These results demonstrate that TXRF-based analysis of Pb content in DBS is a good alternative to the gold standard (i.e., ICP-MS analysis of whole blood), and helps overcome some of the challenges associated with current methods.
INTRODUCTION
Lead (Pb) exposure remains of public health concern worldwide as recognized by notable institutions including WHO (WHO, 2010), the U.S. Centers for Disease Control (ATSDR, 2017), and Health Canada (Health Canada, 2019). Exposure to Pb is most often determined through measuring Pb levels in blood (CDC, 2017), and values can be compared to regulatory guidelines to assess health risk. However, there remain several challenges associated with blood sampling including the need for specialized clinical settings, medical equipment, and skilled technicians as well as the use of invasive techniques (Sanders et al., 2009). Sampling blood is particularly challenging for vulnerable populations (e.g. children and elderly) and in remote or resource-limited regions, though these represent groups particularly at-risk for Pb exposure.
Dried Blood Spots (DBS) have been successfully used as an alternative to classical venipuncture (whole blood sampling) for about 40 years with many analytical methods validated and subsequently applied in a range of real world settings (Spooner et al., 2009; Nys et al., 2017; Li and Lee, 2014). Sampling blood using DBS has been regarded as a feasible alternative to venipuncture in that it is less invasive, associated with lower costs, and more amenable for use in remote or resource-limited areas (Li and Lee, 2014). While there is interest in the use of DBS for gauging Pb exposure there remain outstanding concerns. For example, in our review of 13 prior studies (summarized in Supplementary Table S1), seven of the studies relied upon relatively small sample sizes (< 20 individuals), seven of the studies reported a limit of detection which averaged near 1 μg/dL (close to mean blood Pb levels in the Canadian and US populations, i.e. 0.95 and 1.12 μg/dL respectively; CHMS, 2017; CDC, 2019), and key quality control aspects such as accuracy and precision were missing from many of the works.
The current “gold standard” for the determining blood Pb levels is the analysis of venous whole blood by Inductively Couple Plasma Mass Spectrometry (ICP-MS). Despite the high sensitivity of ICP-MS for detecting Pb in blood samples, this instrument has notable limitations for working with DBS such as the need for a relatively high sample volume (~200–500 μL versus a single 3 mm DBS punch which may be ~3 μL), the presence of matrix effects, potential for polyatomic and non-polyatomic interferences, and relatively high costs associated with procurement and operation. As an alternative to ICP-MS, Total Reflection X-Ray Fluorescence (TXRF) is proving feasible for the analysis of DBS as it is a multi-elemental analytical technique that allows for the analysis of small volumes (≤ 10 μL) (Stosnach, 2007; Dhara and Misra, 2011; Towett et al., 2013; Pawly et al., 2019). Compared to ICP-MS, TXRF-based analyses may have relatively low background noise and few interferences, detection limits in the ppb range (thus comparable to ICP-MS for several elements), lower operational and maintenance costs, and samples for TXRF analysis can be prepared in hours (versus hours-to-days) (Bilo et al., 2014).
To date some studies have determined Pb levels in whole blood using TXRF (Supplementary Table S2), though to our knowledge no study has measured Pb in DBS using TXRF. As such, the aim of the current study was to develop, validate, and apply a method to analyze Pb in DBS samples using TXRF for use in human biomonitoring studies. The realize this aim, our study consisted of three phases: 1) method development phase to establish initial assay parameters; 2) method validation phase with blood reference materials to refine assay parameters; and 3) application phase with real samples from human subjects. During phase 1 (method development) we tested different sample preparation methods and internal standards, and in phase 2 (method validation) we evaluated the method against performance criteria listed within ICH Q2A and Q2B (Guideline ICH, 2005) and the European Bioanalysis Forum (EBF) (Timmerman et al., 2011). Finally, in phase 3 the method was applied to evaluate Pb content in DBS from a group of university members (Santa-Rios et al., 2020) and workers from an electronic waste (e-waste) recycling site in Ghana (Srigboh et al., 2016). From both populations we were able to compare Pb measures in capillary DBS samples via TXRF versus the ‘gold standard’ which is Pb measures in venous whole blood via ICP-MS. These two populations exemplify divergent conditions (i.e., university members with relatively low Pb exposures sampled in a clinical environment versus workers with relatively high Pb exposures sampled in a contaminated field setting), which help demonstrate the wider applicability of the method.
EXPERIMENTAL SECTION
Blood Reference Materials and Chemicals
Whole blood reference materials were obtained from the Institut National de Santé Publique du Québec (INSPQ) Centre de Toxicologie du Québec (CTQ). We used five reference materials with assigned Pb concentrations ranging from 1.02 to 50.14 μg/dL (Supplementary Table S3). The reference material at the lowest concentration is a Pb-specific standard (i.e., a standard prepared and certified only for Pb), while the other reference materials were prepared for multiple elements. Internal standard (IS) solutions of Ni, Sr, and Ga were prepared from 1,000 mg/L stocks (Merck, Germany). Nitric acid (65% HNO3 Omnitrace grade, EMD Chemicals, NJ) and hydrochloric acid (12 N HCl, Merck, Germany) diluted to 6 N were used to prepare the samples. Methyl Isobutyl Ketone (MIBK, analytical grade, Merck, Germany) was used for iron extraction.
Instrumentation
The levels of Pb were measured in samples using Total X-Ray Fluorescence (model S2 Picofox, Bruker AXS Microanalysis, Berlin, Germany) and an ICP-MS (820-MS Series, Varian Inc., California, USA). We have previously outlined the operation of both instruments (Pawly et al., 2019; Srigboh et al., 2016). To assure that samples were free of contamination, we used metal-free microcentrifuge vials and pipette tips. The acrylic discs for TXRF analysis were cleaned using RBS™ 50 cleaning solution (5%), 10% HNO3, and deionized water, and blank discs were regularly tested for contamination.
Phase #1: Method Development
Method development is an iterative process, and here we summarize key steps taken while reserving greater details to the Supporting Information (S4–S6). We based the current method on our past study that measured levels of copper, selenium, and zinc in DBS using TXRF (Pawly et al., 2019) with some slight modifications. Aforementioned whole blood reference materials were pipetted (60 μL) onto Whatman® 903 protein saver cards (hereafter, filter paper) to realize lab-based DBS samples. Our studies focused on the analysis of one circle of a DBS sample (60 μL blood) or 3 mm diameter punches (3.1 μL blood, based on Li and Lee, 2014) added to a 1.5 mL microcentrifuge tube. We evaluated digestion solutions (high purity 65% HNO3 and a combination of HNO3 and 30% H2O2) and settled upon the mixture of HNO3 and H2O2 (Supplementary figure S1). A range of digestion times (30 – 90 min range) and temperatures (90 – 165 ° C range) were tested, and we settled upon a 45 min digestion at 130 ° C. The digested samples were evaporated to dryness and taken up with 6 N HCl, following which they were heated for 15 min at 120 °C. At this stage, the internal standard was added to ensure that it bound to the sample matrix. We evaluated the performance of three internal standards (Ga, Ni, and Sr) previously studied for TXRF-based analysis of Pb (Silva et al., 2013; Stosnach, 2009; Martinez et al., 2004, Bounakhla, 2003), and decided upon the use of Ni at a final concentration of 150 ppb (Supplementary figure S2). As previous studies (including our own pilot efforts) have shown that the relatively high iron levels in blood interfere with TXRF-based detection of some elements (Prangue, 1989; Khunder, 2006), we included Methyl Isobutyl Ketone (MIBK) to the digested samples to extract out the iron (more details on the extraction process are in Supporting information S5). After iron extraction, an 8–10 μL aliquot of the aqueous phase was pipetted onto acrylic discs which were then heated at 55 °C on a hot plate until the sample dried. The Pb concentrations in the dried sample were then analyzed by TXRF applying a measuring time of 1,000 seconds. Operational conditions of the TXRF were based on our past study of copper, selenium, and zinc in DBS (Pawly et al., 2019) and updated with additional suggestions by Riaño et al (2016).
Phase #2: Method Validation
Method performance was evaluated following the recommendations of the European Bioanalysis Forum (EBF) on the method validation and analysis of DBS samples, as well as validation criteria outlined by ICH Q2A and Q2B guidelines. The linearity and the working concentration range of the method was evaluated by building a calibration curve using DBS created with the five aforementioned whole blood reference materials that had Pb concentrations spanning from 1 to 50 μg/dL. The calibration curve was generated by linear regression and linearity was assessed by Fisher’s test. The LoDmethod (mean concentration of blanks + 3x SD) and LoQmethod (mean concentration of blanks + 10x SD) were calculated from Pb measurements in blank filter paper treated with sample preparation reagents. Accuracy was determined by measuring Pb in DBS created from the aforementioned blood reference materials. Precision was determined by calculating the percent relative standard deviation % RSD, based on replicate analysis (n=9 separate cards) of the reference materials.
Phase #3: Method Application
The method was applied to characterize Pb concentrations in whole blood and DBS samples in two different groups (members of the McGill University community in Montreal, Canada, and e-waste workers situated in Ghana).
McGill University members
Samples were collected from volunteers (n=40) by a trained health professional at the Mary Emily Clinical Nutritional Research Unit at Macdonald Campus as previously detailed (Santa-Rios et al., 2020). Briefly, DBS samples were stored at ambient conditions in plastic bags, while the whole blood samples were placed at – 80° C until analysis. The IRB (human ethics) approval for this work was obtained from McGill University (A05-M26–16B).
Ghanaian e-waste workers
Samples were collected from e-waste workers (n=41) from Agbogbloshie (Accra, Ghana) as described elsewhere (Srigboh et al., 2016). Collected samples were transported to McGill University where they were stored at −80 °C (whole blood) and room temperature (DBS). The IRB (human ethics) approval for this work was obtained from the Noguchi Memorial Institute for Medical Research at the University of Ghana (IRB00001276) and McGill University (A06-M30–16B).
Data Analysis
Statistical analysis was conducted using Microsoft Excel 2017. All reported Pb concentrations were measured using TXRF unless indicated. For the method development stage, comparisons between the different sample preparation conditions were carried out using unifactorial ANOVA. In addition, we used ANOVAs to assess if the Pb concentrations varied across batch runs. Finally, Bland-Altman plots were constructed to evaluate the agreement between a range of comparisons (e.g., Pb in DBS versus whole blood; measurements in TXRF versus ICP-MS). All figures were generated using R version 3.6.3.
RESULTS AND DISCUSSION
Method Validation
Linearity and working range
The calibration curve relating Pb measurements in DBS created with the five blood reference materials and TXRF count values was linear with a coefficient of determination (r2) greater than 0.997 (Supplementary figure S5). The lower end of this curve (once dilution factors were accounted for) covers relevant blood Pb levels in Canada and the U.S. where recent national surveys estimate mean blood Pb levels to be 0.95 and 1.12 μg/dL, respectively (CHMS, 2017; CDC, 2019). The middle range of this curve spans regulatory guidelines (e.g., the blood Pb intervention level is 5 and 10 ug/dL according to the U.S. CDC and Health Canada, respectively), and the upper range spans a “level of action” where oral chelation therapy may be considered (CLSI, 2013; CDC, 2019).
Lower limits of detection and quantification
The LoD and LoQ of the method were calculated to be 0.28 and 0.69 μg/dL, respectively. These detection limits are relevant for human biomonitoring. For example, from the latest cycle of the CHMS (cycle 5: 2017–2018), blood Pb levels in the 10th percentile of Canadians (aged 3–79 years old) was 0.43 μg/dL (95% CI: 0.36–0.42 μg/dL). These detection limits also compare well technically against established methods such as ICP-MS and Atomic Absorption Spectroscopy (AAS) where Pb detection limits are in the low ppb range (LoD ~0.22–2.4 μg/dL; Supplementary table S1). Moreover, the TXRF-based method we demonstrate here may serve as an alternative to portable Pb analyzers (e.g., LeadCare® has a reported LoD of 3.3 μg/dL), though more comparative research would be necessary to test this assertion.
Accuracy and Precision
In the method validation phase of our study, we characterized analytical accuracy and precision using DBS created with the whole blood reference materials. The overall mean accuracy was 111.1 % (97.0 – 129.7 %) (Table 1). While this overall value met pre-established acceptance criteria (80 – 120 %) from the ICH guidelines, we observed a tendency of overestimation at the lower concentration levels which start to approach the method LoQ (0.69 μg/dL). With additional research on this new method that we introduce here, we expect that improvements in its analytical accuracy may be realized with changes to, for example, optimization of TXRF measurement parameters, testing of different reference materials (especially certified ones from NIST such as SRM 955d), and setting up external calibration curves. For precision, the mean value was 14.9 % (ranged from 9.9 to 19.1 %) (Table 1). This value met the predefined precision acceptance criteria (RSD <15 %) based on ICH Q2A and Q2B.
Table 1.
Analytical accuracy (recovery %) and precision (RSD %) of the method established by analyzing lead (Pb) levels in Whatman® 903 protein saver (filter paper) cards onto which 60 μL of whole blood reference materials were pipetted. Each reference material was independently tested on nine separate cards (n=9).
| Blood reference material ID | Assigned concentration of Pb (μg/dL) | Measured concentration of Pb in DBS (mean ± SD, μg/dL) |
Accuracy (% recovery, min-max in brackets) |
Precision (mean RSD %) |
|---|---|---|---|---|
| PC-B-L1601 | 1.01 | 1.31 ± 0.13 |
129.7% (118.8 – 149.5) |
9.9% |
| QM-B-Q1313 | 4.57 | 5.66 ± 1.08 |
121.2% (99.9 – 156.7) |
19.1% |
| QM-B-Q1505 | 22.99 | 22.24 ± 4.19 |
97.0% (84.2 – 129.9) |
18.8% |
| QM-B-Q1506 | 50.14 | 51.74 ± 6.38 |
103.2% (84.3 – 119.6) |
11.7% |
Concentration of Pb in blank samples
The potential contamination of filter cards intended for DBS research with Pb has been reported as an issue in past studies (Yee, et al., 1997; Chaudhuri, 2009). To increase understanding of the Pb values in the filter cards we used, we analyzed internal blanks along with the samples during the study phase #3. Thus, in ~14% of our samples (i.e., 3 blanks were included in each batch of 22 DBS samples), we determined Pb levels in a full blank circle spot (i.e., filter paper not containing blood) from a card containing a real participant’s DBS sample. From this, we found an average of 0.02 ng (± 0.01) Pb per blank circle spot. These blanks came from filter papers processed in two divergent conditions (i.e., university members sampled in a clinical environment versus workers sampled in a contaminated field setting), and there was no difference in the values. When considering the estimated volume of a whole circle spot to be 60 μL blood, the estimated average concentration of Pb would be 0.03 ± 0.016 μg/dL (ranging from <LoD to 0.01 μg/dL). The correlation of Pb measures in the blank spots and their paired DBS samples was weak (R2= 0.002), and the subtraction of blank Pb levels from the paired DBS sample had no impact of our results. We also note that the blank values are much lower than blood Pb levels of the general population (e.g. CHMS cycle 4 geomean is 0.95 μg/dL) as well as the current study (see further below; e.g., 13-fold and 26-fold lower than the minimum and median values, respectively, among the McGill University members). We thus conclude that the presence of Pb in the filter papers used here are very low and not influencing the results. We note that we performed routine sampling practices in both study locations and did not take significant added steps to try and minimize contamination, which further gives us confidence that background contamination is likely not of major concern.
Method application
For the university members, the mean (±SD) blood Pb level in DBS was 0.78 (± 0.46) μg/dL and ranged from below the detection limit (in 7.5% of the cases) to 2.31 μg/dL (Supplementary table S4). These Pb levels measured in DBS using TXRF did not differ from Pb levels measured in the same person’s venous whole blood sample using ICP-MS (e.g., mean was 0.86 ± 0.46 μg/dL and ranged from 0.39 to 2.35; Supplementary table S4). These values are comparable to the average Canadian (e.g., median blood Pb level was 0.95 μg/dL from CHMS, 2017). In the e-waste workers, the mean (±SD) blood Pb level in the DBS was 3.78 (± 3.01) μg/dL and ranged from 1.79 to 19.67 μg/dL (Supplementary table S4). These blood Pb levels compare well against values previously reported on e-waste workers from the same site (Supplementary table S5).
A key goal of this study was to compare Pb measures in capillary DBS samples using TXRF versus the ‘gold standard’ which is Pb measures in the same person’s venous whole blood using ICP-MS. In general, the comparisons were strong based on correlative analysis for the McGill university members (r2=0.814; y= 0.916 x + 0.013, Figure 1A) and the e-waste workers (r2=0.911; y= 0.974 x + 0.116, Figure 2A).
Figure 1.

(A) Regression line of Pb measurements (μg/dL) in McGill University members comparing same-person capillary DBS samples analyzed by TXRF against venous whole blood samples analyzed by ICP-MS. The 95% confidence band is indicated with dashed lines; (B) Bland-Altman plot of difference (y axis) in Pb measurements (μg/dL) in capillary DBS analyzed by TXRF and venous whole blood analyzed by ICP-MS versus the mean of the two measurements (x axis). The dashed lines indicate the upper LoA, bias, and lower LoA (from the top of the figure to the bottom), and for each parameter the 95% CI are indicated with dotted lines. The blue line represents the proportional bias trend line.
Figure 2.
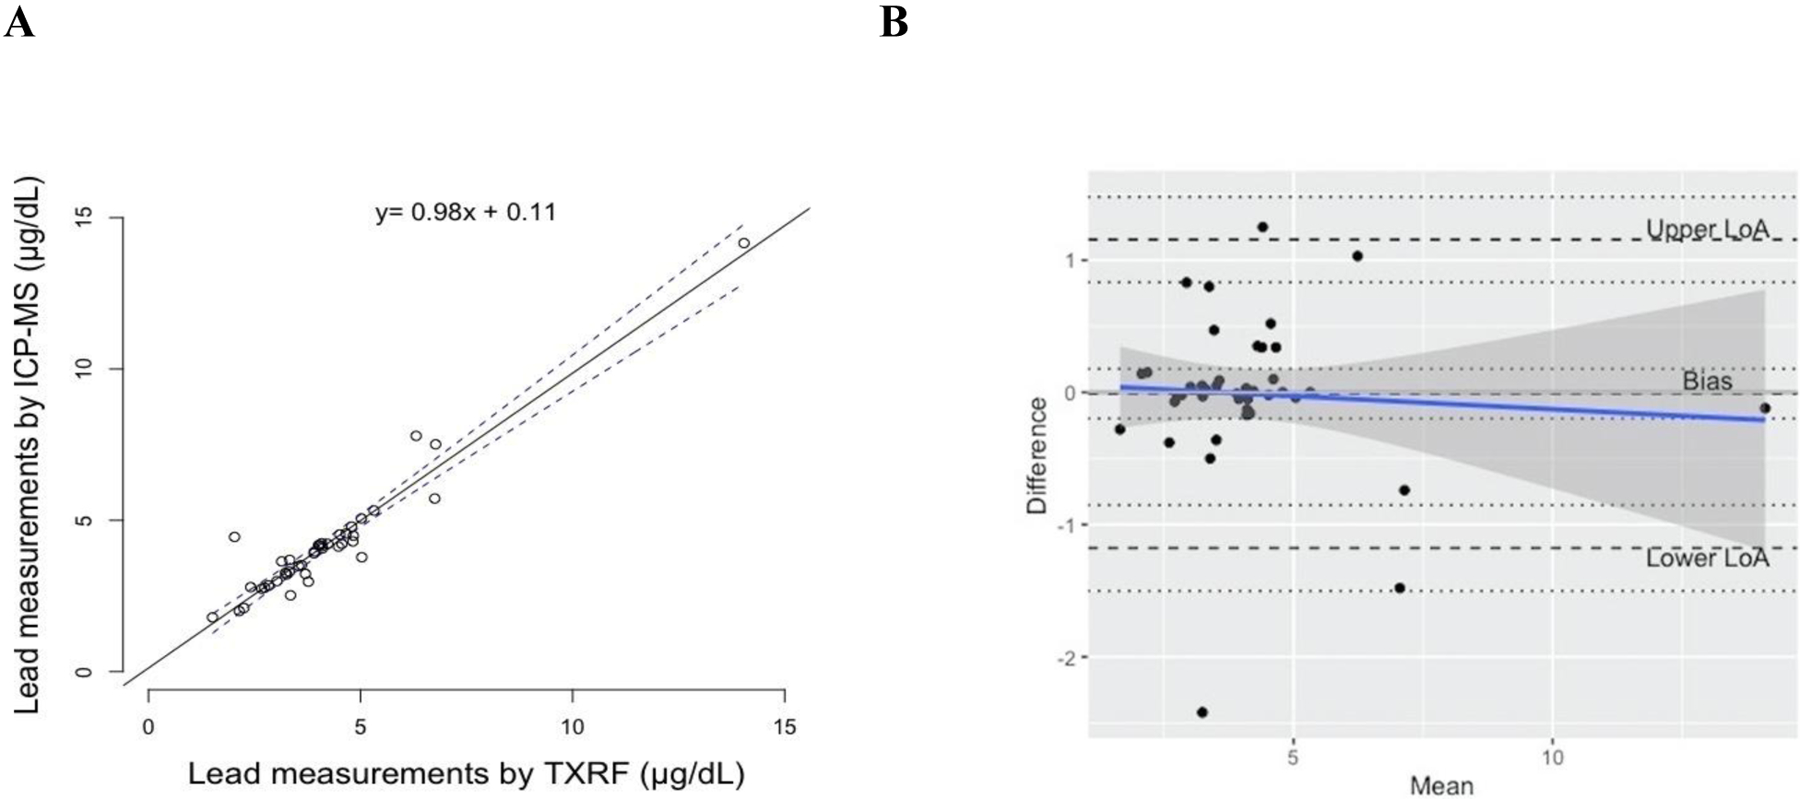
(A) Regression line of Pb measurements (μg/dL) in e-waste workers comparing same-person capillary DBS samples analyzed by TXRF against venous whole blood samples analyzed by ICP-MS. The 95% confidence band is indicated with dashed lines; (B) Bland-Altman plot of difference (y axis) in Pb measurements (μg/dL) in capillary DBS analyzed by TXRF and venous whole blood analyzed by ICP-MS versus the mean of the two measurements (x axis). The dashed lines indicate the upper LoA, bias, and lower LoA (from the top of the figure to the bottom), and for each parameter the 95% CI are indicated with dotted lines. The blue line represents the proportional bias trend line.
To move beyond simple correlations, and determine if there were any systematic differences, Bland-Altman analyses were conducted to assess agreement between the two approaches (Figure 1B and Figure 2B). For the McGill university members, there was not a significant constant bias (intercept of 0.06 μg/dL; 95% CI: 0.00 – 0.13) or proportional bias (slope was −0.01; 95% CI: −0.17 – 0.14) between the two measures. For this group, the lower and upper Limit of Agreement (LoA) were −0.32 (95% CI: −0.43 – −0.21) and 0.45 μg/dL (95% CI: 0.34 – 0.57), respectively, and the range of the LoA was 0.77 μg/dL with two samples falling outside the LoA. For the e-waste workers, there was also no significant constant bias (intercept of −0.01 μg/dL; 95% CI: −0.19 – 0.17) or proportional bias (slope was −0.02; 95% CI: −0.10 – 0.18) between the two measures. For this group, the lower and upper LoA were −1.17 (95% CI: −1.50 – −0.85) and 1.15 μg/dL (95% CI: 0.83 – 1.47), respectively, and LoA range was 2.32 μg/dL with one sample falling outside the LoA. We also combined data from both population groups together (Supplemental figure S6). From this combined analysis, there was no significant constant bias (intercept of 0.02 μg/dL; 95% CI: −0.07 – 0.12) or proportional bias (slope was −0.02; 95% CI: −0.06 – 0.02) between the two measures. The lower and upper LoA were −0.86 (95% CI: −1.03 – −0.68) and 0.91 μg/dL (95% CI: 0.73 – 1.08), respectively, and LoA range was 1.77 μg/dL with three samples falling outside the LoA.
The results from the Bland-Altman plot analyses demonstrate good agreement between the methods across a range of Pb exposures. Of the 81 paired samples tested, 3 of them fell outside the LoA range and had values less than 3 μg/dL. The relevance of the LoA (0.59 μg/dL for the university members and 2.32 μg/dL for the e-waste workers) seems appropriate for biomonitoring activities given that the values fall below regulatory intervention levels (5 and 10 μg/dL blood Pb according to the U.S. CDC and Health Canada, respectively).
Based on past studies in this field (Supplementary Table S1), we had initial concerns about the detection limit among the background exposed group (McGill members) though only 7.5% of the TXRF-based measures of the DBS were below the LoD. None of the samples taken from the e-waste worker fell below the LoD. For the e-waste workers who were sampled from a contaminated field site, we had concerns that sampling in such an environment may lead to external contamination of the filter paper with Pb though as detailed earlier this was not found to be a problem in the current study. This is further supported by the results of the Bland-Altman analyses which show no systematic bias especially constant bias which may have been expected if there was external contamination of the paper. We completed the analysis of samples from both populations across 6 batch runs (3 batch runs each) in ~2 weeks (Supplementary figure S7). We did not find statistical differences (p > 0.001) between real samples batch runs and we did not observe any changes in the precision and accuracy of the method through our inspection of the blood reference materials data.
Conclusion
This study increases our understanding of DBS as a potentially novel approach to characterize Pb exposures in both the general population (in a clinical environment) as well as a highly exposed population (in a resource limited, logistically challenging, contaminated field site). We first developed a method and demonstrated that TXRF analysis of processed DBS filter paper samples yields results that are accurate and precise (when compared to blood reference materials with assigned levels). By purposefully applying the method to study two populations that typify divergent conditions (i.e., background population with relatively low Pb exposures, and e-waste workers with relatively high Pb exposures), we conclude that there is a relatively good agreement between the gold standard of blood Pb measures (i.e., ICP-MS analysis of venous whole blood) with the new method we outline here (i.e., TXRF analysis of capillary DBS).
The TXRF-based method we detail here helps overcome barriers associated with current strategies to measure Pb in DBS (e.g. past studies have paid limited attention to key quality control aspects such as detection limit, accuracy, precision; see Supplementary Table S1).
Further, the TXRF-based method detailed here (compared to ICP-MS) enables the analyses of blood to be completed in a shorter time frame with use of fewer chemical reagents and volumes thus supporting principles of green chemistry (Koel, 2016). To exemplify this, for the e-waste samples discussed in this paper we roughly calculated that measures of Pb in DBS using TXRF were 5-fold quicker (8 hrs versus 56 hrs) and used approximately 50% fewer chemical volumes than the Pb measures in whole blood that were acquired with ICP-MS (see Supplementary Table S6). Moving forward, there is a need to scale-up the use of this method in a range of population-based studies to better understand the opportunities and limitations in terms of adopting the method into routine biomonitoring efforts.
Supplementary Material
Acknowledgments
We acknowledge funding support from the Fonds de Recherche du Québec-Nature et Technologies (FRQNT), the Consejo Nacional de Ciencia y Tecnología (CONACyT), the GEOHealth Program (1R24TW009497) from the Fogarty International Center of the U.S. National Institutes of Health (NIH), the Canada Research Chairs (CRC) program, and the Canada Foundation for Innovation. For the e-waste study, we thank the Greater Accra Scrap Dealers Association, as well as the study participants. For the McGill study, we thank the staff at the Mary Emily clinic, particularly Catherine Vanstone, as well as Andrea Santa-Ríos and Jessica Pawly for sample collection, and the study participants. Finally, we thank Jenny Eng for technical support, and Drs. Jonathan Chevrier, Melissa McKinney, and Aaron Specht for the constructive feedback on the project.
Footnotes
Conflict of Interest Declaration
The authors declare no conflict of interest
Supporting Information
SupportingInformation.docx
S1. Analysis of Pb in DBS; S2. Analysis of Blood Pb by TXRF; S3. Whole blood reference materials; S4. Supplementary details on the development of the method – digestion and accuracy; S5. Supplementary details on the development of the method – iron extraction; S6. Supplementary details on the development of the method - linearity; S7. Blood lead levels in the two study population groups; S8. Blood lead levels in studies of E-waste workers from Agbogbloshie, Ghana; S9. Resource comparison between ICP-MS analysis of whole blood and TXRF analysis of DBS.
References
- Ask KS, Øiestad EL, Pedersen-Bjergaard S, & Gjelstad A (2018). Dried blood spots and parallel artificial liquid membrane extraction–A simple combination of microsampling and microextraction. Analytica Chimica Acta, 1009, 56–64. [DOI] [PubMed] [Google Scholar]
- Abu-Rabie P, Denniff P, Spooner N, Chowdhry BZ, & Pullen FS (2015). Investigation of different approaches to incorporating internal standard in DBS quantitative bioanalytical workflows and their effect on nullifying hematocrit-based assay bias. Analytical Chemistry, 87(9), 4996–5003. [DOI] [PubMed] [Google Scholar]
- Amankwaa EF, Tsikudo KAA, & Bowman JA (2017). ‘Away’is a place: The impact of electronic waste recycling on blood lead levels in Ghana. Science of the Total Environment, 601, 1566–1574. [DOI] [PubMed] [Google Scholar]
- Agency for Toxic Substances and Disease Registry. (2017). ATSDŔs substance priority list. U.S. Department of Health and Human Services,. Available at: www.atsdr.cdc.gov/SPL (Accessed: 16 August 2019). [Google Scholar]
- Bilo F, Borgese L, Cazzago D, Zacco A, Bontempi E, Guarneri R, & Depero LE (2014). TXRF analysis of soils and sediments to assess environmental contamination. Environmental Science and Pollution Research, 21(23), 13208–13214. [DOI] [PubMed] [Google Scholar]
- Bounakhla M, Doukkali A, Lalaoui K, Aguenaou H, Mokhtar N, & Attrassi B (2003). Determination of some heavy metals (Fe, Cu, Zn and Pb) in blood by total reflection X-ray fluorescence. Journal de Physique IV (Proceedings), 107, 203–206. [Google Scholar]
- Canadian Health Measurement Survey. (2017). Fourth Report on Human Biomonitoring of Environmental Chemicals in Canada, cycle 4 (2014–2015). Available at: https://www.canada.ca/en/health-canada/services/environmental-workplace-health/reports-publications/environmental-contaminants/fourth-report-human-biomonitoring-environmental-chemicals-canada.html. (Accessed: 22 August 2019).
- Caravanos J, Clark E, Fuller R, & Lambertson C (2011). Assessing worker and environmental chemical exposure risks at an e-waste recycling and disposal site in Accra, Ghana. Journal of Health and Pollution, 1(1), 16–25. [Google Scholar]
- Centers for Disease Control and Prevention. (2019). Fourth Report on Human Exposure to Environmental Chemicals, Updated Tables. Atlanta, GA: U.S. Department of Health and Human Services, Centers for Disease Control and Prevention. Available at: https://www.cdc.gov/exposurereport/ (Accessed: 22 August 2019) [Google Scholar]
- Cernik AA, & Sayers MHP (1971). Determination of lead in capillary blood using a paper punched disc atomic absorption technique: Application to the supervision of lead workers. Occupational and Environmental Medicine, 28(4), 392–398. [DOI] [PMC free article] [PubMed] [Google Scholar]
- Chaudhuri SN, Butala SJ, Ball RW, & Braniff CT (2009). Pilot study for utilization of dried blood spots for screening of lead, mercury and cadmium in newborns. Journal of Exposure Science and Environmental Epidemiology, 19(3), 298. [DOI] [PubMed] [Google Scholar]
- Clinical and Laboratory Standards Institute (CLSI). (2013). Guidelines #C40: Measurement Procedures for the Determination of Lead Concentrations in Blood and Urine, 2nd Edition (October 2013). [Google Scholar]
- Demirev PA (2013). Dried blood spots: analysis and applications. Analytical Chemistry, 85(2), 779–789. [DOI] [PubMed] [Google Scholar]
- Dhara S, Misra NL, Thakur UK, Shah D, Sawant RM, Ramakumar KL, & Aggarwal SK (2012). A total reflection X-ray fluorescence method for the determination of chlorine at trace levels in nuclear materials without sample dissolution. X-Ray Spectrometry, 41(5), 316–320. [Google Scholar]
- D’souza HS, Menezes G, & Venkatesh T (2002). Screening for lead poisoning in urban school children of southern India using capillary and venous blood samples. Indian Journal of Clinical Biochemistry, 17(1), 1–4. [DOI] [PMC free article] [PubMed] [Google Scholar]
- Ettinger AS, Leonard ML, & Mason J (2019). CDC’s Lead Poisoning Prevention Program. Journal of Public Health Management and Practice, 25 Suppl 1, S5–S12. [DOI] [PMC free article] [PubMed] [Google Scholar]
- International Conference on Harmonisation (I.C.H). (2005). Validation of analytical procedures: text and methodology Q2 (R1). Geneva, Switzerland: (Vol. 11). [Google Scholar]
- Health Canada. (2019). Toxic substances list. Canadian Environmental Protection Act Registry, Health Canada. Available at: www.canada.ca/en/environment-climate-change/services/canadian-environmental-protection-act-registry/substances-list/toxic (Accessed: 16 August 2019)
- Koel M (2016). Do we need green analytical chemistry? Green Chemistry, 18(4), 923–931. [Google Scholar]
- Kubala-Kukuś A, Banaś D, Majewska U, Stabrawa I, Wudarczyk-Moćko J, & Góźdź S (2016). Determination of lead at physiological level in human biological materials using the total reflection X-ray fluorescence analysis. X-Ray Spectrometry, 45(6), 318–324. [Google Scholar]
- Khuder A, Karjou J, & Sawan MK (2006). Determination of some trace elements in biological samples using XRF and TXRF techniques (No. AECS-C/RSS--690). Atomic Energy Commission. [Google Scholar]
- Lehner AF, Rumbeiha W, Shlosberg A, Stuart K, Johnson M, Domenech R, & Langner H (2013). Diagnostic analysis of veterinary dried blood spots for toxic heavy metals exposure. Journal of Analytical Toxicology, 37(7), 406–422 [DOI] [PubMed] [Google Scholar]
- Li W & Lee MS (2014). Dried Blood Spots Wiley Series on Pharmaceutical Science and Biotechnology: Practices, Dried Blood Spots- Applications and Techniques. John Wiley & Sons, Hoboken, New Jersey. [Google Scholar]
- Martinez T, Lartigue J, Avila-Perez P, Zarazua G, Cabrera L, Tejeda S, & Ramirez A (2004). Determination of lead in blood by TXRF and its correlation to environmental lead. Nuclear Instruments and Methods in Physics Research Section B: Beam Interactions with Materials and Atoms, 213, 584–589. [Google Scholar]
- Nys G, Kok MG, Servais AC, & Fillet M (2017). Beyond dried blood spot: current microsampling techniques in the context of biomedical applications. TrAC Trends in Analytical Chemistry, 97, 326–332. [Google Scholar]
- Pawly J, Neitzel RL, & Basu N (2019). Analysis of copper, selenium, and zinc in newborn dried bloodspots using total reflection X-ray fluorescence (TXRF) spectroscopy. PeerJ Analytical Chemistry, 1, e1. [Google Scholar]
- Pedersen L, Andersen-Ranberg K, Hollergaard M, & Nybo M (2017). Quantification of multiple elements in dried blood spot samples. Clinical Biochemistry, 50(12), 703–709. [DOI] [PubMed] [Google Scholar]
- Prange A, & Schwenke H (1991). Trace element analysis using total-reflection X-ray fluorescence spectrometry. Advances in X-Ray Analysis, 35, 899–923. [Google Scholar]
- Riaño S, Regadío M, Binnemans K, & Vander Hoogerstraete T (2016). Practical guidelines for best practice on Total Reflection X-ray Fluorescence spectroscopy: Analysis of aqueous solutions. Spectrochimica Acta Part B: Atomic Spectroscopy, 124, 109–115. [Google Scholar]
- Santa-Rios A, Barst BD, & Basu N (2020). Mercury speciation in whole blood and dried blood spots from capillary and venous sources. Analytical Chemistry, 92(5), 3605–3612. [DOI] [PubMed] [Google Scholar]
- Savage I, & Haswell SJ (1998). The development of analytical methodology for simultaneous trace elemental analysis of blood plasma samples using total reflection X-ray fluorescence spectrometry. Journal of Analytical Atomic Spectrometry, 13(10), 1119–1122. [Google Scholar]
- Schlenker TL, Fritz CJ, Mark D, Layde M, Linke G, Murphy A, & Matte T (1994). Screening for pediatric lead poisoning: comparability of simultaneously drawn capillary and venous blood samples. Jama, 271(17), 1346–1348. [DOI] [PubMed] [Google Scholar]
- Silva N, Senanayake H, & Waduge V (2013). Elevated levels of whole blood nickel in a group of Sri Lankan women with endometriosis: a case control study. BMC research notes, 6(1), 13. [DOI] [PMC free article] [PubMed] [Google Scholar]
- Spooner N, Lad R, & Barfield M (2009). Dried blood spots as a sample collection technique for the determination of pharmacokinetics in clinical studies: considerations for the validation of a quantitative bioanalytical method. Analytical Chemistry, 81(4), 1557–1563. [DOI] [PubMed] [Google Scholar]
- Srigboh RK, Basu N, Stephens J, Asampong E, Perkins M, Neitzel RL, & Fobil J (2016). Multiple elemental exposures amongst workers at the Agbogbloshie electronic waste (e-waste) site in Ghana. Chemosphere, 164, 68–74. [DOI] [PMC free article] [PubMed] [Google Scholar]
- Stosnach H, & Mages M (2009). Analysis of nutrition-relevant trace elements in human blood and serum by means of total reflection X-ray fluorescence (TXRF) spectroscopy. Spectrochimica Acta Part B: Atomic Spectroscopy, 64(4), 354–356. [Google Scholar]
- Timmerman P, White S, Globig S, Lüdtke S, Brunet L, Smeraglia J, & Contributors, other EBF member companies listed at end of article. (2011). EBF recommendation on the validation of bioanalytical methods for dried blood spots. Bioanalysis, 3(14), 1567–1575. [DOI] [PubMed] [Google Scholar]
- Towett EK, Shepherd KD, & Cadisch G (2013). Quantification of total element concentrations in soils using total X-ray fluorescence spectroscopy (TXRF). Science of the Total Environment, 463, 374–388. [DOI] [PubMed] [Google Scholar]
- Velghe S, Delahaye L, & Stove CP (2018). Is the hematocrit still an issue in quantitative dried blood spot analysis? Journal of Pharmaceutical and Biomedical Analysis. [DOI] [PubMed] [Google Scholar]
- Viksna A, Selin Lindgren E, Kjellmer I, & Bursa J (2002). Analysis of whole blood and placenta—a case study of mothers and their babies. Journal of Trace and Microprobe Techniques, 20(4), 553–564. [Google Scholar]
- Wittsiepe J, Feldt T, Till H, Burchard G, Wilhelm M, & Fobil JN (2017). Pilot study on the internal exposure to heavy metals of informal-level electronic waste workers in Agbogbloshie, Accra, Ghana. Environmental Science and Pollution Research, 24(3), 3097–3107. [DOI] [PubMed] [Google Scholar]
- World Health Organization. (2010). Preventing health disease through healthy environments. Geneva, World Health Organization. Available at: https://www.who.int/ipcs/features/10chemicals (Accessed: 16 August 2019) [Google Scholar]
- Yee HY, & Holtrop TG (1997). An improved capillary blood-filter paper-graphite furnace atomic absorption spectrometric method for lead screening. Journal of Analytical Toxicology, 21(2), 142–148. [DOI] [PubMed] [Google Scholar]
Associated Data
This section collects any data citations, data availability statements, or supplementary materials included in this article.