Intravoxel incoherent motion (IVIM) theory in MRI was proposed by Le Bihan et al. in 1986 to account for the effect of vessel/capillary perfusion on the aggregate diffusion weighted MR signal. The fast component of diffusion is related to micro-perfusion, whereas the slow component is linked to molecular diffusion. Three parameters can be computed. Dslow (or D) is the diffusion coefficient representing the slow ‘pure’ molecular diffusion (unaffected by perfusion). The perfusion fraction (f or PF) represents the fraction of the compartment related to (micro)circulation, which can be understood as the proportional ‘incoherently flowing fluid’ (i.e., blood) volume. Dfast (or D*) is the perfusion-related diffusion coefficient representing the incoherent microcirculation within the voxel, which holds information for blood perfusion’s speed. The diffusion weighted image signal is prevalently modelled by a biexponential decay function [1]:
| [1] |
where SI(b) and SI(0) denote the image signal intensity acquired with the b-factor value of b and b=0 s/mm2, respectively.
In addition to intense research activities, a recent survey suggested IVIM has been applied in clinical practice in a small portion of institutions (1,2).
Recently we reported that, for the liver, IVIM modeling of the perfusion component is constrained by the diffusion component, and a reduced Dslow measure leads to artificially higher PF and Dfast measures (3). In this study of 26 male volunteers (age: 22–69 years) and 36 female volunteers (age: 20–71 years), we demonstrated an age-dependent liver Dslow decline, which is expected to be caused by an age-dependent iron deposition increase, an age-dependent fat deposition increase, and also a reduction of vasculature in the healthy aging livers. The age-dependent reduction in liver blood flow has been well documented using a variety of technical methods including histology, dye dilution, and indicator clearance (4-6). Using an MRI based micro-perfusion volume biomarker diffusion-derived vessel density (DDVD) (7,8), we also observed age-dependent DDVD decline. However, the observed PF and Dfast results gave contradictory results compared with DDVD and known vessel physiology of the liver aging, with both PF and Dfast measures showed age-dependent elevation. This was observed when we used segmentation fitting or full fitting, and observed when we performed bi-exponential decay fitting included or excluded b=0 data (3). We concluded that the quantification of both PF and Dfast is constrained by Dslow, i.e., lower Dslow leads to higher PF and Dfast measurements, even PF and Dfast did not increase or even declined. Our point is further supported by literature analysis that liver steatosis IVIM studies show a decreased Dslow and an artificially elevated PF (9). Despite the limited sample size, in the brain, a reduction of PF leads to an artificial elevation of Dslow measure and an elevation of PF leads to an artificial lowering of Dslow measure is illustrated by the example of McKinstry et al. (10). By moderating arterial carbon dioxide pressure (PaCO2), McKinstry et al. (10) induced brain grey matter perfusion changes in three dogs. The results show, under various PaCO2, PF and D changed toward the opposition directions (Figure 1). This constrain is not absolute. For example, acute cerebral stroke can cause the reduction of all PF, Dslow, and Dfast in the ischemic core (11,12), thus being all proportionally smaller. Overall, we observed that, according to the published IVIM data, if one component’s measure, being that of perfusion component or diffusion component, changes toward one direction (i.e., increase or decrease), the other component’s measure is constrained to change toward the opposite direction. In this letter, I discuss some clinical data of liver IVIM imaging which substantiate this observation, and postulate one of the possible causes for this paradox.
Figure 1.
Variations in Dslow and PF following the changes of PaCO2. Under various PaCO2, PF and Dslow changed toward the opposition directions. In this study, segmented fitting was applied, and PF is considered to change initially. PaCO2: arterial carbon dioxide pressure (unit in torr). Adapted from reference (10).
Figure 2 shows PF and Dslow measures in 18 young healthy volunteers (mean ± SD: 24.1±3.2 yrs; range, 18–31 years) (13). A moderate and close to statistically significant negative correlation is observed between Dslow and PF (Figure 2A). If males and females subjects are separated, this negative correlation trend can be still observed (Figure 2B,C). In the study by Riexinger et al. (14) investigating the 1.5 T vs. 3T field strength’s effect on IVIM quantification with 20 healthy volunteers (age: 19–28 years) and an extensive array of 24 b-values: 0.2, 0.4, 0.7, 0.8, 1.1, 1.7, 3, 3.8, 4.1, 4.3, 4.4, 4.5, 4.9, 10, 15, 20, 30, 50, 60, 90, 95, 150, 180 and 500 s/mm2, they reported liver Dslow= 1.22/1.00 ×10-3mm2/s at 1.5/3T, PF = 0.286/0.303 at 1.5/3T, thus also showing 1.5T scanner’s results had higher Dslow and lower PF, while 3.0T scanner’s results had lower Dslow and higher PF. It is possible that the results of Riexinger et al.’s study also suggests a trend of mutual constraining of diffusion measure and perfusion measure.
Figure 2.
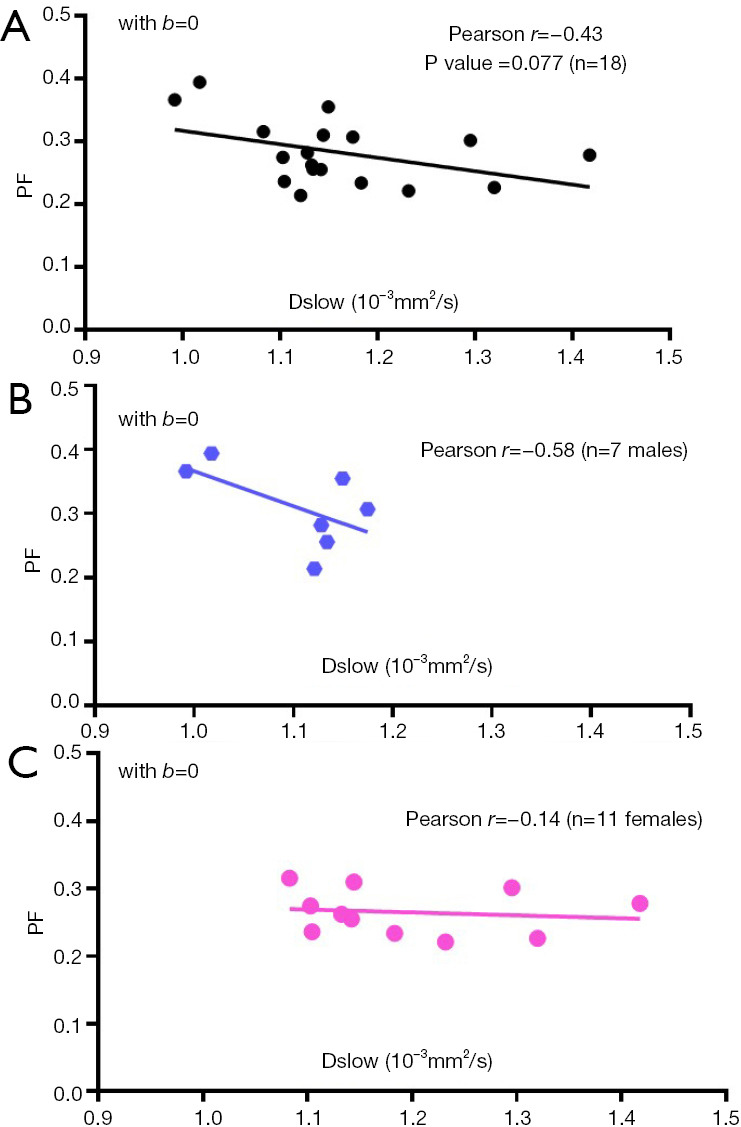
Measured correlations between PF and Dslow in 18 young healthy volunteers. The data are from reference (13). To only look at the measures of young subjects, two volunteers aged 38 yrs (male) and 58 yrs (female) respectively are not included. (A) data with bi-exponential fitting included b=0 data. (B) data for male subjects only. (C) data for female subjects only. Images were acquired at 3T with 16 b-values of 0, 2, 5, 10, 15, 20, 25, 30, 40, 60, 80, 100, 150, 200, 400, and 600 s/mm2, and analyzed by segmented fitting with threshold b-value of 60 s/mm2.
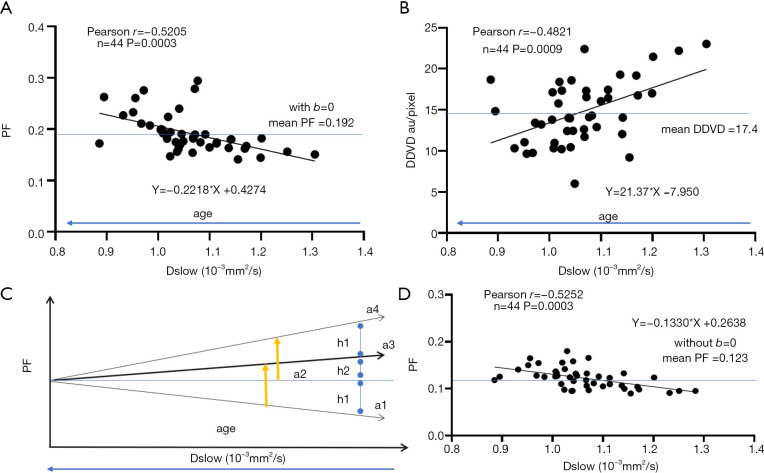
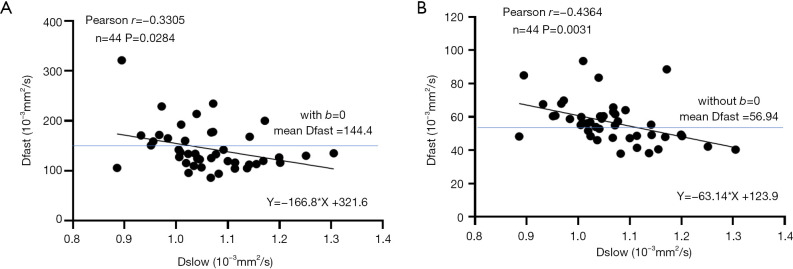
We can make a simplistic estimation on how much measured PF can be artificially elevated if Dslow is truly decreased by 10%. We use the data from Huang et al.’s study (3), and we only choose those of very clean and good quality, i.e., those had two good quality IVIM scans and we were able to use the mean values from these two scans, which included 17 healthy men and 27 healthy women. We assume age of the subjects is the initial independent variable, and physiologically aging causes both Dslow and PF to decrease (3). We make a plot to study the relationship between Dslow and PF (Figure 3A). We then assume Dslow is the independent variable and PF is the dependent variable. The mean Dslow is 1.06×10⁻³ mm2/s in this study (Dslow value is the same for the analyses included or excluded b=0 data). If PF is stable across different age groups (i.e., without aging interference), then a 10% reduction of Dslow (i.e., a decrease of X in the linear fitting formula by 0.1) causes 11.6% artificial increase of PF (i.e., an increase of Y in the linear fitting formula by 0.022). In the case here, Dslow can also be considered as a surrogate of age, with older age associated with lower Dslow value (3). In the study of Huang et al. (3), we used DDVD as a micro-perfusion volume biomarker, and demonstrated an aging related reduction of DDVD. Figure 3B shows, a 10% reduction of Dslow (i.e., a decrease of X in the linear fitting formula by 0.1) cause 12.3% reduction of micro-perfusion volume biomarker DDVD (i.e., a reduction of Y in the linear fitting formula by 2.14). For the results seen in Figure 3A, it can be considered that, besides the apparent observed PF reduction, the real PF has already been additionally suppressed by the scale of 12.3% per 10% reduction of Dslow due to aging. Thus, 10% Dslow decrease causes 23.9% (=11.6% + 12.3%, 23.9% of the original PF value) artificial increase of measured PF (see Figure 3C). Figure 3D shows IVIM analysis without b=0 data. In this case (3D), a 10% reduction of Dslow (i.e., a decrease of X in the linear fitting formula by 0.1) causes 10.8% observed artificial increase of PF (i.e., an increase of Y in the linear fitting formula by 0.013), which is similar to the result with b=0 data included in the analysis (Figure 3A). The same estimation can be made for the relationship between Dslow and Dfast (Figure 4). Figure 4A shows, a 10% reduction of Dslow (i.e., a decrease of X in the linear fitting formula by 0.1) causes 11.6% observed increase of Dfast (i.e., an increase of Y in the linear fitting formula by 16.7). Figure 4B shows, a 10% reduction of Dslow (i.e., a decrease of X in the linear fitting formula by 0.1) causes 11.1% observed increase of Dfast (i.e., an increase of Y in the linear fitting formula by 6.3). We consider PF and DDVD are perfusion (blood) volume biomarkers, and Dfast as a perfusion (blood flow) speed biomarker. Though smaller vessel diameters can hinder blood flow speed, it is more likely that, in the data of the study of Huang et al. (3), with aging blood flow speed did not change substantially, and the observed Dfast elevation due to aging is more of an artifact due to the reduced Dslow. Guiu et al. (15) reported mean measured Dslow values in steatotic livers (n=40) and nonsteatotic livers (n=68) were 1.03 (±0.23) and 1.24 (±0.15) ×10-3mm2/s respectively, while mean measured PF values in steatotic livers and nonsteatotic livers were 0.33 (±0.09) and 0.27 (±0.09) respectively. From the Figure 3 in Guiu et al.’s study (15), we can assume their steatotic livers had on average 13% more fat content than the non-steatotic livers, and if we assume pure fat tissue requires little perfusion (16), then according to the data of Guiu et al., a 10% reduction of Dslow may lead to a 18% PF elevation. If the patients with steatotic livers were older than the patients with non-steatotic livers (which is likely to be true), then a 10% reduction of Dslow may lead to >18% PF elevation. Therefore, magnitude of PF artificial elevation in the data of Guiu et al. seems to agree with our estimation for our own data. We reviewed the published results on IVIM-derived PF of steatotic livers. Most of papers reported elevated PF (9), a small portion of papers (17) reported PF similar to normal liver which also indicate PF was artificially elevated since steatotic livers should have reduced true PF.
Figure 3.
Approximate estimation of Dslow induced PF elevation. The data are from the study published in reference (3). The equations denote the linear fit of the data. (A) correlation between Dslow and PF computed included b=0 data. (B) correlation between Dslow and DDVD. DDVD used here is the mean of DDVD(b0b2) and DDVD(b0b10). DDVD(b0b2) refers to the liver parenchyma signal difference between b=0 and b=2 s/mm2 images, with signal of visible vessels removed. DDVD(b0b10) refers to the liver parenchyma signal difference between b=0 and b=10 s/mm2 images, with signal of visible vessels removed. (C) illustration. Blue line-a2 assumes no change in PF along aging, if so, a reduction of Dslow along aging elevates line-a2 to line-a4. Line-a1 indicates actual reduction of perfusion along aging; in this case, a reduction of Dslow along aging elevates line-a1 to line-a3. Line-a3 is thus the observed result, which is elevated by the magnitude of h1+h2. (D) correlation between Dslow and PF with PF computed without b=0 data. au: arbitrary unit. DDVD, diffusion derived vessel density.
Figure 4.
Estimation of observed Dfast elevation following Dslow reduction. The data are from the study published in reference (3). (A) contains values derived from analysis including b=0 data. (B) contains values derived from analysis excluding b=0 data. The equation denotes the linear fit of the data.
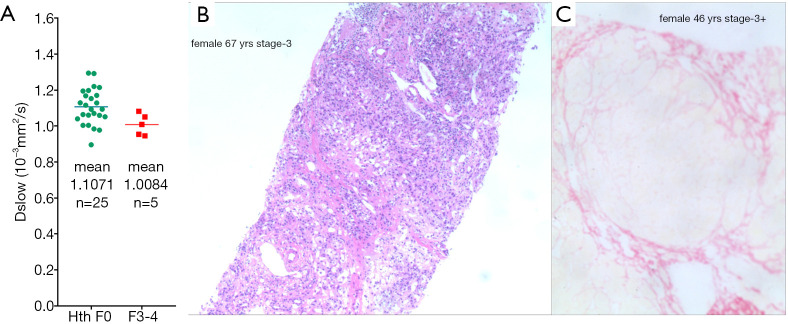
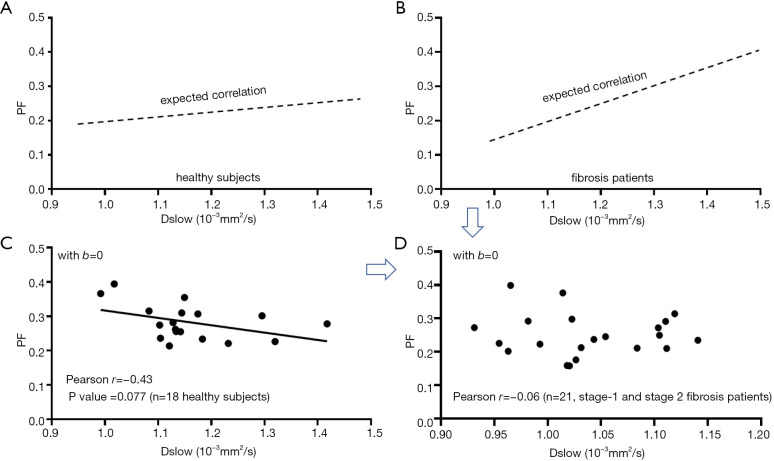
In liver fibrosis, it is generally reported PF is the most sensitive biomarker, Dfast is more difficult to be qualified accurately (18,19). Despite Dslow can be measured with high reproducibility, it is considered being not sensitive to fibrotic change. Luciani et al. (20) compared 25 healthy liver cases and 12 cirrhotic liver cases with similar age and gender mixing, despite the patients had METAVIR score F4 liver cirrhosis, they obtained similar Dslow values for healthy livers [(1.10±0.7)×10-3 mm2/s] and cirrhotic livers [(1.19±0.5) ×10-3 mm2/s, P>0.05]. Our own published results also showed Dslow values of METAVIR score F3-4 fibrotic livers could overlap with those of the healthy young livers (13,21,22) (Figure 5). This is puzzling considering the very substantial liver histopathological changes associated with cirrhosis. Figure 6 shows the mutual constraining of Dslow measure and PF measure in cirrhotic livers. We believe that Dslow measure was promoted in fibrotic livers due to the decreased perfusion measure (Figure 7), published IVIM data are insensitive to slow diffusion restriction associated with fibrosis. In fact, since a true lowering of Dslow can induce artificial elevation of PF, and a true lowering of PF can induce artificial elevation of Dslow, it is possible for the published IVIM liver fibrosis studies, the magnitudes of reduction for PF and Dslow have been both underestimated.
Figure 5.
A comparison of Dslow measure of young healthy livers (Hth-F0) and middle-aged/elderly subjects’ stage-3/4 fibrotic livers (F3-4). Data are from reference (22). There are 25 young healthy subjects (mean age: 23.2 yrs, range: 20–29 yrs; 14 men males, 11 women), with one female volunteer of 41 yrs old not included. There are four stage-3 liver fibrosis patients (Male/59 yrs, Male/62 yrs, Female/46 yrs, Female/67 yrs) and one stage-4 liver fibrosis patient (Male/60 yrs). As the patients were older than the healthy subjects, the patients are expected to have lower liver Dslow measure. (A) shows, though the mean Dslow of the patients is lower than that of the healthy subjects, individually still the patient’ values overlap with the normal Dslow range. (B) is a histological image of a stage-3 fibrosis liver (HE staining, original magnification ×100). (C) is a histological image of a stage-(3+) fibrosis liver (Sirius staining, original magnification ×100). Considering the substantial structural changes of the stage-3, stage-4 fibrotic livers, it is unlikely the true Dslow measure of these livers would be normal. We consider Dslow measure was artificially promoted in these patients. Note that, we paid high attention to ensure the quality of data fitting for IVIM measures.
Figure 6.
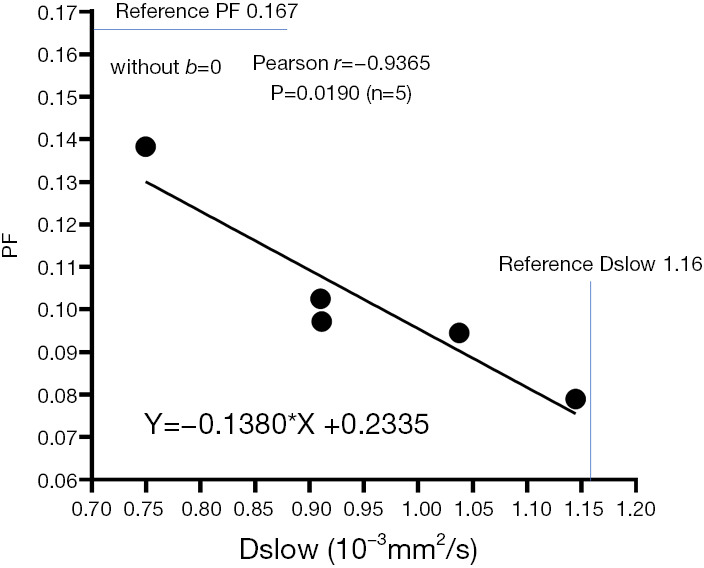
Relationship between Dslow and PF in five stage-4 cirrhotic livers. Data are from reference (13). A very strong negative correlation is observed between Dslow and PF (r=−0.94). The equation denotes the linear fit of the five data points. The reference values are those of young healthy subjects. Data acquisition and analysis are the same as in Figure 7.
Figure 7.
Expected and measured correlations between PF and Dslow. The measured data are from reference (13). Images were acquired at 3T with 16 b-values of 0, 2, 5, 10, 15, 20, 25, 30, 40, 60, 80, 100, 150, 200, 400, and 600 s/mm2, and analyzed by segmented fitting with threshold b-value of 60 s/mm2. (A) Expected correlation between PF and Dslow in healthy subjects. PF and Dslow are weakly and positively correlated, due to perfusion’s contribution to slow diffusion measurement. (B) Expected correlation between PF and Dslow in patients. Due to perfusion’s contribution to slow diffusion measurement and that more severe fibrotic changes would induce lower PF and Dslow than those of milder fibrotic changes, thus PF and Dslow are more positively correlated than that in (A). (C) Measured negative correlation between PF and Dslow in healthy subjects (the same of Figure 2A). (D) Measured results of PF and Dslow in 21 cases of stage-1 and stage-2 liver fibrosis patients (b=0 data included for analysis). It can be explained that the interaction of the mechanism in (B) and the mechanism in (C) resulted in no correlation observed with the measured data in (D) for patients. The data suggest Dslow measure might have been artificially promoted in these fibrotic livers in (D).
Our analysis will have implications in interpreting IVIM data of other organs and pathologies as well. For example, in the cases of tumor characterization by IVIM, most malignant tumors have low diffusion (due to higher cellularity etc.), this will lead to their IVIM derived perfusion can ‘always’ be high as PF is artificially promoted due to low Dslow. On the other hand, since malignant tumors tend to have high blood perfusion and therefore high PF, their Dslow will be ‘always’ measured lower (the opposite to the scenario in liver fibrosis). However, the points discussed here do not necessarily disapprove the clinical usefulness of the current IVIM analysis approach. Examples (23-28), including those of our own (13,21,22), demonstrated the value of IVIM metrics as useful approximations in some scenarios (but not in all scenarios). However, our analysis highlights the importance of a combined analysis of all IVIM parameters (8,21) and validating IVIM measures with other imaging or non-imaging measures. In the latter regard, many encouraging results, though not very strong correlation, have been reported. For example, Togao et al. (29) evaluated PF in a comparison with histological immunostainted vascular density (%Vessel) in 29 consecutive meningiomas. The 90-percentile PF-value and average PF in the tumor had significant correlations (r=0.69, P<0.0001; r=0.82, P<0.0001) with the %Vessel of the tumors. Lee et al. (30) reported 25 nude mice with HT29 colorectal cancer cells implantation had IVIM-MRI and histological micro-vessel density (MVD) assessment, Spearman’s rank correlation with MVD was 0.782 (P<0.001) for Dfast, and 0.749 (P<0.001) for PF. Luo et al. (31) studied 35 male Sprague–Dawley rats induced with 106 cirrhosis-related nodules and reported moderate negative correlations between Dslow and cell density (r=–0.624, P<0.01). Wirestam et al. (32) correlated brain IVIM parameters with dynamic susceptibility-contrast MRI (cerebral blood volume and flow, CBV and CBF) in 28 volunteers. They demonstrated a moderate and significant correlation between PF and CBV (r=0.56, P<0.001). Federau et al. (33) acquired IVIM parameters in 21 brain gliomas, reported that PF correlated moderately with dynamic susceptibility contrast relative CBV (r=0.59). Mayer et al. (34) studied IVIM and CT perfusion in 19 cases of pancreatic ductal adenocarcinoma, with the CT perfusion parameters blood flow (BF) and blood volume (BV) estimated. In ten patients, intra-tumoral MVD and microvessel area (MVA) were analyzed microscopically in resection specimens. For the tumors, PF significantly positively correlated with BF (r=0.668, P=0.002) and BV (r=0.672, P=0.002). There were significant positive correlations between PF and MVD/MVA (r≥0.770, P≤0.009). Correlation coefficients between PF and MVD/MVA were not significantly different from correlation coefficients between BF and MVD/MVA. On the other hand, imperfection correlation or no correlation have also been reported. For example, Patel et al. (35) assessed 30 subjects (16 with noncirrhotic liver, 14 with cirrhosis) with IVIM (n=27) and DCE (dynamic contrast enhanced)-MRI (n=20). They noted no correlation between IVIM and DCE-MRI parameters. Hectors et al. (36) studied 33 HCC lesions with IVIM and DCE-MRI and found no significant correlation between IVIM-DWI and DCE-MRI metrics in HCC lesions. They attribute this due to the predominant portal blood flow in the liver and tortuous microvasculature and tissue heterogeneity in HCC lesions.
High noise level can flatten the signal decay curve particularly at high b-values and lead to reduced Dslow measure (7). We can intuitively postulate the observed mutual constraining of slow component and fast component measures may be partially related to the unavoidable image noises and data imperfection, particularly for echoplanar sequence-based diffusion weighted imaging and for liver imaging which is associated with physiological motions. If we fix the b-value for one b-image and assume SI(0) does not change, the equation-1 can be simplified to: SI(b) in left side of the equation as a dependant variable, PF, Dslow, and Dfast as three independent variables in right side of the equation, and an increase of either one of three IVIM independent variables induces a decrease of SI(b). If PF in the right side of the equation increases by 1 unit (the unit here has no physical meaning), we also assume the true Dslow and true Dfast do not change, then, following the increase of PF, predicted SI(b) in left side of the equation should decreases by 1 unit (the unit here has no physical meaning) accordingly so to maintain the validity of the equation. However, practically, due to image noises which do not change following the change of IVIM parameter, the measured SI(b) may decrease only 0.8 unit (as an example). To maintain the validity of the equation, either Dslow, or Dfast, or both Dslow and Dfast would artificially decrease (for example, both Dslow decrease 0.08 unit and Dfast decrease 0.08 unit respectively), and maybe the measured PF increases only 0.96 unit. Thus, as observed in the study of Huang et al. (3), a true decrease of Dslow induced artificial increase of measured PF and measured Dfast. We expect there will be better agreement between the measured IVIM parameters and true IVIM parameters when noise level is low, and a better quantification of IVIM parameters should consider the image noises.
In pathologies, it is more likely that three IVIM parameters truly change simultaneously. In the ischemic core of an acute cerebral stroke, all PF, Dslow, and Dfast have true reduction. In the case for liver fibrosis, a reduction of perfusion volume and PF can be associated with smaller vessel diameters and more tortuous vessel paths, thus lower blood flow speed and lower Dfast. Further biological studies with animal models to compare noise compensated IVIM measures with other physiological measures will surely be useful. We expect stronger correlation between IVIM measure and other reference measures can be achieved by better IVIM modeling.
Acknowledgments
The author thanks Dr Hua Huang, staff radiologist at the Third People’s Hospital of Shenzhen, Shenzhen, China; Dr Cun-Jing Zheng and Mr Xiao-Ben Heng, research students at the Chinese University of Hong Kong, Hong Kong SAR, for the supports.
Funding: None.
Open Access Statement: This is an Open Access article distributed in accordance with the Creative Commons Attribution-NonCommercial-NoDerivs 4.0 International License (CC BY-NC-ND 4.0), which permits the non-commercial replication and distribution of the article with the strict proviso that no changes or edits are made and the original work is properly cited (including links to both the formal publication through the relevant DOI and the license). See: https://creativecommons.org/licenses/by-nc-nd/4.0/.
Footnotes
Conflicts of Interest: The author has completed the ICMJE uniform disclosure form (available at http://dx.doi.org/10.21037/qims-21-187). Dr. XYJW serves as the Editor-in-Chief of Quantitative Imaging in Medicine and Surgery.
References
- 1.Manfrini E, Smits M, Thust S, Geiger S, Bendella Z, Petr J, Solymosi L, Keil VC. From research to clinical practice: a European neuroradiological survey on quantitative advanced MRI implementation. Eur Radiol 2021. [Epub ahead of print]. doi: . 10.1007/s00330-020-07582-2 [DOI] [PMC free article] [PubMed] [Google Scholar]
- 2.Ljimani A, Caroli A, Laustsen C, Francis S, Mendichovszky IA, Bane O, Nery F, Sharma K, Pohlmann A, Dekkers IA, Vallee JP, Derlin K, Notohamiprodjo M, Lim RP, Palmucci S, Serai SD, Periquito J, Wang ZJ, Froeling M, Thoeny HC, Prasad P, Schneider M, Niendorf T, Pullens P, Sourbron S, Sigmund EE. Consensus-based technical recommendations for clinical translation of renal diffusion-weighted MRI. MAGMA 2020;33:177-95. 10.1007/s10334-019-00790-y [DOI] [PMC free article] [PubMed] [Google Scholar]
- 3.Huang H, Zheng CJ, Wang LF, Che-Nordin N, Wang YX. Age and gender dependence of liver diffusion parameters and the possibility that intravoxel incoherent motion modeling of the perfusion component is constrained by the diffusion component. NMR Biomed 2021;34:e4449. 10.1002/nbm.4449 [DOI] [PubMed] [Google Scholar]
- 4.Zeeh J, Platt D. The aging liver: structural and functional changes and their consequences for drug treatment in old age. Gerontology 2002;48:121-7. 10.1159/000052829 [DOI] [PubMed] [Google Scholar]
- 5.Wynne HA, Cope LH, Mutch E, Rawlins MD, Woodhouse KW, James OF. The effect of age upon liver volume and apparent liver blood flow in healthy man. Hepatology 1989;9:297-301. 10.1002/hep.1840090222 [DOI] [PubMed] [Google Scholar]
- 6.Fiel MI, Deniz K, FElmali F, Schiano TD. Increasing Hepatic Arteriole Wall Thickness and Decreased Luminal Diameter Occur With Increasing Age in Normal Livers. J Hepatol 2011;55:582-6. 10.1016/j.jhep.2010.12.018 [DOI] [PubMed] [Google Scholar]
- 7.Wáng YX. Living tissue intravoxel incoherent motion (IVIM) diffusion MR analysis without b=0 image: an example for liver fibrosis evaluation. Quant Imaging Med Surg 2019;9:127-33. 10.21037/qims.2019.01.07 [DOI] [PMC free article] [PubMed] [Google Scholar]
- 8.Xiao BH, Huang H, Wang LF, Qiu SW, Guo SW, Wang YX. Diffusion MRI Derived per Area Vessel Density as a Surrogate Biomarker for Detecting Viral Hepatitis B-Induced Liver Fibrosis: A Proof-of-Concept Study. SLAS Technol 2020;25:474-83. 10.1177/2472630320915838 [DOI] [PubMed] [Google Scholar]
- 9.Wáng YX. Observed paradoxical perfusion fraction elevation in steatotic liver: An example of intravoxel incoherent motion modeling of the perfusion component constrained by the diffusion component. NMR Biomed 2021. [Epub ahead of print]. doi: 10.1002/nbm.4488 [DOI] [PubMed] [Google Scholar]
- 10.McKinstry RC, Weiskoff RM, Belliveau JW, Vevea JM, Moore JB, Kwong KW, Halpern EF, Rosen BR. Ultrafast MR imaging of water mobility: animal models of altered cerebral perfusion. J Magn Reson Imaging 1992;2:377-84. 10.1002/jmri.1880020404 [DOI] [PubMed] [Google Scholar]
- 11.Federau C, Sumer S, Becce F, Maeder P, O'Brien K, Meuli R, Wintermark M. Intravoxel incoherent motion perfusion imaging in acute stroke: initial clinical experience. Neuroradiology 2014;56:629-35. 10.1007/s00234-014-1370-y [DOI] [PubMed] [Google Scholar]
- 12.Zhu G, Federau C, Wintermark M, Chen H, Marcellus DG, Martin BW, Heit JJ. Comparison of MRI IVIM and MR perfusion imaging in acute ischemic stroke due to large vessel occlusion. Int J Stroke 2020;15:332-42. 10.1177/1747493019873515 [DOI] [PubMed] [Google Scholar]
- 13.Li T, Che-Nordin N, Wáng YXJ, Rong PF, Qiu SW, Zhang SW, Zhang P, Jiang YF, Chevallier O, Zhao F, Xiao XY, Wang W. Intravoxel incoherent motion derived liver perfusion/diffusion readouts can be reliable biomarker for the detection of viral hepatitis B induced liver fibrosis. Quant Imaging Med Surg 2019;9:371-85. 10.21037/qims.2019.02.11 [DOI] [PMC free article] [PubMed] [Google Scholar]
- 14.Riexinger AJ, Martin J, Rauh S, Wetscherek A, Pistel M, Kuder TA, Nagel AM, Uder M, Hensel B, Müller L, Laun FB. On the Field Strength Dependence of Bi- and Triexponential Intravoxel Incoherent Motion (IVIM) Parameters in the Liver. J Magn Reson Imaging 2019;50:1883-92. 10.1002/jmri.26730 [DOI] [PubMed] [Google Scholar]
- 15.Guiu B, Petit JM, Capitan V, Aho S, Masson D, Lefevre PH, Favelier S, Loffroy R, Vergès B, Hillon P, Krausé D, Cercueil JP. Intravoxel incoherent motion diffusion-weighted imaging in nonalcoholic fatty liver disease: a 3.0-T MR study. Radiology 2012;265:96-103. 10.1148/radiol.12112478 [DOI] [PubMed] [Google Scholar]
- 16.Ijaz S, Yang W, Winslet MC, Seifalian AM. Impairment of hepatic microcirculation in fatty liver. Microcirculation 2003;10:447-56. 10.1038/sj.mn.7800206 [DOI] [PubMed] [Google Scholar]
- 17.Dijkstra H, Handayani A, Kappert P, Oudkerk M, Sijens PE. Clinical implications of non-steatotic hepatic fat fractions on quantitative diffusion-weighted imaging of the liver. PLoS One 2014;9:e87926. 10.1371/journal.pone.0087926 [DOI] [PMC free article] [PubMed] [Google Scholar]
- 18.Li YT, Cercueil JP, Yuan J, Chen W, Loffroy R, Wang YX. Liver intravoxel incoherent motion (IVIM) magnetic resonance imaging: a comprehensive review of published data on normal values and applications for fibrosis and tumor evaluation. Quant Imaging Med Surg 2017;7:59-78. 10.21037/qims.2017.02.03 [DOI] [PMC free article] [PubMed] [Google Scholar]
- 19.Zhang Q, Wang YX, Ma HT, Yuan J. Cramér-Rao bound for Intravoxel Incoherent Motion Diffusion Weighted Imaging fitting. Annu Int Conf IEEE Eng Med Biol Soc 2013;2013:511-4. [DOI] [PubMed] [Google Scholar]
- 20.Luciani A, Vignaud A, Cavet M, Nhieu JT, Mallat A, Ruel L, Laurent A, Deux JF, Brugieres P, Rahmouni A. Liver cirrhosis: intravoxel incoherent motion MR imaging--pilot study. Radiology 2008;249:891-9. 10.1148/radiol.2493080080 [DOI] [PubMed] [Google Scholar]
- 21.Wáng YXJ, Deng M, Li YT, Huang H, Leung JCS, Chen W, Lu PX. A Combined Use of Intravoxel Incoherent Motion MRI Parameters Can Differentiate Early-Stage Hepatitis-b Fibrotic Livers from Healthy Livers. SLAS Technol 2018;23:259-68. 10.1177/2472630317717049 [DOI] [PubMed] [Google Scholar]
- 22.Huang H, Che-Nordin N, Wang LF, Xiao BH, Chevallier O, Yun YX, Guo SW, Wáng YXJ. High performance of intravoxel incoherent motion diffusion MRI in detecting viral hepatitis-b induced liver fibrosis. Ann Transl Med 2019;7:39. 10.21037/atm.2018.12.33 [DOI] [PMC free article] [PubMed] [Google Scholar]
- 23.Iima M, Le Bihan D. Clinical intravoxel incoherent motion and diffusion MR imaging: past, present, and future. Radiology 2016;278:13-32. 10.1148/radiol.2015150244 [DOI] [PubMed] [Google Scholar]
- 24.Szubert-Franczak AE, Naduk-Ostrowska M, Pasicz K, Podgórska J, Skrzyński W, Cieszanowski A. Intravoxel incoherent motion magnetic resonance imaging: basic principles and clinical applications. Pol J Radiol 2020;85:e624-35. 10.5114/pjr.2020.101476 [DOI] [PMC free article] [PubMed] [Google Scholar]
- 25.Paschoal AM, Leoni RF, Dos Santos AC, Paiva FF. Intravoxel incoherent motion MRI in neurological and cerebrovascular diseases. Neuroimage Clin 2018;20:705-14. 10.1016/j.nicl.2018.08.030 [DOI] [PMC free article] [PubMed] [Google Scholar]
- 26.Federau C. Intravoxel incoherent motion MRI as a means to measure in vivo perfusion: A review of the evidence. NMR Biomed 2017;30:e3780. 10.1002/nbm.3780 [DOI] [PubMed] [Google Scholar]
- 27.Noij DP, Martens RM, Marcus JT, de Bree R, Leemans CR, Castelijns JA, de Jong MC, de Graaf P. Intravoxel incoherent motion magnetic resonance imaging in head and neck cancer: A systematic review of the diagnostic and prognostic value. Oral Oncol 2017;68:81-91. 10.1016/j.oraloncology.2017.03.016 [DOI] [PubMed] [Google Scholar]
- 28.Iima M, Honda M, Sigmund EE, Ohno Kishimoto A, Kataoka M, Togashi K. Diffusion MRI of the breast: Current status and future directions. J Magn Reson Imaging 2020;52:70-90. 10.1002/jmri.26908 [DOI] [PubMed] [Google Scholar]
- 29.Togao O, Hiwatashi A, Yamashita K, Kikuchi K, Momosaka D, Yoshimoto K, Kuga D, Mizoguchi M, Suzuki SO, Iwaki T, Van Cauteren M, Iihara K, Honda H. Measurement of the perfusion fraction in brain tumors with intravoxel incoherent motion MR imaging: validation with histopathological vascular density in meningiomas. Br J Radiol 2018;91:20170912. 10.1259/bjr.20170912 [DOI] [PMC free article] [PubMed] [Google Scholar]
- 30.Lee HJ, Rha SY, Chung YE, Shim HS, Kim YJ, Hur J, Hong YJ, Choi BW. Tumor perfusion-related parameter of diffusion-weighted magnetic resonance imaging: correlation with histological microvessel density. Magn Reson Med 2014;71:1554-8. 10.1002/mrm.24810 [DOI] [PubMed] [Google Scholar]
- 31.Luo J, Zhou K, Zhang B, Luo N, Bian J. Intravoxel Incoherent Motion Diffusion-Weighted Imaging for Evaluation of the Cell Density and Angiogenesis of Cirrhosis-Related Nodules in an Experimental Rat Model: Comparison and Correlation With Dynamic Contrast-Enhanced MRI. J Magn Reson Imaging 2020;51:812-23. 10.1002/jmri.26845 [DOI] [PMC free article] [PubMed] [Google Scholar]
- 32.Wirestam R, Borg M, Brockstedt S, Lindgren A, Holtås S, Ståhlberg F. Perfusion-related parameters in intravoxel incoherent motion MR imaging compared with CBV and CBF measured by dynamic susceptibility-contrast MR technique. Acta Radiol 2001;42:123-8. 10.1080/028418501127346459 [DOI] [PubMed] [Google Scholar]
- 33.Federau C, Meuli R, O’Brien K, Maeder P, Hagmann P. Perfusion measurement in brain gliomas with intravoxel incoherent motion MRI. AJNR Am J Neuroradiol 2014;35:256-62. 10.3174/ajnr.A3686 [DOI] [PMC free article] [PubMed] [Google Scholar]
- 34.Mayer P, Fritz F, Koell M, Skornitzke S, Bergmann F, Gaida MM, Hackert T, Maier-Hein K, Laun FB, Kauczor HU, Grenacher L, Klauß M, Stiller W. Assessment of tissue perfusion of pancreatic cancer as potential imaging biomarker by means of Intravoxel incoherent motion MRI and CT perfusion: correlation with histological microvessel density as ground truth. Cancer Imaging 2021;21:13. 10.1186/s40644-021-00382-x [DOI] [PMC free article] [PubMed] [Google Scholar]
- 35.Patel J, Sigmund EE, Rusinek H, Oei M, Babb JS, Taouli B. Diagnosis of cirrhosis with intravoxel incoherent motion diffusion MRI and dynamic contrast-enhanced MRI alone and in combination: preliminary experience. J Magn Reson Imaging 2010;31:589-600. 10.1002/jmri.22081 [DOI] [PMC free article] [PubMed] [Google Scholar]
- 36.Hectors SJ, Wagner M, Besa C, Bane O, Dyvorne HA, Fiel MI, Zhu H, Donovan M, Taouli B. Intravoxel incoherent motion diffusion-weighted imaging of hepatocellular carcinoma: Is there a correlation with flow and perfusion metrics obtained with dynamic contrast-enhanced MRI? J Magn Reson Imaging 2016;44:856-64. 10.1002/jmri.25194 [DOI] [PMC free article] [PubMed] [Google Scholar]


