Abstract
Background
Thrombospondins (THBSs) are glycoproteins expressed in the extracellular matrix (ECM) and have critical roles in tumor development and metastasis. However, the diverse expression patterns and prognostic roles of distinct THBS genes in gastric cancer have not been fully elucidated. In the current study, we aimed to investigate the expression patterns of THBSs in gastric cancer (GC) and determine whether they are prognostic markers for this malignancy.
Methods
mRNA expression status and genetic mutations of THBS family members were performed by using ONCOMINE, UCSC Xena browser, GEPIA, and cBioPortal databases. Prognostic values and function enrichment analysis of the members were assessed via Kaplan-Meier plotter and Metascape.
Results
we found that the mRNA expression of THBS1, THBS2, THBS4, and COMP were higher in patients with GC tissues than those in normal gastric mucosa and there was no difference in the mRNA expression of THBS3 between GC and normal tissue. Survival analysis revealed that mRNA levels of THBSs were strongly related to worse OS in GC patients (P<0.05). Overexpression of THBSs indicated poor OS in stage III/IV GC and high expression of THBS1, THBS3, THBS4, and COMP were related to worse OS in stage II GC.
Conclusions
Bioinformatics analysis revealed a better understanding the value of THBS family members in GC and suggest that THBSs might serve as potential prognostic biomarkers for GC.
Keywords: Thrombospondins (THBSs), gastric cancer (GC), database mining, prognostic values, bioinformatics analyses
Introduction
Gastric carcinoma (GC) is the fifth most prevalent lethal malignancy and third leading cause of cancer-related death worldwide (1). Improvements in diagnostic technology over recent decades has resulted in more effective and comprehensive treatment and a decrease in the mortality rate of GC, yet the treatment cure rate and 5-year survival rate remain low (2). Although the etiology of GC is complex and remains unclear, increasingly studies have shown that gene expression dysfunction is one of the main factors in its pathogenesis (3,4). Recently, gene sequencing technologies have increasingly attracted the attention of oncologists. The emergence of genome-wide association studies has resulted in the identification of several susceptibility loci associated with the mechanisms underlining cancer initiation and progression (5). Therefore, identifying molecular markers closely related to the occurrence and development of GC has become a pressing concern.
Thrombospondins (THBSs) are known to be multidomain matricellular glycoproteins secreted by stromal fibroblasts, endothelial cells, and immune cells (6). THBS family members consist of five highly homologous glycoproteins (7). The THBSs of mammals play many complex tissue-specific roles in tumor development and progression, such as cell migration, proliferation, and tumor growth (8). THBSs have a tissue remodeling function in humans, and have expression differs in various types of human malignancies, like GC (9), colorectal (8), urological (10), and breast cancer (11). Recent studies have demonstrated that a component of THBSs may be related to patient’s survival in some types of cancer and could serve as cancer diagnostic or prognostic biomarkers. For instance, Berger et al. have found that THBS2 is a potential prognostic and diagnostic marker in pancreatic cancer (12). In addition, Marisi et al. demonstrated that THBS1 could be utilized as a biomarker in patients with metastatic colorectal cancer receiving bevacizumab (13). Increasing studies have disclosed that THBSs could promote tumor cell proliferation, migration, invasion, and metastasis as well as a poor prognosis in patients with GC (9,14). However, whether the THBS gene family can be a potential prognostic marker for GC and its underlying mechanism is still unknown.
In this study, we systematically analyzed the expression and clinical outcomes of THBS family members in GC based on different online databases. This analysis may provide new insight into the diagnosis and treatment of patients with GC.
We present the following article in accordance with the REMARK reporting checklist (available at http://dx.doi.org/10.21037/jgo-21-54).
Methods
Ethics statement
The study was approved by the Academic Committee of First Hospital of Gannan Medical University and conducted in accordance with the Declaration of Helsinki (as revised in 2013).
Oncomine
The mRNA expression status of distinct THBSs [THBS1, THBS2, THBS3, THBS4, THBS5 (gene name: COMP)] in different type of cancers were examined using the Oncomine cancer microarray online database (www.oncomine.org) (15). The expression of mRNA in cancer tissue compared with normal tissue was analyzed in GC. We selected a P value =1×10⁻⁴, two-fold changes, and top 10% gene rank as the threshold.
UCSC Xena browser
We analyzed different mRNA expression of THBSs in primary STAD (TCGA Stomach Cancer, n=591) from data in the Cancer Genome Atlas (TCGA) using the UCSC Xena browser (http://xenabrowser.net/) (16).
GEPIA database
GEPIA is a newly developed web-based tool server for analyzing mRNA expression data based on TCGA and GTEx data (http://gepia.cancer-pku.cn) (17). GEPIA provides key interactive and customizable functions such as differential expression analysis, profiling plotting, correlation analysis, patient survival analysis, similar gene detection, and dimensionality reduction analysis (18).
cBioPortal for cancer genomics
The cBioPortal for Cancer Genomics is a Web resource with visualization and analysis capabilities (www.cbioportal.org) (19,20). We chose the GC dataset (TCGA, Provisional) which contains the data of 478 GC patients for analyses of the relationship between THBSs in GC patients and alteration frequency. Selected genomic profiles included mutations, copy-number variance from GISTIC, and mRNA expression z-scores (RNA Seq V2 RSEM) with a z score threshold of ±2.0. Network analyses were also performed online using this method (21).
Bioinformatics analyses
Metascape (http://metascape.org) is a web-based portal designed gene-list tool for gene annotation and analysis. The available terms for enrichment analysis include pathway, functional set, structural complex, and signature module (22). We undertook enrichment analysis of THBS family members and neighboring genes significantly associated with THBSs alterations. Gene ontology (GO) comprises molecular function, cellular component, and biological process. Reactome Gene Sets was used to clarify how THBS family members and neighboring genes perform function through a certain path. Protein-protein interaction (PPI) analysis was carried out to predict the interaction of selected genes. Further, Molecular Complex Detection (MCODE) algorithm was used to check modules of the PPI network (23). All analyses were performed based on the Metascape online tool.
Kaplan-Meier plotter
The correlation between mRNA expression of THBS family members and overall survival (OS) in GC was evaluated by the Kaplan-Meier plotter (www.kmplot.com) (24). We then analyzed THBS family genes prognostic values associated with clinic stages using this database. Log rank P value and hazard ratio (HR) with 95% confidence intervals were summarized from the KM plotter webpage.
Statistical analysis
SPSS v. 22.0 (SPSS Inc., Chicago, IL, USA) was used for statistical analyses. All values obtained from the studies were presented as mean ± SE. The expression levels of THBSs were compared between cancer specimens and normal controls by performing student’s t-test. The calculation of OS was carried out using Kaplan-Meier plotter analyses and log-rank test. P<0.05 were considered statistically significant.
Results
Relative mRNA expression of THBSs in GC
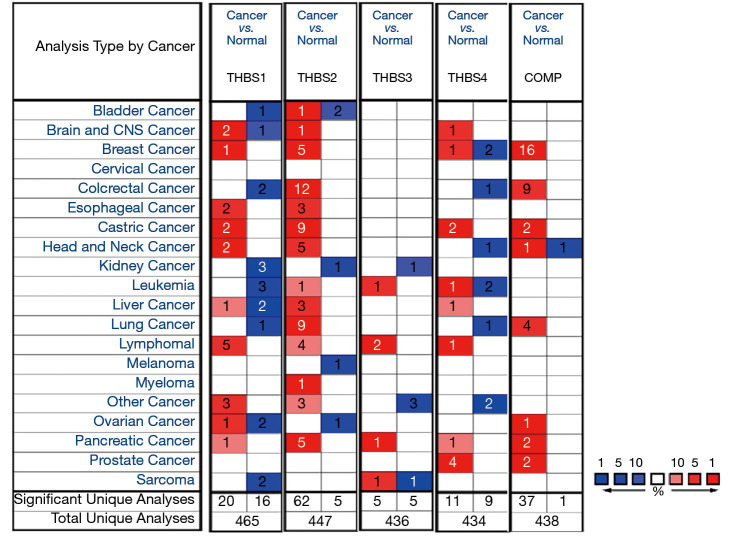
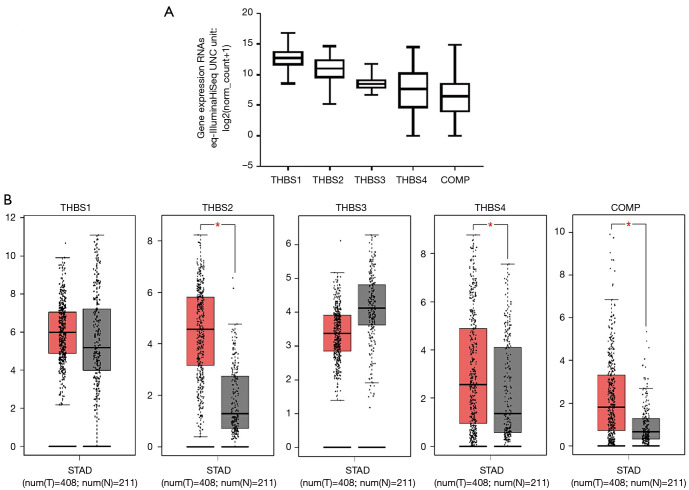
We compared the transcriptional levels of THBSs in GC tissues with those found in normal tissues. Oncomine analysis showed the transcription expression levels of THBS1, THBS2, THBS4, and COMP were significantly upregulated in patients with GC. However, there was no difference in the mRNA expression of THBS3 between GC and normal tissue (Figure 1). The mRNA level was also seen to vary between five THBSs members in stomach adenocarcinoma (STAD) by using UCSC Xena Browser (Figure 2A), with the THBS1 mRNA level being highest and the mRNA expression of COMP the lowest. To further validate the expression of THBSs between GC and normal tissues, the GEPIA online database was used. The expression levels of THBS2, THBS4, and COMP were found to be increased in gastric tumor tissues compared with healthy tissues, whereas the expression levels of THBS1 and THBS3 groups did not significantly differ between the former and the latter (Figure 2B).
Figure 1.
The mRNA expression of THBS family members in different cancer types. THBS gene family expressions (cancer vs. normal tissue) analyzed with ONCOMINE database. The graphic demonstrates the numbers of datasets with statistically significant mRNA over-expression (red) or down-expression (blue) of the target gene. The P value threshold is 0.01. The number in each cell represents the number of analyses that meet the threshold within those analysis and cancer types. The gene rank was analyzed by percentile of target gene in the top of all genes measured in each research. Cell color is determined by the best gene rank percentile for the analyses within the cell. THBS, thrombospondin.
Figure 2.
The expression of THBS family members in GC patients. (A) Five THBS genes expression differences in GC using UCSC Xena browser; (B) mRNA expression of THBS genes varied in primary tumor and in corresponding normal tissues in GC patients (GEPIA). Box plots derived from gene expression data for GEPIA; the P value was set at 0.05. * indicating the results are statistically significant. THBS, thrombospondin; GC, gastric cancer.
Genetic alteration differences of THBSs and their neighbor gene network in patients with GC
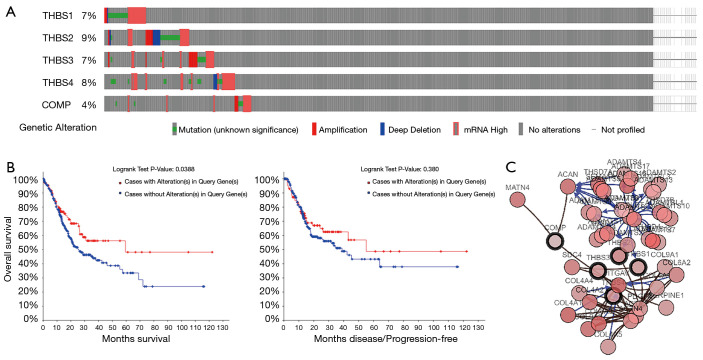
We used the OncoPrint from a query for alterations in the GC pathway genes THBS1, THBS2, THBS3, THBS4, and COMP. Among the 478 patients with Stomach Adenocarcinoma in the selected dataset (TCGA, Provisional), THBS genes were altered in 118 (25%) of the queried samples. The percentage of genetic alterations in THBS family members for GC ranged from 4 to 9% for individual genes (THBS1, 7%; THBS2, 9%; THBS3, 7%; THBS4, 8%; COMP, 4%) (Figure 3A). GC patients with alterations of THBSs were found to have significantly poor OS compared to those without alterations in any query gene (P value: 0.039), whereas no differences were detected in disease-free survival (DFS) (P value: 0.38) (Figure 3B). We made the network of THBSs and the 50 most frequently altered neighbor genes and found that A2M, ACAN, ACTN2, ACTN4, ADAMTS1, ADAMTS10, ADAMTS12, ADAMTS13, ADAMTS14, ADAMTS16, ADAMTS17, ADAMTS18, ADAMTS19, ADAMTS2, ADAMTS20, ADAMTS5, ADAMTS6, ADAMTS7, ADAMTS8, ADAMTS9, ADAMTSL1, ADAMTL3, ADAMTSL4, B3GLCT, COL4A1, COL4A2, COL4A3, COL4A4, COL4A5, COL6A2, COL6A3, COL9A1, COL9A3, F5, F8, GAS6, HGF, ITGAV, MATN4, PDGFA, POFUT2, PROS1, SDC4, SEMA5A, THSD1, THSD4, THSD7A, THSD7B, VEFGC, and VWF were closely associated with THBS alterations and functions (Figure 3C).
Figure 3.
Analysis of THBSs’ alterations in GC. The analysis was performed using the cBioPortal database. (A) Oncoprint in cBioPortal represented the proportion and distribution of cases with THBS alterations; (B) the Kaplan-Meier plot comparing overall survival (OS) and disease-free survival (DFS) of GC patients with THBS alterations and without THBS alternations; (C) gene-gene interaction network among THBS family members and 50 most frequently altered neighboring genes. THBSs, thrombospondins; GC, gastric cancer.
Functional enrichment analysis of THBSs in patients with GC
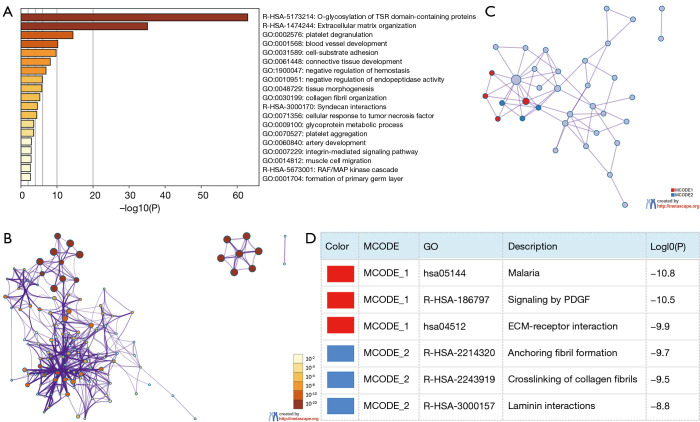
To further understand the mechanism and function of THBSs and the 50 hub genes, gene ontology (GO) biological processes (BP) and Reactome gene sets were applied using Metascape (Figure 4A,B and Table 1). Among the top 19 clusters with their representative enriched terms (one per cluster), there were 15 items of GO biological process, and four items of Reactome Gene Sets. The results showed that the THBSs and their neighboring genes were mainly involved in BP such as cell-substrate adhesion, blood vessel development, and platelet degranulation. The Reactome pathways that these genes were involved in were O-glycosylation of TSR domain-containing proteins, extracellular matrix (ECM) organization, Syndecan interactions, and RAF/MAP kinase cascade. Moreover, to further investigate the relationship between THBSs and GC, a PPI network was constructed according to information from the Metascape online database. PPI network and MCODE components identified in the gene lists are shown in Figure 4C and the top two modules with high scores were obtained from the PPI network. As shown in Figure 4D, the biological functions mainly related to MCODE 1 were malaria, signaling by PDGF, and ECM-receptor interaction, while in MCODE 2 these were anchoring fibril formation, crosslinking of collagen fibrils, and laminin interactions.
Figure 4.
Enrichment analysis of THBS family members and neighboring genes in GC (Metascape). (A) Heatmap of enriched terms across input gene lists, colored by P values; (B) network of enriched terms colored by P value, where terms containing more genes tend to have a more significant P value; (C,D) PPI network and MCODE components identified in the gene lists. THBS, thrombospondin; GC, gastric cancer.
Table 1. Pathway and process enrichment analysis of THBS family members and neighbor genes in GC.
| GO | Category | Description | Count | % | Log10(P) | Log10(q) |
|---|---|---|---|---|---|---|
| HSA-5173214 | Reactome gene sets | glycosylation of TSR domain-containing proteins | 26 | 49.06 | −62.93 | −58.61 |
| R-HSA-1474244 | Reactome gene sets | Extracellular matrix organization | 26 | 49.06 | −35.13 | −31.59 |
| HSA-3000170 | Reactome gene sets | Syndecan interactions | 3 | 5.66 | −4.55 | −2.29 |
| R-HSA-5673001 | Reactome gene sets | RAF/MAP kinase cascade | 4 | 7.55 | −2.66 | −0.62 |
| GO:0002576 | GO biological processes | Platelet degranulation | 11 | 20.75 | −14.42 | −11.52 |
| GO:0001568 | GO biological processes | Blood vessel development | 15 | 28.30 | −10.23 | −7.52 |
| GO:0031589 | GO biological processes | Cell-substrate adhesion | 11 | 20.75 | −9.74 | −7.0 |
| GO:0061448 | GO biological processes | Connective tissue development | 9 | 16.98 | −8.13 | −5.55 |
| GO:1900047 | GO biological processes | Negative regulation of hemostasis | 5 | 9.43 | −6.95 | −4.50 |
| GO:0010951 | GO biological processes | Negative regulation of endopeptidase activity | 7 | 13.21 | −5.91 | −3.48 |
| GO:0048729 | GO biological processes | Tissue morphogenesis | 10 | 18.87 | −5.80 | −3.39 |
| GO:0030199 | GO biological processes | Collagen fibril organization | 4 | 7.55 | −5.25 | −2.91 |
| GO:0071356 | GO biological processes | Cellular response to tumor necrosis factor | 6 | 11.32 | −4.40 | −2 |
| GO:0009100 | GO biological processes | Glycoprotein metabolic process | 6 | 11.32 | −3.56 | −1.39 |
| GO:0070527 | GO biological processes | Platelet aggregation | 3 | 5.66 | −3.53 | −1.36 |
| GO:0060840 | GO biological processes | Artery development | 3 | 5.66 | −2.91 | −0.84 |
| GO:0007229 | GO biological processes | Integrin-mediated signaling pathway | 3 | 5.66 | −2.85 | −0.78 |
| GO:0014812 | GO biological processes | Muscle cell migration | 3 | 5.66 | −2.82 | −0.72 |
| GO:0001704 | GO biological processes | Formation of primary germ layer | 3 | 5.66 | −2.63 | −0.59 |
Top 19 clusters with their representative enriched terms (one per cluster). “Count” is the number of genes in the user-provided lists with membership in the given ontology term. The percentage “%” is that of all the user-provided genes that are found in the given ontology term (only input genes with at least one ontology term annotation are included in the calculation). “Log10(P)” is the P value in log base 10. “Log10(q)” is the multi-test adjusted P value in log base 10. THBSs, thrombospondins; GC, gastric cancer.
Higher mRNA levels of THBSs have poor prognostic values in GC patients
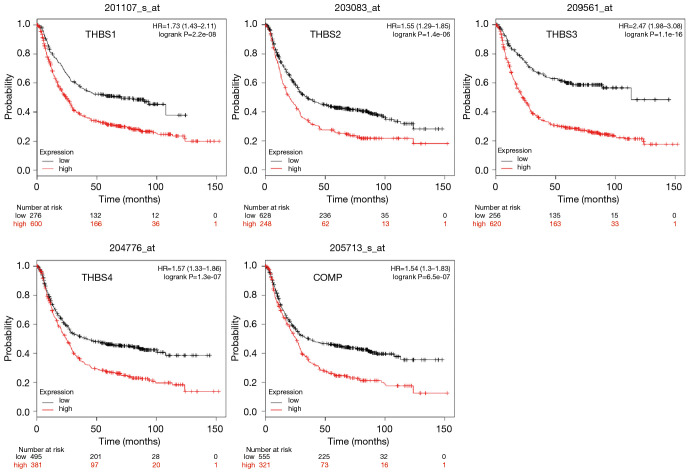
We used Kaplan-Meier plotter analysis to assess the potential prognosis of THBS family members in GC patients. The results showed that mRNA levels of THBSs were strongly related to worse OS in GC patients (P<0.05) (Figure 5). To further explore the critical role of THBS family genes in the prognosis of patients with GC, we also investigated the relationship between THBS family genes and clinical stages. The mRNA overexpression of THBSs indicated poor OS in stage III/IV GC and high THBS1, THBS3, THBS4, and COMP expression were related to worse OS in stage II GC. Moreover, THBS3 and THBS4 were also significantly correlated with poor OS in stage I GC (Table S1).
Figure 5.
Prognostic values of the THBSs’ mRNA expression in all GC patients by using www.kmplot.com. THBSs, thrombospondins; GC, gastric cancer.
Discussion
Gastric cancer is a significant public health problem in Asia and efforts to improve its treatment and prognosis are highly sought. Recent studies have demonstrated that genetic changes play a strong role in the development of GC (25). However, the underlying mechanism of gene expression differences in the development of tumors remains poorly understood. Therefore, it is essential to find new prognostic markers to improve the clinical outcome of GC patients.
Numerous studies had shown the significant role of THBS in distinct types of cancer (26,27). A recent study reported that the low expression of THBS1 correlated with a more advanced grade of liver and lymph node metastases and significantly worse OS than strong THBS1 expression (28). Animal studies have also revealed that bone metastases were abolished when THBS2 was actively reduced in prostate cancer (PCa) cells (29). Moreover, patients with increased COMP expression presented with poorer OS compared to patients with no change or reduced COMP expression (26). In addition, over-expression of THBS4 enhanced hepatocellular carcinoma (HCC) migration and vascular invasion, and targeting THBS4 may provide a promising therapeutic strategy for treatment of advanced HCC (30). However, research on the role of THBS3 in cancer is limited. Although the roles of distinct members of THBS in many cancers have been partially confirmed, there has been no comprehensive analysis of the role of THBS family members in GC to date. Our study is the first to explore the expression profiles and prognostic significance of different THBSs in GC based on available databases. Our results showed that THBS2, THBS4, and COMP were significantly higher in GC tissues than in corresponding normal tissues, and indicated worse OS in GC patients. By using cBioPortal for cancer genomics, it was determined that the alteration frequency of THBSs in GC is not low (25%) and varied from 14.29% to 18.18% for five different types of stomach adenocarcinoma based on the TCGA Provisional database. Moreover, GC patients with alterations of THBSs were found to have much worse OS compared to those without alterations in any query gene. Finally, to better understand the function and carcinogenic mechanism of THBSs for GC, we performed a functional enrichment analysis and our results suggested that THBS family members might play critical roles in the development of multiple tumors. Whilst it is clear that dysfunction of THBS genes is closely correlated with the prognosis of many different types of cancer, there is presently little knowledge of its potential mechanism, function, and prognostic value in GC. More studies on the role of THBS genes are required to understand their significance to GC therapy.
Acknowledgments
We are grateful to Dr. Zhan Zhang for revising the figures.
Funding: This work was supported by the Youth Foundation of Jiangxi Provincial Education Department (Grant No. GJJ13671).
Ethical Statement: The authors are accountable for all aspects of the work in ensuring that questions related to the accuracy or integrity of any part of the work are appropriately investigated and resolved. The study was approved by the Academic Committee of First Hospital of Gannan Medical University and conducted in accordance with the Declaration of Helsinki (as revised in 2013).
Open Access Statement: This is an Open Access article distributed in accordance with the Creative Commons Attribution-NonCommercial-NoDerivs 4.0 International License (CC BY-NC-ND 4.0), which permits the non-commercial replication and distribution of the article with the strict proviso that no changes or edits are made and the original work is properly cited (including links to both the formal publication through the relevant DOI and the license). See: https://creativecommons.org/licenses/by-nc-nd/4.0/.
Reporting Checklist: The authors have completed the REMARK reporting checklist. Available at http://dx.doi.org/10.21037/jgo-21-54
Conflicts of Interest: All authors have completed the ICMJE uniform disclosure form (available at http://dx.doi.org/10.21037/jgo-21-54). The authors have no conflicts of interest to declare.
(English Language Editor: B. Draper)
References
- 1.Arora N, Alsaied O, Dauer P, et al. Downregulation of Sp1 by Minnelide leads to decrease in HSP70 and decrease in tumor burden of gastric cancer. PLoS One 2017;12:e0171827. 10.1371/journal.pone.0171827 [DOI] [PMC free article] [PubMed] [Google Scholar]
- 2.Song L, Guo Y, Xu B. Expressions of Ras Homolog Gene Family, Member A (RhoA) and Cyclooxygenase-2 (COX-2) Proteins in Early Gastric Cancer and Their Role in the Development of Gastric Cancer. Med Sci Monit 2017;23:2979-84. 10.12659/MSM.902367 [DOI] [PMC free article] [PubMed] [Google Scholar]
- 3.Companioni O, Sanz-Anquela JM, Pardo ML, et al. Gene expression study and pathway analysis of histological subtypes of intestinal metaplasia that progress to gastric cancer. PLoS One 2017;12:e0176043. 10.1371/journal.pone.0176043 [DOI] [PMC free article] [PubMed] [Google Scholar]
- 4.Zoppoli P, Calice G, Laurino S, et al. TRPV2 Calcium Channel Gene Expression and Outcomes in Gastric Cancer Patients: A Clinically Relevant Association. J Clin Med 2019;8:662. 10.3390/jcm8050662 [DOI] [PMC free article] [PubMed] [Google Scholar]
- 5.Xu Y, Chen M, Liu C, et al. Association Study Confirmed Three Breast Cancer-Specific Molecular Subtype-Associated Susceptibility Loci in Chinese Han Women. Oncologist 2017;22:890-4. 10.1634/theoncologist.2016-0423 [DOI] [PMC free article] [PubMed] [Google Scholar]
- 6.Sun R, Wu J, Chen Y, et al. Down regulation of Thrombospondin2 predicts poor prognosis in patients with gastric cancer. Mol Cancer 2014;13:225. 10.1186/1476-4598-13-225 [DOI] [PMC free article] [PubMed] [Google Scholar]
- 7.Huang T, Sun L, Yuan X, et al. Thrombospondin-1 is a multifaceted player in tumor progression. Oncotarget 2017;8:84546-58. 10.18632/oncotarget.19165 [DOI] [PMC free article] [PubMed] [Google Scholar]
- 8.Wang X, Zhang L, Li H, et al. THBS2 is a potential prognostic biomarker in colorectal cancer. Sci Rep 2016;6:33366. 10.1038/srep33366 [DOI] [PMC free article] [PubMed] [Google Scholar]
- 9.Chen X, Huang Y, Wang Y, et al. THBS4 predicts poor outcomes and promotes proliferation and metastasis in gastric cancer. J Physiol Biochem 2019;75:117-23. 10.1007/s13105-019-00665-9 [DOI] [PubMed] [Google Scholar]
- 10.Miyata Y, Sakai H.. Thrombospondin-1 in urological cancer: pathological role, clinical significance, and therapeutic prospects. Int J Mol Sci 2013;14:12249-72. 10.3390/ijms140612249 [DOI] [PMC free article] [PubMed] [Google Scholar]
- 11.Chen Q, Fang X, Jiang C, et al. Thrombospondin promoted anti-tumor of adenovirus-mediated calreticulin in breast cancer: Relationship with anti-CD47. Biomed Pharmacother 2015;73:109-15. 10.1016/j.biopha.2015.05.017 [DOI] [PubMed] [Google Scholar]
- 12.Berger AW, Schwerdel D, Reinacher-Scnick A, et al. A Blood-Based Multi Marker Assay Supports the Differential Diagnosis of Early-Stage Pancreatic Cancer. Theranostics 2019;9:1280-7. 10.7150/thno.29247 [DOI] [PMC free article] [PubMed] [Google Scholar]
- 13.Marisi G, Scarpi E, Passardi A, et al. IL-8 and thrombospondin-1 as prognostic markers in patients with metastatic colorectal cancer receiving bevacizumab. Cancer Manag Res 2018;10:5659-66. 10.2147/CMAR.S181570 [DOI] [PMC free article] [PubMed] [Google Scholar]
- 14.Huang T, Wang L, Liu D, et al. FGF7/FGFR2 signal promotes invasion and migration in human gastric cancer through upregulation of thrombospondin-1. Int J Oncol 2017;50:1501-12. 10.3892/ijo.2017.3927 [DOI] [PMC free article] [PubMed] [Google Scholar]
- 15.You Y, Ma Y, Wang Q, et al. Attenuated ZHX3 expression serves as a potential biomarker that predicts poor clinical outcomes in breast cancer patients. Cancer Manag Res 2019;11:1199-210. 10.2147/CMAR.S184340 [DOI] [PMC free article] [PubMed] [Google Scholar]
- 16.Sanborn JZ, Benz SC, Craft B, et al. The UCSC Cancer Genomics Browser: update 2011. Nucleic Acids Res 2011;39:D951-9. 10.1093/nar/gkq1113 [DOI] [PMC free article] [PubMed] [Google Scholar]
- 17.Tang Z, Li C, Kang B, et al. GEPIA: a web server for cancer and normal gene expression profiling and interactive analyses. Nucleic Acids Res 2017;45:W98-W102. 10.1093/nar/gkx247 [DOI] [PMC free article] [PubMed] [Google Scholar]
- 18.Zhou Q, Zhang F, He Z, et al. E2F2/5/8 Serve as Potential Prognostic Biomarkers and Targets for Human Ovarian Cancer. Front Oncol 2019;9:161 10.3389/fonc.2019.00161 [DOI] [PMC free article] [PubMed] [Google Scholar]
- 19.Liu ZL, Bi XW, Liu PP, et al. Expressions and prognostic values of the E2F transcription factors in human breast carcinoma. Cancer Manag Res 2018;10:3521-32. 10.2147/CMAR.S172332 [DOI] [PMC free article] [PubMed] [Google Scholar]
- 20.Gao J, Aksoy BA, Dogrusoz U, et al. Integrative analysis of complex cancer genomics and clinical profiles using the cBioPortal. Sci Signal 2013;6:pl1 10.1126/scisignal.2004088 [DOI] [PMC free article] [PubMed] [Google Scholar]
- 21.Cerami E, Gao J, Dogrusoz U, et al. The cBio cancer genomics portal: an open platform for exploring multidimensional cancer genomics data. Cancer Discov 2012;2:401-4. 10.1158/2159-8290.CD-12-0095 [DOI] [PMC free article] [PubMed] [Google Scholar]
- 22.Zhou Y, Zhou B, Pache L, et al. Metascape provides a biologist-oriented resource for the analysis of systems-level datasets. Nat Commun 2019;10:1523. 10.1038/s41467-019-09234-6 [DOI] [PMC free article] [PubMed] [Google Scholar]
- 23.Li N, Li L, Chen Y. The Identification of Core Gene Expression Signature in Hepatocellular Carcinoma. Oxid Med Cell Longev 2018;2018:3478305. 10.1155/2018/3478305 [DOI] [PMC free article] [PubMed] [Google Scholar]
- 24.Pan JH, Zhou H, Laura C, et al. LAYN Is a Prognostic Biomarker and Correlated With Immune Infiltrates in Gastric and Colon Cancers. Front Immunol 2019;10:6. 10.3389/fimmu.2019.00006 [DOI] [PMC free article] [PubMed] [Google Scholar]
- 25.Tan P, Yeoh KG. Genetics and Molecular Pathogenesis of Gastric Adenocarcinoma. Gastroenterology 2015;149:1153-1162.e3. 10.1053/j.gastro.2015.05.059 [DOI] [PubMed] [Google Scholar]
- 26.Nfonsam VN, Nfonsan LE, Chen D, et al. COMP Gene Coexpresses With EMT Genes and Is Associated With Poor Survival in Colon Cancer Patients. J Surg Res 2019;233:297-303. 10.1016/j.jss.2018.08.021 [DOI] [PubMed] [Google Scholar]
- 27.Wu H, Zhang G, Li Z, et al. Thrombospondin-4 expression as a prognostic marker in hepatocellular carcinoma. Gene 2019;696:219-24. 10.1016/j.gene.2019.02.049 [DOI] [PubMed] [Google Scholar]
- 28.Teraoku H, Morine Y, Ikemoto T, et al. Role of thrombospondin-1 expression in colorectal liver metastasis and its molecular mechanism. J Hepatobiliary Pancreat Sci 2016;23:565-73. 10.1002/jhbp.376 [DOI] [PubMed] [Google Scholar]
- 29.Chen PC, Tang CH, Lin LW, et al. Thrombospondin-2 promotes prostate cancer bone metastasis by the up–regulation of matrix metalloproteinase-2 through down-regulating miR-376c expression. J Hematol Oncol 2017;10:33. 10.1186/s13045-017-0390-6 [DOI] [PMC free article] [PubMed] [Google Scholar]
- 30.Su F, Zhao J, Qin S, et al. Over-expression of Thrombospondin 4 correlates with loss of miR-142 and contributes to migration and vascular invasion of advanced [DOI] [PMC free article] [PubMed]


