

Abstract
Purpose
To determine the range of normal ocular biometry and perform advanced retinal imaging and functional assessment of the rhesus macaque eye.
Methods
We performed ocular phenotyping on rhesus macaques at the California National Primate Research Center. This process consisted of anterior and posterior segment eye examination by ophthalmologists, advanced retinal imaging, and functional retinal electrophysiology.
Results
Full eye examinations were performed on 142 animals, consisting of pupillary light reflex, tonometry, external examination and photography, anterior slit lamp examination, and posterior segment examination by indirect ophthalmoscopy. Ages of the rhesus macaques ranged from 0.7 to 29 years (mean, 16.4 ± 7.5 years). Anterior segment measurements such as intraocular pressure (n = 142), corneal thickness (n = 84), lens thickness (n = 114), and axial length (n = 114) were acquired. Advanced retinal imaging in the form of fundus photography (n = 78), optical coherence tomography (n = 60), and quantitative autofluorescence (n = 44) was obtained. Electroretinography (n = 75) was used to assay retinal function. Quantitative analyses of the macular structure, retinal layer segmentation, and rod and cone photoreceptor electrical responses are reported. Quantitative assessments were made and variations between sexes were analyzed to compare with established sex changes in human eyes.
Conclusions
The rhesus macaque has an ocular structure and function very similar to that of the human eye. In particular macular structure and retinal function is very similar to humans, making this species particularly useful for the study of macular biology and development of therapies for cone photoreceptor disorders.
Translational Relevance
Rhesus macaques are an ideal model for future vision science studies of human eye diseases.
Keywords: ocular parameters, rhesus macaque, nonhuman primate, functional parameters, imaging
Introduction
Vision science research has relied on small animal models for the bulk of eye research in the last several decades. Mice in particular are a commonly used animal model of human eye disease because they are easy to breed, are small in size, have short gestational periods, and develop to adulthood relatively quickly. Furthermore, the mouse genome is similar to the human genome and is routinely manipulated producing many genotype–phenotype correlations that parallel between species. However, mouse eyes are comparatively small, the relative sizes of the ocular structures are substantially different from people, and they lack a high acuity area, also referred to as the macula. When studies require larger eyes, rabbits, pigs, and dogs serve as useful models. Rabbits have been used particularly for ocular toxicology studies.1 Pigs have been used as models of ocular and retinal surgery.2–4 Select forms of canine models of inherited retinal disease have also been characterized.5,6 However, none of these species have a macula, which represents a major limitation for studying the most common forms of human retinal blindness. Similarly, models of corneal disease and glaucoma in these species are limited in number and similarity to human ophthalmic disease. Furthermore, the overall shape and structure of the primate eye has unique adaptations not found in other mammals. Therefore, precise modeling of all forms of human blindness requires the use of non-human primates (NHPs). One commonly used NHP used for biological research is the rhesus macaque (Macaca mulatta).
Rhesus and other macaques have been used as a model for human visual biology and ocular disease in various studies over the years. Upon inspection, the rhesus macaque and human eye bear a tremendous amount of anatomic similarity such that images of the NHP retina can be difficult to distinguish from the human, even for ophthalmologists. In general, the cornea, iris, lens, and vitreous also seem to be grossly identical between NHPs and human patients.7 These commonalities make NHPs an attractive model for translational studies to develop new therapies for human eye disease. The NHP eye has a cone-rich macula that is very similar to the human counterpart. Given that many important forms of blindness involve the macula, and that this specialized structure does not exist in other mammals, NHP research is particularly well-suited to the study of macular diseases and cone photoreceptor disorders.8,9 Furthermore, there is substantial literature on experimental glaucoma in macaques.10,11 To pursue translational studies in NHPs, it is necessary to establish norms of ocular examination and structure, as well as retinal function and anatomy.
The purpose of this study was to develop a normative database of ocular structure and function based on a complete eye examination, ocular measurements, advanced retinal imaging, and electroretinography. All data were derived from normal animals of various ages as a part of a prospective screening process to identify animals with inherited retinal disease.9 We hypothesized that the anatomic imaging and electroretinogram (ERG) in the NHP eye would effectively mirror human retinal norms with possible species-specific differences. We collected intraocular pressure (IOP), central corneal thickness (CCT), lens thickness, and axial length. We measured anatomic parameters of the macula from fundus photography, retinal layer thicknesses on optical coherence tomography (OCT), and retinal pigment epithelial lipofuscin using quantitative autofluorescence (qAF). We analyzed OCT images for retinal structure and anatomy focusing on the macular architecture. Quantitative AF has potential in human ophthalmology practice,12–14 and given the usefulness of NHP eye research, we provide qAF norms for comparison with human clinical data. Known associations in humans such as the relationship between IOP measurements and CCT were tested. Our investigations tested the hypothesis that the eye of the rhesus macaque is structurally and functionally similar to the human eye in essentially every measure.
Methods
Animals
All of the animals in this study were rhesus macaques (M mulatta) born and maintained at the California National Primate Research Center. The California National Primate Research Center is accredited by the Association for Assessment and Accreditation of Laboratory Animal Care International. The guidelines of the Association for Research in Vision and Ophthalmology Statement for the Use of Animals in Ophthalmic and Vision Research were followed. All aspects of this study were in accordance with the National Institutes of Health Guide for the Care and Use of Laboratory Animals. Phenotyping and ophthalmic examinations were performed according to an animal protocol approved by the UC Davis Institutional Animal Care and Use Committee.
Ophthalmic Phenotyping
Intramuscular injection of ketamine (5–30 mg/kg intramuscularly [IM]), dexmedetomidine (0.05–0.075 mg/kg IM), and midazolam (0.10 mg/kg IM) were given and all imaging and testing procedures were performed in a single session that took approximately 90 to 120 minutes. In some cases, a second smaller supplemental dose of these medications was given to extend the anesthesia time. The sum of all doses stayed within the total dosing range reported elsewhere in this article. Animals were monitored by a trained technician and a veterinarian at all times.
Animals were placed on a standard rectangular utility cart fitted with a 4-inch thick foam pad. For imaging procedures, animals were positioned prone such that their chin could be placed on the chin rest of the imaging device. For examination of the eyes, animals were placed supine. For measurement of the IOP, animals were held gently upright. Ophthalmic examination included measurement of the IOP using rebound tonometry (Icare TA01i, Helsinki, Finland), pupillary light reflex testing, external and portable slit lamp examination, as well as dilated (tropicamide 1%, phenylephrine 2.5%, and cyclopentolate 1%) indirect ophthalmoscopy. Axial length and lens thickness were measured using a Sonomed Pacscan Plus (Escalon, Wayne, PA). Corneal thickness was measured using a DGH Pachette 4 (DGH Technology Inc, Exton, PA).
Ophthalmic Imaging
The CF-1 Retinal Camera with a 50° wide angle lens (Canon, Tokyo, Japan) was used to obtain color and red-free fundus photographs. Spectral-domain OCT with confocal scanning laser ophthalmoscopy was performed (Spectralis HRA + OCT, Heidelberg, Germany). The Heidelberg eye tracking Automatic Real-Time software was set at 25 scans for each B-scan. A 30° horizontal high-resolution raster scan centered on the fovea was obtained using a corneal curvature (K) value of the 6.5 mm radius. Focal measurements of retinal layer thickness measurements were performed using the caliper measurement tool in ImageJ (National Institutes of Health, Bethesda, MD) on a horizontal line scan through the foveal center. The Spectralis device was also used to obtain blue peak fundus AF in a quantitative fashion as described elsewhere in this article.
Electroretinography
Eyes were dilated before ERG. A full-field ERG containing six different tests was performed on each eye after a 30-minute dark adaptation period. ERG-Jet electrodes (item #95-011) were coupled with the RETeval instrument (LKC Technologies, Gaithersburg, MD). A standard flash ERG was performed according to the approved protocol of the International Society for Clinical Electrophysiology of Vision. There were four dark-adapted tests (0.01 cd*s/m2, 3.0 cd*s/m2, 10.0 cd*s/m2, and oscillatory potentials 3.0 cd*s/m2). After 10 minutes of light adaptation, two additional tests were performed (3.0 cd*s/m2 and flicker 3.0 cd*s/m2). Both time (ms) and amplitude (µV) were obtained for each test on each eye. Single flash tests measured an a-wave and a b-wave. Oscillatory potentials measured five wave points and a sum. In the photopic flicker test, the first wave point is reported. Left and right eye measurements were combined and averaged for each test per primate. Measurements were recorded and displayed using the manufacturer's software. Recordings from ERG tests that were of poor quality or nonmeasurable were discarded.
Fundus Measurements
Fundus images were obtained in both monochromatic red-free and color. All measurements were made using red-free images, except in rare instances when the quality of the color image was superior to the former. Measurements were originally measured in pixels and then converted to millimeters based on the conversion factor for a 50° fundus camera of 194.98 pixels/mm.15 Images were rotated so that the vertical diameter (VD) of the optic nerve was maximized, such that the superotemporal and inferotemporal macular arcades of blood vessels were roughly parallel to one another. The measurements for the two eyes of each animal were combined and averaged. Measurements included the largest arterial and venous diameters at their crossing with the edge of the optic disc and the arterial–venous ratio was calculated as the diameter of the artery over the diameter of the vein. The maximum vertical and horizontal diameters (HDs) of the optic nerve were calculated. Macular parameters were measured, including the distance from the foveal center to the optic nerve center, and the distance from the foveal center to the nerve edge. The area of the foveal avascular zone (FAZ) was estimated using both fundus photos and fluorescein angiography (FA). Fluorescein was administered one time in a single bolus (0.025 mL/kg IV) through the saphenous vein of the hindlimb. It was administered slowly over the course of approximately 30 seconds to minimize the risk of nausea and vomiting. Higher doses were found to increase the risk of nausea and vomiting. Additionally, we measured the relative position of the foveal center with respect to the VD of the optic nerve head. The distance was measured from the nerve center point to the base of the optic nerve and was calculated as a percentage of the total optic nerve height.
Optical Coherence Tomography
OCT images were captured during a sedated examination of each primate. For each eye, an OCT image was chosen where the fovea had the greatest depth. Measurements were taken using the linear tool in ImageJ. The manufacturer's scale bars on the OCT image were used to calibrate the measurements. Thickness measurements of the retinal layers were taken at three locations: 1.5 mm temporal to the foveal center, at the foveal center, and 1.5 mm nasal to the foveal center. The layers measured included the nerve fiber layer (NFL), ganglion cell layer (GCL), inner plexiform layer (IPL), inner nuclear layer, outer plexiform layer, outer nuclear layer (ONL), photoreceptor inner segments, photoreceptor outer segments, retinal pigmented epithelium (RPE), choriocapillaris, outer choroid, and total retinal thickness. The layers measured in the foveal center were the inner retinal layer (IRL, including any combined contributions from the GCL, IPL, inner nuclear layer, but mainly the outer plexiform layer), ONL, inner segment, outer segment, RPE, choriocapillaris, and outer choroid. Average thicknesses were calculated at each of these three locations for each eye of each primate.
Quantitative AF Analysis
The methods for capturing qAF has been described by Delori et al.16 and Greenberg et al.17 In brief, after spectral-domain OCT was performed, the device was turned to qAF mode to capture 30° × 30° qAF images with excitation light of 488 nm and a long-pass barrier filter starting at 500 nm increasing to 80 nm, calibrated with an internal master fluorescence reference. Photobleaching was achieved by exposing the retina to 488 nm blue excitation light for 30 seconds. Images were captured from the central macula, with intensity adjusted using an internal fluorescence reference to enable quantification of AF and normalizing AF units given minor variations in laser power and detector sensitivity in between imaging sessions. For each eye, 3 series of 12 successive images were acquired in rapid succession; the mean image of the 3 sequences was computed using the manufacturer's qAF software module. Then, for each mean image, a Delori grid was centered on the fovea and expanded to the tangential edge of the optic nerve. The main measure for each image is the mean qAF8, which was acquired after selecting the middle eight segments to exclude vessels and other noise. Each image was then individually graded on a 0 to 3 scale (0 being unusable and 3 being the highest image quality) by two independent graders (K.H.L. and T.M.T.). The two independent graders reached consensus on each image's final grade and averaged the qAF8 for each eye to arrive at the final qAF8 measurement for each eye. Only images graded as 2 or 3 were included.
Statistical Analysis
Descriptive statistics were used to summarize demographic and all ocular measurement data. Panel regression was used to determine statistical significance (P < 0.05) treating each eye as the unit of analysis linked by the primate to account for within-subject correlation, and each primate's panel consisted of right eye and left eye measurements. Analyses were performed in Microsoft Excel (Microsoft Corporation, Redmond, WA States) and STATA 16 (StataCorp, College Station, TX).
Results
Data were collected from a total of 142 individuals. Ages of the rhesus macaques ranged from 0.7 to 29 years (mean, 16.4 ± 7.5 years). The age and sex distribution are shown in Figure 1.
Figure 1.
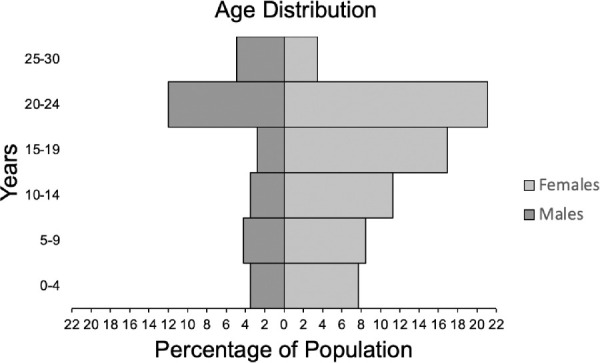
Age distribution of total rhesus macaques (n = 142) by sex (male and female). The mean age was 16.4 years (SD, 7.5 years). The median age was 19.2 years. Macaques were separated into six different age groups: 0 to 4 years, 5 to 9 years, 10 to 14 years, 20 to 24 years, and 25 to 30 years. The sex distributions of the age groups are: age group 0 to 4 years old (male, 5; female,11), age group 5 to 9 years old (male, 6; female, 12), age group 10 to 14 years old (male, 5; female,16), age group 15 to 19 years old (male, 4; female,24), age group 20 to 24 (male, 17; female,30), and age group 25 to 30 (male, 7; female,5).
IOP measurements were collected from a total of 142 individuals, 284 eyes, with an age range of 0.7 to 29.4 years (Fig. 2). The mean IOP was 18 ± 4 mm Hg in all animals; 17 ± 4 mm Hg in the right eye (OD) and 18 ± 5 mm Hg in the left eye (OS). The mean IOP in males was 19 ± 5 mm Hg and in females 17 ± 4 mm Hg. There was no statistical difference between right and left eyes (P = 0.369) or males and females (P = 0.088).
Figure 2.
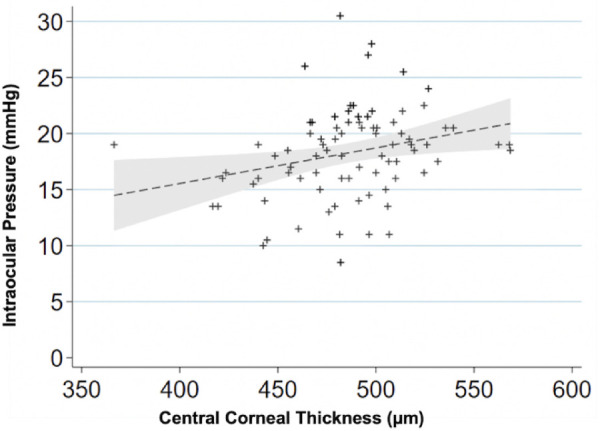
IOP variations with the CCT. Scatterplot showing relationship between corneal thickness (µm) and IOP (mm Hg) (n = 84 primates; 168 eyes). For every 50-µm increase in corneal thickness the IOP increases 1.5 mm Hg (P < 0.001). A linear regression line is fitted with a 95% confidence interval in the grey area.
The CCT measurements were collected from 84 primates, 168 eyes total (486 µm ± 38 µm) with no statistically significant difference between the sexes (P = 0.479). The ages of individuals ranged from 0.8 to 29.4 years. The IOP and CCT had a significant positive correlation (Fig. 2) with an increase of 1.5 ± 0.4 mm Hg for every 50 µm in CCT (P < 0.001). Lens thickness and axial length measurements were collected from 114 individuals, 228 eyes total with an age range of 0.7 to 29.4 years. The mean lens thickness was 4.24 ± 0.53 mm in all animals; 4.20 ± 0.23 mm in males and 4.25 ± 0.50 mm in females (Table 1). There was no significant difference between the sexes (P = 0.363). The axial length was greater in males (20.06 ± 0.95 mm) than in females (19.67 ± 0.96 mm) when using a generalized linear model to correlate the data from the two eyes of each animal (P = 0.046).
Table 1.
Ocular Biometry
| Male: Mean (SD) | Female: Mean (SD) | P Value (Males vs Females) | |
|---|---|---|---|
| Lens thickness (mm) | 4.2 (0.2) | 4.3 (0.5) | 0.363 |
| Axial length (mm) | 20.1 (1.0) | 19.7 (1.0) | 0.051 |
Axial length and lens thickness (n = 114; 228 eyes).
Retinal Findings and Fundus Measurements
Fundus imaging was performed on 78 individuals; 77 right eyes, 78 left eyes (Table 2). The ages of individuals ranged from 0.7 to 29.4 years. Fundus measurements for the 151 eyes with photographs (Fig. 34) are summarized in Table 2. The optic nerve had a maximal VD of 1.8 mm and the HD was 1.3 mm. The disc–fovea distance in rhesus monkeys was 4.1 ± 0.3 mm. The fovea of the rhesus macaque sits 32.9% up the optic nerve VD. This results in a disc–fovea angle of approximately 8.2°. The diameter of the main branches of the central retinal artery and vein at the point of crossing the edge of the optic disc are 50.5 µm and 125.4 µm, respectively. The arterial–venous ratio was calculated to be 0.43 ± 0.14. The apparent FAZ using fundus photography was 0.4 ± 0.2 mm2. The ratio of the VD (0.6 mm) to HD (0.9 mm) was 0.70 ± 0.19. When measuring FAZ area with FA, similar values were found, 0.4 ± 0.1 mm2 (n = 17; eyes = 27). The VD was 0.6 mm and the HD was 0.8 mm. The vertical to horizontal ratio using FA was 0.68 ± 0.18. For primates that had both fundus imaging and FA images (n = 9; eyes = 11) the FAZ measured 0.5 ± 0.1 mm2 and 0.3 ± 0.1 mm2, respectively. The age range for this subset of individuals was 2.9 to 23.8 years.
Table 2.
Fundus Measurements (n = 78 Primates, 155 Eyes)
| All Animals: Mean (SD) | OD: Mean (SD) | OS: Mean (SD) | P Value (OD vs OS) | Male: Mean (SD) | Female: Mean (SD) | P Value (Males vs Females) | |
|---|---|---|---|---|---|---|---|
| Artery (µm diameter) | 50.4 (13.8) | 51.8 (14.1) | 49.1 (13.4) | 0.220 | 53.0 (9.4) | 49.3 (11.6) | 0.150 |
| Vein (µm diameter) | 125.4 (25.1) | 124.4 (26.1) | 126.4 (24.2) | 0.616 | 132.6 (22.9) | 122.7 (21.2) | 0.094 |
| Height of nerve (µm) | 1810.4 (143.7) | 1816.7 (137.5) | 1804.2 (150.8) | 0.590 | 1814.3 (144.9) | 1808.2 (135.8) | 0.868 |
| Width of nerve (µm) | 1279.2 (127.2) | 1282.5 (127.7) | 1275.8 (128.2) | 0.745 | 1276.6 (148.6) | 1280.6 (112.4) | 0.910 |
| Foveal Center to Nerve Center (µm) | 4110.8 (287.0) | 4068.0 (287.9) | 4153.1 (282.4) | 0.065 | 4117.4 (258.9) | 4110.6 (264.5) | 0.919 |
| Foveal center to nerve edge (µm) | 3441.8 (281.2) | 3390.1 (279.4) | 3492.9 (276.2) | 0.022 | 3445.8 (224.5) | 3442.5 (261.4) | 0.959 |
| How high up the nerve? (µm) | 595.6 (218.0) | 636.1 (221.4) | 555.6 (208.4) | 0.021 | 574.0 (155.3), | 600.9 (173.8), | 0.516 |
| and %percentage of nerve height | 32.9% | 35.1% | 30.8% | (31.6%) | (33.3%) | ||
| Area of avascularization (µm2) | 410.3 (153.3) | 405.2 (158.9) | 410.7 (147.7) | 0.824 | 394.0 (132.8) | 413.1 (159.9) | 0.453 |
| Area of avascularization with FA (µm2) | 372.1 (140.9) | 345.5 (106.5) | 396.8 (167.0) | 0.349 | 330.9 (128.7) | 400.4 (145.9) | 0.205 |
FA, fluorescein angiogram; OD, right eye; OS, left eye.
Figure 3.

Fundus images and measurements (n = 78 primates; 155 eyes). (A) Red-free fundus photo with measurements. The arrows represent measurements taken. A, artery (diameter); B, vein (diameter); C, height of the optic nerve; D, width of the optic nerve; E, foveal center to nerve center; F, foveal center to nerve edge; G, relative position of the foveal center from base of the optic nerve; H, area of avascularization. (B) Fluorescein angiogram showing the FAZ measurement.
Figure 4.

OCT images and measurements. Measurement of retinal and choroidal layers (n = 60 primates; 98 eyes). White arrow A is 1000 µm from the foveal center. All retinal layers were measured at this distance on both temporal and nasal sides. Total retinal thickness is measured from the NFL (NFL) to the retinal pigment epithelium (RPE). CC, choriocapillaris; IS, inner segments; INL, inner nuclear layer; OC, outer choroid; OPL, outer plexiform layer; TRT, total retinal thickness.
Some differences between the left and right eyes were identified. The distance from the foveal center to the optic nerve edge between the OD and the OS measured 3.4 ± 0.3 mm in the OD and 3.5 ± 0.3 mm in the OS (P = 0.022). The relative distance of the foveal center up the optic nerve vertical height measured 0.64 ± 0.22 mm (35.1%) the OD and 0.55 ± 0.21 mm (30.8%) the OS (P = 0.021). The biological relevance of this left–right axis asymmetry is unclear. There were no significant differences between male and female in any of the fundus measurements.
Electroretinography
Full-field ERG measurements were collected from 75 individuals, 150 eyes total with ages ranging from 0.7 to 29.4 years. The average amplitudes and latencies from dark-adapted and light-adapted tests are shown in Table 3. The full-field ERG algorithm resulted in a-wave (chiefly representing photoreceptor activity) and b-wave (largely representing bipolar cell activity) times and amplitudes. The dark-adapted dim stimulus test (0.01) represents rod pathway function. The dark-adapted bright flash tests (3.0 and 10.0) correspond with the combined responses of the rod and cone pathways. Cone pathways are the main contributor to the light adapted tests (3.0 and flicker). Oscillatory potentials, a representation of extracellular electrical currents between bipolar, amacrine, and ganglion cells in the IPL,18–20 were also calculated and presented.
Table 3.
Full-Field ERG Measurements
| Latency (ms) | Amplitude (µV) | ||||
|---|---|---|---|---|---|
| Mean | SD | Mean | SD | ||
| Dark 0.01 | b-Wave | 87.9 | 14.2 | 68.8 | 45.2 |
| Dark 3.0 | a-Wave | 18.2 | 2.3 | −90.9 | 37.0 |
| b-Wave | 45.1 | 5.3 | 191.6 | 73.2 | |
| Dark 10.0 | a-Wave | 15.6 | 2.2 | −122.5 | 47.2 |
| b-Wave | 45.4 | 6.0 | 207.2 | 80.1 | |
| Light 3.0 | a-Wave | 15.0 | 1.2 | −16.4 | 7.6 |
| b-Wave | 28.9 | 1.7 | 68.3 | 29.9 | |
| Flicker | Amplitude | 25.5 | 1.4 | 51.0 | 22.2 |
| OP1 | Amplitude | 18.3 | 2.0 | 14.8 | 10.9 |
| OP2 | Amplitude | 24.9 | 2.3 | 12.4 | 8.4 |
| OP3 | Amplitude | 31.7 | 2.7 | 16.3 | 11.1 |
| OP4 | Amplitude | 39.4 | 2.8 | 11.5 | 7.3 |
| OP5 | Amplitude | 46.0 | 2.8 | 5.5 | 4.1 |
| OP sum | Amplitude | 145.3 | 15.2 | 57.8 | 34.5 |
OP, oscillatory potential.
Dark 0.01 (n = 73; eyes = 146).
Dark 3.0, Dark 10.0, Flicker, OPs 1–4 and sum (n = 75; eyes = 150).
Light 3.0 (n = 71; eyes = 142).
OP5 (n = 65; eyes = 130).
OCT Segmentation
Tomographic images of the macula were obtained from 60 individuals with 49 right eyes and 49 left eyes and the thickness of each retinal layer was measured (Figure 4, Table 4). The ages of these individuals ranged from 0.8 to 29.4 years. To determine if the retinal NFL and GCLs measured on the macular OCT have a relationship with IOP measured in the eye, we plotted the combined NFL + GCL thickness of each eye against the IOP measured in that eye (Fig. 5). A linear regression was performed after correlating the eyes of each individual animal, which revealed the NFL + GCL thickness decreased with increased IOP, both nasal (Fig. 5A) (0.6 µm for each 1 mm Hg increased IOP; P = 0.035) and temporal (Fig. 5B) (0.9 µm for each 1 mm Hg increased IOP; P = 0.001) to the foveal center.
Table 4.
Retinal Structural Measurements From OCT (n = 60 Primates; 98 Eyes)
| Nasal (Mean) | Nasal (SD) | Temporal (Mean) | Temporal (SD) | Fovea (Mean) | Fovea (SD) | |
|---|---|---|---|---|---|---|
| NFL (µm) | 21.4 | 5.8 | 15.4 | 3.1 | ||
| GCL (µm) | 39.4 | 8.7 | 33.3 | 8.9 | 16.0 | 4.7 |
| IPL (µm) | 49.6 | 7.3 | 47.8 | 6.6 | ||
| INL (µm) | 44.0 | 5.4 | 41.6 | 6.0 | ||
| OPL (µm) | 26.9 | 4.0 | 26.9 | 5.6 | ||
| ONL (µm) | 63.0 | 7.5 | 61.1 | 7.2 | 82.2 | 15.7 |
| IS (µm) | 35.4 | 3.5 | 34.9 | 4.1 | 39.5 | 4.4 |
| Outer segment (µm) | 23.1 | 4.1 | 23.8 | 5.1 | 37.6 | 6.7 |
| RPE (µm) | 33.8 | 5.2 | 34.6 | 5.7 | 29.7 | 5.2 |
| CC (µm) | 10.9 | 4.2 | 12.1 | 4.7 | 11.8 | 4.2 |
| OC (µm) | 194.3 | 65.8 | 198.4 | 62.8 | 200.9 | 60.6 |
| TRT (µm) | 336.6 | 17.6 | 319.4 | 17.2 | 205.1 | 18.8 |
CC, choriocapillaris; INL, inner nuclear layer; IS, inner segments of photoreceptors; OC, outer choroid; OPL, outer plexiform layer; RPE, retinal pigment epithelium; TRT, total retinal thickness.
Figure 5.

Relationship between IOP and retinal NFL and GCL. (A) Scatterplot showing relationship between IOP (mm Hg) and NFL + GCL nasal side (µm). NFL + GCL decreased by a factor of 0.6 µm per 1 mm Hg increase (P = 0.035). A linear regression line that has been fitted with a 95% confidence interval in the grey area. (B) Scatterplot showing relationship between IOP (mm Hg) and NFL + GCL temporal side (µm). The NFL + GCL decreased by a factor of 0.9 µm per 1 mm Hg increase (P = 0.001). A linear regression line that has been fitted with a 95% confidence interval in the grey area.
Quantitative AF Analysis
The qAF8 data were included from 66 eyes of 44 individuals, while 57 eyes from 38 individuals were discarded for poor quality (54.4% inclusion rate). The ages of these individuals ranged from 4.2 to 27.2 years. A typical en face image in Heidelberg's qAF mode is shown in Figure 6A. The values of the eight segments of the middle ring of the pattern (qAF8) were analyzed. The mean qAF8 value for all individuals was 91.4 AF units (standard deviation of 31.6). No difference was observed in qAF8 between male and female sexes (P = 0.104).
Figure 6.

Quantitative AF analysis (n = 44 primates; 66 eyes). (A) To acquire qAF8, the eight middle segments (numbered octants) of the perifoveal Delori grid was used in Heidelberg's qAF mode. The center circle is placed over the foveal center and the grid is expanded until it touches the tangential edge of the optic nerve. Vessels are automatically excluded and the qAF measurements in each octant are normalized to the internal AF standard shown in the blue bar at the top of the image. (B) Sex distribution of qAF8 in male and female animals (P = 0.104). Males (mean, 80.1 ± 28.7). Females (mean, 94.7 ± 31.6). The line represents mean value in AF units (y-axis).
Discussion
Structural Similarities to Human Eyes: IOP, CCT, Lens Thickness, Axial Length, and Fundus Structural Measurements
The development of the rhesus macaque has been documented in reference to human ages.21,22 Early ocular development in rhesus has been studied23–24 and the eye of the rhesus macaque shares many anatomic similarities to the human eye. The mean IOP was 18 ± 4 mm Hg and comparable with normal human IOP values, which range between 10 and 21 mm Hg with little variation across human ethnicities.25–27 A comparison between rhesus macaques and humans is represented in Table 5.
Table 5.
Comparison of Mean IOP (Mean ± Standard Deviation)
The CCT was 486.0 ± 37.6 µm in our cohort and is mildly thinner than humans 535 ± 31 µm.28 In that meta-analysis, there was a positive correlation of 1.1 ± 0.6 mm Hg in IOP change for each 10% change (approximately 50 µm) in CCT. We found a similar change between IOP and corneal thickness of approximately 1.5 ± 0.4 mm Hg (P < 0.001).
The macaque lens is 4.24 ± 0.41 mm in thickness for our cohort with an average age of 15.8 years old. The human lens has been found to thicken at a rate of approximately 24 µm per year after the age of 10 years old,29 thus making the macaque lens equivalent to a 55-year-old human. More precise measurement of normal emmetropic human eyes revealed axial length measurements of about 23.3 ± 0.5 mm with broader variation among ametropic individuals.30 Therefore, the rhesus macaque eye is approximately 85% the size of the human eye.
The optic nerve in the rhesus macaque had a VD of 1.8 mm and a HD of 1.3 mm, resulting in a vertical to horizontal ratio of 1.42 ± 0.10. Another study also documented a similar vertical to horizontal ratio of 1.39 ± 0.09 in 17 rhesus macaques.31 In humans, the optic disc is more circular, with a VD of 1.88 mm and a HD 1.77 mm.32 The disc–fovea distance is consistent between adult humans and has been reported as 4.78 ± 0.06 mm.33 This finding has been confirmed in a large study of 2836 eyes and was reported as 4.76 ± 0.34 mm.34 The disc–fovea distance in rhesus monkeys was 4.1 ± 0.3 mm, consistent with the slightly (approximately 14%) smaller rhesus eye. The human optic nerve head area was 2.79 mm2,33 and we report 2.3 mm2 revealing the rhesus macaque optic disc area is approximately 83% of its human counterparts. Notably, the rhesus eye measures 85% of the human eye in axial length and 86% of the human eye in disc–fovea distance, suggesting consistent interspecies anatomic proportionality.
The disc–fovea angle in a large cohort of people was reported as 7.76 ± 3.63°.35 This finding results in the fovea lying 0.65 mm upward from the inferior edge of the optic disc, approximately 34.6% (0.65/1.88 mm) to the top of the optic disc height. The fovea of the rhesus macaque eye sits 32.9% up the optic nerve height. This results in a disc–fovea angle of approximately 8.2°. In humans, the thickness of the main branches of the central retinal artery and vein at the point of crossing the edge of the optic disc have been reported as 169.8 µm and 242.1 µm, respectively.36 The corresponding values from the rhesus macaque retina are 50.5 µm and 125.4 µm, respectively. Our reported arterial–venous ratio for males (0.42 ± 0.11) and females (0.41 ± 0.13) are both lower than that reported in both male (0.87 ± 0.08) and female (0.89 ± 0.08) humans.37 The FAZ is 0.27 mm2 in healthy humans using OCT angiography, which reveals the retinal microvasculature with very high resolution.38 In the macaque, the FAZ was 0.4 ± 0.2 mm2 with a VD of 0.6 mm and a HD of 0.9 mm. This value may be an overestimation because these measurements were based on fundus photography, a modality incapable of showing the microvasculature at the innermost FAZ boundary. By using FA, a more accurate representation of the FAZ was visible and corresponded with 0.4 ± 0.1 mm2 with a VD of 0.6 mm and a HD of 0.8 mm. When comparing FAZ areas within the same individuals, the difference between the imaging modalities is more clearly seen. The FAZ using fundus imaging was 0.5 ± 0.1 mm2 and using FA was 0.3 ± 0.1 mm2.
ERG Similarities to Human Eyes
Significant work has been done studying the ERG in monkeys.39–48 Electroretinographic recordings in rhesus macaque are similar to humans and other NHPs. Standardized ERG measurements in the Green Monkey (Chlorocebus sabaeus) showed similar latency results as those reported here (Table 6).49 In comparison with human data, the monkey ERG has an overall similar latency to the human. However, the monkey amplitudes seem to be larger when compared with humans, perhaps owing to the recording conditions. The human amplitudes in the referenced studies may be lower because of the electrode type and lack of dilation in those studies. Liu et al.50 determined a mean latency for dark 0.01 b-wave (83 ms) and dark 3.0 a-wave (15 ms) and b-wave (44 ms). Our results for each of these tests were 87.9 ms, 18.2 ms, and 45.1 ms, respectively. These latency results correlate to humans across all age groups (ranging <20 years to 40–70 years old).50 Overall, NHP waveforms are similar to human ERGs. There is a precedent for sex differences in multifocal ERG recordings in rhesus macaque and cynomolgus macaques.51 In this study, we did not report multifocal ERG data and we did not observe differences between sexes using our full field ERG instrument.
Table 6.
Comparison of Mean ERG Values
| Rhesus Macaque | Green Monkey49 | Human*50 | |||||
|---|---|---|---|---|---|---|---|
| Latency (ms) | Amplitude (µV) | Latency (ms) | Amplitude (µV) | Latency (ms) | Amplitude (µV) | ||
| Dark 0.01 | b-Wave | 87.9 | 68.8 | 79.9 | 88.9 | 83 | 41 |
| Dark 3.0 | a-Wave | 18.2 | −90.9 | 14.8 | −115.1 | 15 | −39 |
| b-Wave | 45.1 | 191.6 | 36.7 | 203.7 | 44 | 61 | |
| Dark 10.0 | a-Wave | 15.6 | −122.5 | 9.8 | −174.9 | 11 | −44 |
| b-Wave | 45.4 | 207.2 | 30.8 | 230.7 | 47 | 64 | |
| Light 3.0 | a-Wave | 15.0 | −16.4 | −12.3 | 22.1 | 11 | −6 |
| b-Wave | 28.9 | 68.3 | 27.7 | 81.5 | 28 | 26 | |
| Flicker | Amplitude | 25.5 | 51.0 | 24.3 | 88.9 | 25 | 29 |
| OP1 | Amplitude | 18.3 | 14.8 | ||||
| OP2 | Amplitude | 24.9 | 12.4 | ||||
| OP3 | Amplitude | 31.7 | 16.3 | ||||
| OP4 | Amplitude | 39.4 | 11.5 | ||||
| OP5 | Amplitude | 46.0 | 5.5 | ||||
| OP sum | Amplitude | 145.3 | 57.8 | 20.3 | 60.2 | ||
Median data.
Retinal OCT and qAF Similarities to Human Eyes
The functional and structural characterization of a macular lesion in the rhesus macaque has been reported using OCT, ERG, and histology.52 Yiu et al.53 performed measurements on six macaques (>6 years of age) using semiautomated segmentation of OCT images (comparison shown in Table 7). Overall, our inner retinal layers thicknesses measured closely to theirs, with the exception of the ONL and the outer segment. These differences may be due to the focal measurements we took at 1.5 mm nasal and temporal to the foveal pit rather than across the entire central macular b-scan, or the subtle differences between landmarks used at the OS–RPE boundary, or the larger number of NHP eyes across a broader spectrum of ages. Because rhesus macaques generally reach adulthood at around 5 years of age,21 our generally older cohort of macaques may have resulted in small variations in outer retinal layers.
Table 7.
Comparison of Retinal Structural Measurements Using OCT (Mean ± Standard Deviation)
| Parafoveal (RM) | Parafoveal53 (RM) | Parafoveal55 (CM) | Parafoveal54 (H) | Foveal (RM) | Foveal53 (RM) | Foveal55 (CM*) | Foveal54 (H) | |
|---|---|---|---|---|---|---|---|---|
| NFL (µm) | 18 ± 4 | 20.6 ± 2.9 | 34 | 16 ± 5 | 9.2 ± 2.3 | 4 ± 3 | ||
| GCL (µm) | 36 ± 9 | 34.5 ± 4.1 | 72 | 89 | 12.1 ± 3.7 | 25 | 56 ± 5 | |
| IPL (µm) | 49 ± 7 | 45.3 ± 4.9 | 62 | 10.6 ± 5.1 | 45 | |||
| INL (µm) | 43 ± 6 | 39.8 ± 4.9 | 77 | 38 | 12.5 ± 4.6 | 50 | 23.3 ± 3 | |
| OPL (µm) | 27 ± 5 | 27.1 ± 2.9 | 62 | 39 | 13.5 ± 5.9 | 175 | 38 ± 7 | |
| ONL (µm) | 62 ± 7 | 77.6 ± 8.5 | 48 | 81 | 82 ± 16 | 96.5 ± 15.3 | 50 | 102 ± 7 |
| IS (µm) | 35 ± 4 | 32.5 ± 1.4 | 48 | 40 ± 4 | 34.0 ± 1.9 | 35 | ||
| Outer segment (µm) | 24 ± 5 | 39.4 ± 2.6 | 29 | 37 | 38 ± 7 | 47.0 ± 3.2 | 50 | 42 ± 5 |
| RPE (µm) | 34 ± 6 | 15.5 ± 2.1 | 38 | 30 ± 5 | 14.7 ± 2.8 | 55 | ||
| CC (µm) | 12 ± 5 | 24.0 ± 4.3 | 12 ± 4 | 23.8 ± 5.5 | ||||
| OC (µm) | 196 ± 64 | 171.0 ± 21.3 | 201 ± 61 | 174.1 ± 18.2 |
CC, choriocapillaris; CM, cynomolgus monkey; H, human; INL, inner nuclear layer; IS, inner segments of photoreceptors; OC, outer choroid; OPL, outer plexiform layer; RM, rhesus macaque; RPE, retinal pigment epithelium; TRT, total retinal thickness.
* Measurements were taken from closest measurement to foveal center.
Consistent with human studies, OCT layers measured slightly thicker on the nasal side compared with the temporal side owing to the thicker NFL on the nasal aspect of the macula.54 Variations in the definitions of the layers and also measurement of combinations of layers (e.g., IPL + GCL) make accurate comparisons across these studies difficult. OCT imaging of the cynomolgus monkey (Macaca fascicularis) is proportionally thicker in the GCL, IPL, inner nuclear layer, outer plexiform layer, and inner segment retinal layers and a thinner ONL than both rhesus macaque and human studies (Table 7).55 These anatomic differences between monkey species support the use of the rhesus macaque as a more precise model for the human retina. The decrease of NFL + GCL layer in correspondence with an increase in IOP further supports the use of rhesus macaques as a glaucoma model. Previous studies have shown significance in using rhesus macaques as experimental glaucoma models56,57 and the NHP optic nerve has been described using OCT in the context of experimental glaucoma.58
AF imaging has been used to reveal structural detail within the macaque eye.59,60 In rhesus macaques, qAF was significantly lower than in humans with our average of 91.4 qAF units. Human studies have shown a mean of 253.6 to 283.9 qAF units.17,61 Previous studies in rhesus macaques have demonstrated elevated qAF in animals deficient in macular xanthophylls, such as lutein and zeaxanthin.62 Rhesus macaques also have a darker uveal pigmentation than humans owing to increased melanin from choroidal melanocytes, although the difference in RPE melanin content is unclear.63 Melanin is known to contribute to the fundus AF.64 The increased choroidal pigmentation in macaques may explain in part the qAF difference between rhesus and human. We did not observe a significant difference between the sexes (P = 0.104), although it has been shown in human data that males have slightly lower qAF than females.17,61
The summary of all collected ocular biometric data from our study show that the rhesus macaque eye is proportional to and highly similar in every measurable aspect to the human eye, while being roughly 15% smaller. The positive correlation between CCT and measured IOP was also confirmed. Furthermore, we have shown that IOP correlates with thinner NFL + GCL layer on OCT, prompting future investigation into the degree to which primary open angle glaucoma is recapitulated in rhesus macaques. Our findings support the use of the NHP eye as a model for advanced translational vision science research, especially those related to macular and cone disorders.
Acknowledgments
The authors thank Monica Motta and Michelle Ferneding for expertise in ophthalmic imaging, electrophysiology, data management, and research support.
Ala Moshiri is supported by NIH K08 EY027463, NIH U24 EY029904, and Barr Foundation for Retinal Research. Sara M. Thomasy is supported by NIH R01 EY016134, and NIH U24 EY029904. Timothy Stout, Rui Chen, and Jeffrey Rogers are supported by NIH U24 EY029904. This research was also supported by an unrestricted grant from Research to Prevent Blindness to Baylor College of Medicine. Glenn C. Yiu is supported by NIH K08 EY026101, NIH R21 EY031108, the Brightfocus Foundation, and Macula Society. Tu M. Tran was supported by Fight for Sight SS-19-001. No funding organizations had any role in the design or conduct of this research. The content is solely the responsibility of the authors and does not necessarily represent the official views of the funding agencies.
Disclosure: K.H. Lin, None; T. Tran, None; S. Kim, None; S. Park, None; J.T. Stout, None; R. Chen, None; J. Rogers, None; G. Yiu, None; S. Thomasy, None; A. Moshiri, None
References
- 1. Freeberg FE, Nixon GA, Reer PJ, et al.. Human and rabbit eye responses to chemical insult. Fundam Appl Toxicol . 1986; 7(4): 626–634. [DOI] [PubMed] [Google Scholar]
- 2. Regal S, O'Connor D, Brige P, Delattre R, Djenizian T, Ramuz M. Determination of optical parameters of the porcine eye and development of a simulated model. J Biophotonics. 2019; 12(11): e201800398. [DOI] [PubMed] [Google Scholar]
- 3. Vilupuru AS, Glasser A.. Optical and biometric relationships of the isolated pig crystalline lens. Ophthalmic Physiol Opt. 2001; 21(4): 296–311. [DOI] [PubMed] [Google Scholar]
- 4. Heichel J, Wilhelm F, Kunert KS, Hammer T.. Topographic findings of the porcine cornea. Med Hypothesis Discov Innov Ophthalmol. 2016; 5(4): 125–131. [PMC free article] [PubMed] [Google Scholar]
- 5. Zhang Q, Acland GM, Wu WX, et al.. Different RPGR exon ORF15 mutations in Canids provide insights into photoreceptor cell degeneration. Hum Mol Genet. 2002; 11(9): 993–1003. [DOI] [PubMed] [Google Scholar]
- 6. Zeiss CJ, Acland GM, Aguirre GD.. Retinal pathology of canine X-linked progressive retinal atrophy, the locus homologue of RP3. Invest Ophthalmol Vis Sci. 1999; 40(13): 3292–3304. [PubMed] [Google Scholar]
- 7. Picaud S, Dalkara D, Marazova K, Goureau O, Roska B, Sahel JA.. The primate model for understanding and restoring vision. Proc Natl Acad Sci USA. 2019; 116(52): 26280–26287. [DOI] [PMC free article] [PubMed] [Google Scholar]
- 8. Ribka EP, Dubielzig RR.. Multiple ophthalmic abnormalities in an infant rhesus macaque (Macaca mulatta). J Med Primatol. 2008; 37(suppl 1): 16–19. [DOI] [PMC free article] [PubMed] [Google Scholar]
- 9. Moshiri A, Chen R, Kim S, et al.. A nonhuman primate model of inherited retinal disease. J Clin Invest. 2019; 129(2): 863–874. [DOI] [PMC free article] [PubMed] [Google Scholar]
- 10. Burgoyne CF. The non-human primate experimental glaucoma model. Exp Eye Res. 2015; 141: 57–73. [DOI] [PMC free article] [PubMed] [Google Scholar]
- 11. Yang H, Reynaud J, Lockwood H, et al.. The connective tissue phenotype of glaucomatous cupping in the monkey eye - clinical and research implications. Prog Retin Eye Res. 2017; 59: 1–52. [DOI] [PMC free article] [PubMed] [Google Scholar]
- 12. Sparrow JR, Duncker T, Schuerch K, Paavo M, de Carvalho JRL Jr.. Lessons learned from quantitative fundus autofluorescence. Prog Retin Eye Res. 2020; 74: 100774. [DOI] [PMC free article] [PubMed] [Google Scholar]
- 13. Gliem M, Müller PL, Birtel J, et al.. Quantitative fundus autofluorescence and genetic associations in macular, cone, and cone-rod dystrophies. Ophthalmol Retina. 2020; 4(7): 737–749. [DOI] [PubMed] [Google Scholar]
- 14. Gliem M, Müller PL, Finger RP, et al.. Quantitative fundus autofluorescence in early and intermediate age-related macular degeneration. JAMA Ophthalmol. 2016; 134(7): 817–824. [DOI] [PubMed] [Google Scholar]
- 15. Knaapi L, Aarnisalo E, Vesti E, Leinonen MT.. Clinical verification of the formula of Bennett et al. (1994) of determining the size of retinal features by fundus photography. Acta Ophthalmol. 2015; 93(3): 248–252. [DOI] [PubMed] [Google Scholar]
- 16. Delori F, Greenberg JP, Woods RL, et al.. Quantitative measurements of autofluorescence with the scanning laser ophthalmoscope. Invest Ophthalmol Vis Sci. 2011; 52(13): 9379–9390. [DOI] [PMC free article] [PubMed] [Google Scholar]
- 17. Greenberg JP, Duncker T, Woods RL, Smith RT, Sparrow JR, Delori FC. (2013). Quantitative fundus autofluorescence in healthy eyes. Invest Ophthalmol Vis Sci. 2013; 54(8): 5684–5693. [DOI] [PMC free article] [PubMed] [Google Scholar]
- 18. Wachtmeister L, Dowling JE.. The oscillatory potentials of the mudpuppy retina. Invest Ophthalmol Vis Sci. 1978; 17(12): 1176–1188. [PubMed] [Google Scholar]
- 19. Yonemura D, Kawasaki K.. New approaches to ophthalmic electrodiagnosis by retinal oscillatory potential, drug-induced responses from retinal pigment epithelium and cone potential. Doc Ophthalmol. 1979; 48(1): 163–222. [DOI] [PubMed] [Google Scholar]
- 20. Heynen H, Wachtmeister L, van Norren D.. Origin of the oscillatory potentials in the primate retina. Vision Res. 1985; 25(10): 1365–1373. [DOI] [PubMed] [Google Scholar]
- 21. Simmons HA. Age-associated pathology in Rhesus macaques (Macaca mulatta). Vet Pathol. 2016; 53(2): 399–416. [DOI] [PMC free article] [PubMed] [Google Scholar]
- 22. Colman RJ, Anderson RM, Johnson SC, et al.. Caloric restriction delays disease onset and mortality in rhesus monkeys. Science. 2009; 325(5937): 201–204. [DOI] [PMC free article] [PubMed] [Google Scholar]
- 23. Qiao-Grider Y, Hung LF, Kee CS, Ramamirtham R, Smith EL 3rd. Normal ocular development in young rhesus monkeys (Macaca mulatta). Vision Res. 2007; 47(11): 1424–1444. [DOI] [PMC free article] [PubMed] [Google Scholar]
- 24. Qiao-Grider Y, Hung LF, Kee CS, Ramamirtham R, Smith EL 3rd. A comparison of refractive development between two subspecies of infant rhesus monkeys (Macaca mulatta). Vision Res. 2007; 47(12): 1668–1681. [DOI] [PMC free article] [PubMed] [Google Scholar]
- 25. Leydhecker W, Akiyama K, Neumann HG.. Intraocular pressure in normal human eyes. Klin Monbl Augenheilkd Augenarztl Fortbild. 1958; 133(5): 662–670. [PubMed] [Google Scholar]
- 26. Hollows FC, Graham PA.. Intra-ocular pressure, glaucoma, and glaucoma suspects in a defined population. Br J Ophthalmol. 1966; 50(10): 570–586. [DOI] [PMC free article] [PubMed] [Google Scholar]
- 27. Wang YX, Xu L, Wei WB, Jonas JB.. Intraocular pressure and its normal range adjusted for ocular and systemic parameters. The Beijing Eye Study 2011. PLoS One . 2018; 13(5): e0196926. [DOI] [PMC free article] [PubMed] [Google Scholar]
- 28. Doughty MJ, Zaman ML.. Human corneal thickness and its impact on intraocular pressure measures: a review and meta-analysis approach. Surv Ophthalmol . 2000; 44(5): 367–408. [DOI] [PubMed] [Google Scholar]
- 29. Dubbelman M, Van Der Heijde GL, Weeber HA.. The thickness of the aging human lens obtained from corrected Scheimpflug images. Optom Vis Sci. 2001; 78(6): 411–416. [DOI] [PubMed] [Google Scholar]
- 30. Bhardwaj V, Rajeshbhai GP.. Axial length, anterior chamber depth-a study in different age groups and refractive errors. J Clin Diagn Res. 2018; 7(10): 2211–2212. [DOI] [PMC free article] [PubMed] [Google Scholar]
- 31. Jonas JB, Hayreh SS.. Ophthalmoscopic appearance of the normal optic nerve head in Rhesus monkeys. Invest Ophthalmol Vis Sci. 2000; 41(10): 2978–2983. [PubMed] [Google Scholar]
- 32. Quigley HA, Brown AE, Morrison JD, Drance SM.. The size and shape of the optic disc in normal human eyes. Arch Ophthalmol. 1990; 108(1): 51–57. [DOI] [PubMed] [Google Scholar]
- 33. Mok KH, Lee VW.. Disc-to-macula distance to disc-diameter ratio for optic disc size estimation. J Glaucoma. 2002; 11(5), 392–395. [DOI] [PubMed] [Google Scholar]
- 34. Jonas RA, Wang YX, Yang H, et al.. Optic disc - fovea distance, axial length and parapapillary zones. The Beijing Eye Study 2011. PLoS One . 2015; 10(9): e0138701. [DOI] [PMC free article] [PubMed] [Google Scholar]
- 35. Jonas RA, Wang YX, Yang H, et al.. Optic disc—fovea angle: the Beijing Eye Study 2011. PLoS One. 2015; 10(11):e0141771. [DOI] [PMC free article] [PubMed] [Google Scholar]
- 36. Knudtson MD, Lee KE, Hubbard LD, Wong TY, Klein R, Klein BE.. Revised formulas for summarizing retinal vessel diameters. Curr Eye Res. 2003; 27(3): 143–149. [DOI] [PubMed] [Google Scholar]
- 37. Wong TY, Klein R, Klein BEK, Meuer SM, Hubbard LD.. Retinal vessel diameters and their associations with age and blood pressure. Invest Ophthalmol Vis Sci. 2003; 44(11): 4644–4650. [DOI] [PubMed] [Google Scholar]
- 38. Ghassemi F, Mirshahi R, Bazvand F, Fadakar K, Faghihi H, Sabour S.. The quantitative measurements of foveal avascular zone using optical coherence tomography angiography in normal volunteers. J Curr Ophthalmol. 2017; 29(4): 293–299. [DOI] [PMC free article] [PubMed] [Google Scholar]
- 39. Kondo M, Sieving PA.. Primate photopic sine-wave flicker ERG: vector modeling analysis of component origins using glutamate analogs. Invest Ophthalmol Vis Sci. 2001; 42(1): 305–312. [PubMed] [Google Scholar]
- 40. Frishman LJ, Sieving PA.. Evidence for two sites of adaptation affecting the dark-adapted ERG of cats and primates. Vision Res. 1995; 35(3): 435–442. [DOI] [PubMed] [Google Scholar]
- 41. Wakabayashi K, Gieser J, Sieving PA.. Aspartate separation of the scotopic threshold response (STR) from the photoreceptor a-wave of the cat and monkey ERG. Invest Ophthalmol Vis Sci. 1988; 29(11): 1615–1622. [PubMed] [Google Scholar]
- 42. Kondo M, Sieving PA.. Post-photoreceptoral activity dominates primate photopic 32-Hz ERG for sine-, square-, and pulsed stimuli. Invest Ophthalmol Vis Sci. 2002; 43(7): 2500–2557. [PubMed] [Google Scholar]
- 43. Khan NW, Kondo M, Hiriyanna KT, Jamison JA, Bush RA, Sieving PA.. Primate retinal signaling pathways: suppressing ON-pathway activity in monkey with glutamate analogues mimics human CSNB1-NYX genetic night blindness. J Neurophysiol. 2005; 93(1): 481–492. [DOI] [PubMed] [Google Scholar]
- 44. Bush RA, Sieving PA.. Inner retinal contributions to the primate photopic fast flicker electroretinogram. J Opt Soc Am A Opt Image Sci Vis. 1996; 13(3): 557–565. [DOI] [PubMed] [Google Scholar]
- 45. Jamison JA, Bush RA, Lei B, Sieving PA.. Characterization of the rod photoresponse isolated from the dark-adapted primate ERG. Vis Neurosci. 2001; 18(3): 445–455. [DOI] [PubMed] [Google Scholar]
- 46. Bush RA, Sieving PA.. A proximal retinal component in the primate photopic ERG a-wave. Invest Ophthalmol Vis Sci. 1994; 35(2): 635–645. [PubMed] [Google Scholar]
- 47. Lei B, Bush RA, Milam AH, Sieving PA.. Human melanoma-associated retinopathy (MAR) antibodies alter the retinal ON-response of the monkey ERG in vivo. Invest Ophthalmol Vis Sci. 2000; 41(1): 262–266. [PubMed] [Google Scholar]
- 48. Sieving PA, Murayama K, Naarendorp F.. Push-pull model of the primate photopic electroretinogram: a role for hyperpolarizing neurons in shaping the b-wave. Vis Neurosci. 1994; 11(3): 519–532. [DOI] [PubMed] [Google Scholar]
- 49. Bouskila J, Javadi P, Palmour RM, Bouchard JF, Ptito M.. Standardized full-field electroretinography in the Green Monkey (Chlorocebus sabaeus). PLoS One. 2014; 9(10): e111569. [DOI] [PMC free article] [PubMed] [Google Scholar]
- 50. Liu H, Ji X, Dhaliwal S, et al.. Evaluation of light- and dark-adapted ERGs using a mydriasis-free, portable system: clinical classifications and normative data. Doc Ophthalmol. 2018; 137(3): 169–181. [DOI] [PubMed] [Google Scholar]
- 51. Kim CBY, Ver Hoeve JN, Kaufman PL, Nork MT.. Interspecies and gender differences in multifocal electroretinograms of cynomolgus and rhesus macaques. Doc Ophthalmol. 2004; 109(1): 73–86. [DOI] [PubMed] [Google Scholar]
- 52. Dominik FM, Zobor D, Keliris GA, et al.. Detailed functional and structural characterization of a macular lesion in a rhesus macaque. Doc Ophthalmol. 2012; 125(3): 179–194. [DOI] [PMC free article] [PubMed] [Google Scholar]
- 53. Yiu G, Wang Z, Munevar C, et al.. Comparison of chorioretinal layers in rhesus macaques using spectral-domain optical coherence tomography and high-resolution histological sections. Exp Eye Res. 2018; 168: 69–76. [DOI] [PMC free article] [PubMed] [Google Scholar]
- 54. Loduca AL, Zhang C, Zelkha R, Shahidi M.. Thickness mapping of retinal layers by spectral-domain optical coherence tomography. Am J Ophthalmol. 2010; 150(6): 849–855. [DOI] [PMC free article] [PubMed] [Google Scholar]
- 55. Anger EM, Unterhuber A, Hermann B, et al.. Ultrahigh resolution optical coherence tomography of the monkey fovea. Identification of retinal sublayers by correlation with semithin histology sections. Exp Eye Res. 2004; 78(6): 1117–1125. [DOI] [PubMed] [Google Scholar]
- 56. Harwerth RS, Quigley HA.. Visual field defects and retinal ganglion cell losses in patients with glaucoma. Arch Ophthalmol. 2006; 124(6): 853–859. [DOI] [PMC free article] [PubMed] [Google Scholar]
- 57. Rasmussen CA, Kaufman PL.. Primate glaucoma models. J Glaucoma . 2005; 14(4): 311–314. [DOI] [PubMed] [Google Scholar]
- 58. Patel NB, Sullivan-Mee M, Harwerth RS.. The relationship between retinal nerve fiber layer thickness and optic nerve head neuroretinal rim tissue in glaucoma. Invest Ophthalmol Vis Sci. 55(10): 6802–6816. [DOI] [PMC free article] [PubMed] [Google Scholar]
- 59. Sharma R, Williams DR, Palczewska G, Palczewski K, Hunter JJ.. Two-photon autofluorescence imaging reveals cellular structures throughout the retina of the living primate eye. Invest Ophthalmol Vis Sci. 2016; 57(2): 632–646. [DOI] [PMC free article] [PubMed] [Google Scholar]
- 60. Tran TM, Kim S, Lin KH, et al.. Quantitative fundus autofluorescence in Rhesus macaques in aging and age-related drusen. Invest Ophthalmol Vis Sci. 2020; 61(8): 16. [DOI] [PMC free article] [PubMed] [Google Scholar]
- 61. Wang Y, Tran T, Firl K.. Quantitative fundus autofluorescence in smokers compared to non-smokers. Exp Eye Res. 2019; 184: 48–55. [DOI] [PubMed] [Google Scholar]
- 62. McGill TJ, Renner LM, Neuringer M.. Elevated fundus autofluorescence in monkeys deficient in lutein, zeaxanthin, and omega-3 fatty acids. Invest Ophthalmol Vis Sci. 2016; 57(3): 1361–1369. [DOI] [PMC free article] [PubMed] [Google Scholar]
- 63. Yiu G, Vuong VS, Oltjen S, et al.. Effect of uveal melanocytes on choroidal morphology in Rhesus macaques and humans on enhanced-depth imaging optical coherence tomography. Invest Ophthalmol Vis Sci. 2016; 57(13): 5764–5771. [DOI] [PMC free article] [PubMed] [Google Scholar]
- 64. Sparrow JR, Duncker T.. Fundus autofluorescence and RPE lipofuscin in age-related macular degeneration. J Clin Med. 2014; 3(4): 1302–1321. [DOI] [PMC free article] [PubMed] [Google Scholar]