

Abstract
The cerebellum, a structure historically associated with motor control, has more recently been implicated in several higher-order auditory–cognitive functions. However, the exact functional pathways that mediate cerebellar influences on auditory cortex (AC) remain unclear. Here, we sought to identify auditory cortico-cerebellar pathways based on intrinsic functional connectivity magnetic resonance imaging. In contrast to previous connectivity studies that principally consider the AC as a single functionally homogenous unit, we mapped the cerebellar connectivity across different parts of the AC. Our results reveal that auditory subareas demonstrating different levels of interindividual functional variability are functionally coupled with distinct cerebellar regions. Moreover, auditory and sensorimotor areas show divergent cortico-cerebellar connectivity patterns, although sensorimotor areas proximal to the AC are often functionally grouped with the AC in previous connectivity-based network analyses. Lastly, we found that the AC can be functionally segmented into highly similar subareas based on either cortico-cerebellar or cortico-cortical functional connectivity, suggesting the existence of multiple parallel auditory cortico-cerebellar circuits that involve different subareas of the AC. Overall, the present study revealed multiple auditory cortico-cerebellar pathways and provided a fine-grained map of AC subareas, indicative of the critical role of the cerebellum in auditory processing and multisensory integration.
Keywords: auditory cortex, cerebellum, functional connectivity, individual difference
Introduction
The cerebellum, a structure historically implicated in motor control, is presently considered to play a critical role in a variety of other functions (Strick et al. 2009; Buckner 2013; Koziol et al. 2014), including auditory–cognitive processes (Grasby et al. 1993; Mathiak et al. 2004; Callan et al. 2007; Parsons et al. 2009; Grube, Cooper et al. 2010a). In contrast to the direct monosynaptic tracts that connect early subcortical auditory nuclei to the cerebellum and that are associated with simpler functions such as auditory habituation (Rossi et al. 1967; Gacek 1973; Huang et al. 1982; Schmahmann and Pandya 1991), how cerebellar influences on higher-order auditory processing are mediated remains unclear.
The involvement of the cerebellum in auditory processing has captured researchers’ attention as early as the 1940s, when Snider and Stowell recorded auditory evoked potentials in the cerebellum of anesthetized cats (Snider and Stowell 1944). Similar findings have been since documented using single-unit extracellular recordings (Wolfe 1972; Altman et al. 1976; Azizi et al. 1985; Huang and Liu 1985). More recently, human positron emission tomography and functional magnetic resonance imaging (fMRI) have consistently demonstrated increased cerebellar activation during auditory tasks (Heßelmann et al. 2001; Petacchi et al. 2005; Callan et al. 2007; Pastor et al. 2008; Petacchi et al. 2011).
Converging lines of evidence further suggest that different parts of the cerebellum contribute to hierarchically differing aspects of auditory cortical processing (Parsons 2001). A subset of cerebellar regions functions predominantly to support temporal processes related to the perception of auditory stimuli (Ackermann et al. 1999; Belin et al. 2002; Pastor et al. 2002; Pastor et al. 2006). Conversely, other cerebellar subregions, which are co-activated with non-primary auditory cortices, appear to have higher-order functions that support the perception of speech and music (Callan et al. 2006; Guediche et al. 2015). These findings suggest that complex functionally dissociable pathways may exist between the cerebellum and different parts of auditory cortex (AC). Nevertheless, the exact arrangement of auditory cortico-cerebellar functional pathways, that are mainly polysynaptic, remains unknown.
Great strides in mapping human cortico-cerebellar circuits have been made in recent years through the use of resting-state functional connectivity MRI (fcMRI), which can infer functional coupling between regions that are connected through polysynaptic connections (Krienen and Buckner 2009; O'Reilly et al. 2010; Lu et al. 2011). This approach has yielded insights into the heterogeneous nature of individual-specific networks in the cerebellum (Marek et al. 2018). Recently, the auditory cortico-subcortical circuits were delineated using multimodal (Ji et al. 2019) and ultra-high field fMRI (Berlot et al. 2020). Nevertheless, functional mapping of the auditory cortico-cerebellar circuitry has received much less attention (Marek et al. 2018; Ji et al. 2019) and encountered more difficulty (Buckner et al. 2011) than the mapping within the cerebral cortex. For example, O'Reilly et al. (2010) regarded the superior temporal cortex (STC) as a single region of interest (ROI) representing the AC and found functional coherence between the STC and the cerebellum. However, the detected cerebellar pathway lacked fine-grained details. The precise mapping of the auditory cortico-cerebellar functional relationship was further limited by the high degree of functional heterogeneity and substantial intersubject variability inherent in the AC. Our group recently showed that intersubject variability in AC functional connectivity was much greater compared with the visual cortex in both humans and macaque monkeys. Moreover, we found a sharp boundary between low- and high-variability AC regions (Ren et al. 2020). Here, we took advantage of these recent findings and aimed to map out the cerebellar connectivity across different parts of the AC. Previous studies have repeatedly shown that interindividual variability is related to functional hierarchy; for example, in studies utilizing both whole-brain and ROI-based analyses, association cortices were found to be more variable than sensorimotor cortices (Mueller et al. 2013; Hakkinen and Rinne 2018; Stoecklein et al. 2020). It is thus possible that auditory regions of low variability may correspond to the lower-order auditory processes and those of high variability may correspond to the higher-order auditory functions, respectively. In light of the aforementioned findings, we hypothesize that there are distinct auditory cortico-cerebellar pathways that may correspond to primary and higher-order auditory functional regions but were not previously detected using other methods. Furthermore, we hypothesize that the AC may be segmented into multiple distinct functional subregions according to their heterogeneous cortico-cerebellar connectivity, and these subregions may also show meaningful functional segregation in connectivity to other cortical regions.
Materials and Methods
Participants and Data Collection
Two fMRI datasets with different imaging parameters were employed in the present study: the Hangzhou Normal University of the Consortium for Reliability and Reproducibility (CoRR-HNU) dataset (Zuo et al. 2014) and a subset of the Brain Genomics Superstruct Project (GSP) dataset (Holmes et al. 2015; Wang et al. 2015; Yan et al. 2020).
CoRR-HNU Dataset
The CoRR-HNU dataset consisted of a sample of 30 young, healthy adults (15 females, 15 males, mean age = 24 ± 2.4 years). The study was approved by the Center for Cognition and Brain Disorders at Hangzhou Normal University. All participants provided written informed consent prior to commencement of study procedures. Each participant underwent 10 separate 10-min scanning sessions over approximately 1 month. For each scan session, a structural scan was acquired followed by a 10-min resting-state fMRI scan. MRI data were collected using a GE MR750 3 T scanner (GE Medical Systems). Structural images were acquired with a T1-weighted Fast Spoiled Gradient echo sequence (FSPGR: time repetition [TR] = 8.1 ms, time echo [TE] = 3.1 ms, time to inversion [TI] = 450 ms, flip angle = 8°, field of view = 256 × 256 mm, matrix = 256 × 256, voxel size = 1.0 × 1.0 × 1.0 mm, 176 sagittal slices). Blood oxygenation level–dependent (BOLD) functional images were acquired using an echo-planar imaging sequence (EPI: TR = 2000 ms, TE = 30 ms, flip angle = 90°, field of view = 220 × 220 mm, matrix = 64 × 64, voxel size = 3.4 × 3.4 × 3.4 mm, 43 slices). Prior to the start of the resting-state fMRI scan, each participant was instructed to remain still and relax with their eyes open and to not fall asleep.
GSP Dataset
We used the resting-state fMRI data of 100 healthy, young adult participants from the Brain GSP (50 females, 50 males; mean age = 22.0 ± 3.2 years). Participants provided written informed consent in accordance with guidelines established by the Harvard University Committee on the Use of Human Subjects in Research and the Partners Health Care Institutional Review Board. Each participant underwent 1 structural scan and 2 resting-state fMRI scans, with each fMRI scan lasting 6 min in duration. Data were collected on matched 3-T Tim Trio scanners (Siemens) equipped with 12-channel head coils and using identical acquisition parameters. Structural data included a multiecho T1-weighted gradient-echo image (TR = 2200 ms, TE = 1.54 ms for image 1 to 7.01 ms for image 4, TI = 1100 ms, flip angle = 7°, voxel size: 1.2 × 1.2 × 1.2 mm, 144 sagittal slices). Resting-state fMRI images were acquired using the gradient-echo EPI sequence (TR = 3000 ms, TE = 30 ms, flip angle = 85°, voxel size: 3 × 3 × 3 mm, 47 sagittal slices collected with interleaved acquisition). Participants were instructed to stay awake, remain still, and keep their eyes open during resting-state fMRI scanning.
Data Processing
The fMRI data for all participants from both datasets were preprocessed using the same procedures described in our previous studies (Wang et al. 2013; Wang et al. 2015; Yan et al. 2020). In brief, the following steps were performed: 1) slice timing correction (SPM2; Wellcome Department of Cognitive Neurology), 2) rigid body correction for head motion with the FSL 5.0.4 (http://surfer.nmr.mgh.harvard.edu/fswiki/FsFast), 3) normalization for global mean signal intensity across runs, 4) bandpass filtering (0.01–0.08 Hz), and 5) nuisance variables (6 motion parameters, white-matter signal, ventricular signal, whole-brain signal, and their temporal derivatives) regression.
It is worth noting that we included the global signal regression (GSR) in the preprocessing pipeline of the current study, although there is still no consensus regarding whether GSR should or should not be included in resting-state data processing to date. The benefits and disadvantages of including GSR may also vary depending on the purpose of the study. For example, Power and colleagues compared various combinations of denoising strategies (Power, Plitt et al. 2017b). They showed that GSR is the only denoising method that effectively removes global signals, including artefactual signals and, crucially, global neural activity (Power, Plitt et al. 2017b), which is proposed to be modulated mainly by respiration and/or arousal/vigilance (falling asleep is linked to slower and deeper breathing; Power, Laumann et al. 2017a; Power, Plitt et al. 2017b). GSR is thus useful in studies that wish to control for global neural activity (e.g., controlling for levels of alertness) but should be avoided in studies wherein the global neural signal is of interest, as for example in arousal or sleep studies (Power, Laumann et al. 2017a). In a recent study, Li et al. 2019 highlighted the usefulness of GSR in detecting individual differences in behavior; resting-state fMRI data preprocessed with GSR led to greater associations between whole-brain functional connectivity and measures of cognition, personality, and emotion.
Structural data were processed using the FreeSurfer version 5.3.0 software package (http://surfer.nmr.mgh.harvard.edu). Surface mesh representations of the cortex from each individual’s structural images were reconstructed and registered to a common spherical coordinate system (Fischl et al. 1999). Functional magnetic resonance (MR) images after nuisance variable regression were linearly aligned to the corresponding participant’s high-resolution structural images using boundary-based registration based on maximizing the overall contrast between white matter and gray matter (Greve and Fischl 2009). The functional images were registered to the FreeSurfer cortical surface template (fsaverage6), consisting of 40 962 vertices for each hemisphere, through sampling from the middle of the cortical ribbon in a single interpolation step. Next, a 6-mm full-width half-maximum (FWHM) smoothing kernel was applied to the fMRI data on the cortical surface. The smoothing on the surface helped to minimize the blurring of fMRI signals across sulci or gyri (Yeo et al. 2011).
Preprocessed images were also registered to the group-averaged volumetric template (MNI152 template). First, the structural images were aligned to MNI152 volumetric template using volumetric nonlinear registration provided by the Advanced Normalization Tools (ANTs) (Avants et al. 2009). To reduce the computational cost, the aligned structural images were downsampled to a 2-mm spatial resolution. Next, fMRI images were registered to the 2-mm MNI152 volumetric template in a single step by combining 12 degrees of freedom registration matrices and the nonlinear registration matrices to prevent blurring that may result from multiple interpolations. Finally, an isotropic smoothing kernel (FWHM = 6 mm) was applied to the registered fMRI data within the brain mask. To confirm that the main findings are not sensitive to the template selections, preprocessed fMRI images were also registered to a “spatially unbiased atlas template of the cerebellum and brainstem” (SUIT) using the SUIT toolbox (http://www.diedrichsenlab.org/imaging/suit_download.htm). The same smoothing kernel was applied to the registered fMRI data within the cerebellar mask.
The individual-specific functional connectivity maps for each seed were calculated by the Pearson’s correlation coefficient between average time series within the seed ROI and time series of all voxels in the cerebellar cortex. The correlation maps were converted to z maps by Fisher’s r-to-z transformation.
Estimation of Interindividual Variability in Functional Connectivity
Interindividual variability of the AC in functional connectivity was evaluated using the same approach described in our previous work (Mueller et al. 2013; Ren et al. 2020; Stoecklein et al. 2020). The AC mask consisted of 2155 vertices in the “fsaverage6” template surface, described in our previous studies (Ahveninen et al. 2016). The surface of cerebral cortex was first downsampled to 1175 vertices (i.e., regions of interests, ROIs) that were approximately uniformly distributed across the 2 cortical hemispheres. For each vertex in the AC mask, a functional connectivity profile was estimated by computing Pearson’s correlations between time series of the AC vertex and those of 1175 cortical ROIs (Yeo et al. 2011). The profile for a given vertex i could be denoted as Fi(s, v), where i = 1,2...N, and Fi is a 1 × 1175 vector, s indicates the subject, v indicates the session, and N indicates the number of vertices within the mask. For a given vertex i, the intrasubject variance was estimated using the V maps derived from all V sessions of each subjects (e.g., V = 10 for CoRR-HNU dataset):
 |
where  and
and  represents the mean across all pairs of sessions. The intrasubject variance was then averaged across all subjects within the dataset:
 |
where  represents the mean across all subjects. The similarity between S (the number of subjects within each dataset, e.g., S = 30 in the CoRR-HNU dataset) maps derived from all subjects was quantified by averaging the correlation maps between any 2 maps:
 |
where p, q = 1, 2, … S (p ≠ q) and  represents the mean across all pairs of subjects. Interindividual variability in functional connectivity was estimated at each AC vertex based on the dissimilarity of the functional connectivity profiles between individuals. To control for the influence of measurement noise and other confounding factors, intraindividual variability was estimated and linearly regressed out from the map of interindividual variability. Intraindividual variability in functional connectivity represents variability caused by measurement noise and brain state differences (Mueller et al. 2013). Specifically, to estimate interindividual variability, the similarity map was inverted (by subtraction from 1) and then the intrasubject variance was regressed out using a general linear model (GLM). The residual map could be regarded as the interindividual variability of resting-state functional connectivity:
 |
where  and
and  are parameters determined by the GLM. Interindividual variability maps derived from each session t are averaged.
Definition of Seed ROIs
We placed seeds in the AC based on interindividual variability in functional connectivity described above, which demonstrated an abrupt change in the interindividual variability map in the superior temporal gyrus (STG). A seed was placed in Heschl’s gyrus (HG), a well-known landmark of the primary AC (Fig. 1A,B). Two juxtaposed seeds adjacent to the sharp transition boundary of the individual variability map in the STG were placed in the planum temporale (PT) near the low-variability area and in the lateral STG near the high-variability area (Fig. 1A,B). Additionally, we placed a seed in the ventral sensorimotor cortex (vSMC), corresponding to the putative tongue sensorimotor area, which was often grouped together with the AC in previous parcellations based on functional connectivity (Fig. 3A) (Yeo et al. 2011). MNI coordinates of all seeds described above are summarized in Supplementary Table S1.
Figure 1.
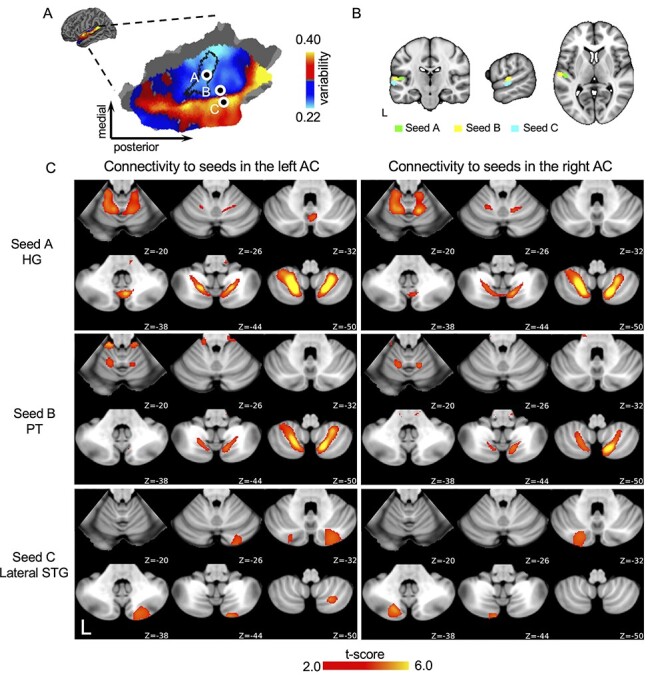
AC is functionally connected with the cerebellum. (A) Interindividual variability in functional connectivity is quantified in the AC and rendered on the flattened surface. Values below the global mean are shown in cool colors, whereas values above the global mean are shown in warm colors. Regions near the primary and secondary auditory areas shows lower interindividual variability than higher auditory areas. Three representative seeds in the AC were chosen for functional connectivity analyses. Seed A was located in the HG, demarcated by a black boundary line using FreeSurfer’s Desikan–Killiany–Tourville atlas. Two adjacent seeds were placed in regions showing low inter-individual variability (seed B, PT and high interindividual variability (seed C, lateral STG). (B) These 3 seeds are shown in the MNI152 volumetric template. (C) Connectivity maps of the seeds in the left and the right AC. Connectivity maps were derived from group-level one-sample t-test across individuals (q < 0.05, FDR corrected). All seeds show significant connectivity with the cerebellum. Seeds A and B show similar connectivity maps in the cerebellum, whereas seed C in the high-variability regions of the AC shows a distinct connectivity pattern.
Figure 3.
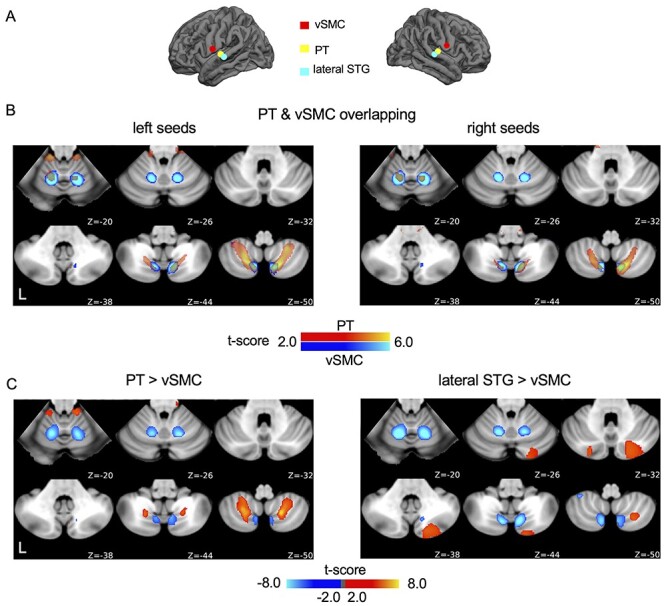
AC and sensorimotor cortex are connected to different regions of the cerebellum. (A) the seed was placed in the vSMC, adjacent to the AC. (B) The connectivity maps of the left and right PT seeds indicated by semi-transparent yellow-red color are overlapped on the connectivity maps of the left and right vSMC seeds indicated by blue color (q < 0.05, FDR corrected). The connectivity maps show distinct but partially overlapping. (C) Connectivity map of the vSMC seed was contrasted against the maps of the PT (upper panel) and lateral STG seed (lower panel). AC–cerebellar connectivity was distinct from the vSMC–cerebellar connectivity, although the vSMC seed is in close proximity to the PT and lateral STG seeds.
BOLD fMRI signal from each seed ROI in the “fsaverage6” cortical surface template was extracted. We chose to use a surface template rather than from a volumetric template, since surface-based intersubject alignment and surface-based smoothing are able to minimize the registration errors and functional signal blurring across sulci or gyri (Dick et al. 2012; Coalson et al. 2018; Fischl and Sereno 2018). Specifically, we chose a seed ROI at the surface vertex described in Supplementary Table S1 and its neighbors (6 vertices surrounding the seed vertex in the “fsaverage6” surface template). The size of each seed ROI is approximately 10 mm2, although it should be noted that the vertices do not have equal size. The BOLD fMRI signal was then averaged within the seed ROI as the seed signal. Functional connectivity map of the seed ROI was estimated by Pearson’s correlation performed between the seed signal and fMRI signal for every voxel in the cerebellar mask defined by the Diedrichsen’s probabilistic MR atlas of the human cerebellum (Diedrichsen et al. 2009).
Statistical Analyses
Connectivity between cerebellar voxels and cortical seeds (HG, PT, lateral STG, and vSMC) was tested using 1-sample t-tests across participants. Paired t-tests were used to examine whether functional connectivity maps derived from the low-variability area seeds (HG and PT seeds) and the high-variability area seed (lateral STG) were significantly different. Additionally, we applied laterality index (LI) to evaluate the lateralization of the seed-based FC maps. The LI was defined as
 |
where L and R represents the number of left- and right-hemispheric cerebellar voxels that are functionally coupled with the cortical seeds, respectively. The value of LI is between −1 and 1, where a positive value represents left lateralization and a negative value represents right lateralization.
To compare whether 3 functional connectivity maps (seeds in the low variability, high variability, and vSMC areas) were different from one another, we used a repeated-measures analysis of variance (ANOVA) to examine parameter estimates. As a post hoc test, a paired t-test was used to examine the difference between the cerebellar connectivity maps of PT versus vSMC, and between the lateral STG versus vSMC.
All P values in this study were adjusted using cluster-wise false discovery rate (FDR; q values). The labels used to represent corresponding cerebellar lobules were based on the MRI atlas of the human cerebellum (Table 1) (Schmahmann et al. 1999). Statistical tests were performed using in-house MATLAB (The Mathworks) scripts.
Table 1.
Peak cerebellar coordinates and cluster size for the main contrasts
| Contrast | Labels | MNI Coordinate | t score | # voxels | |||
|---|---|---|---|---|---|---|---|
| PT > lateral STG | L | Lobule VIIIA & VIIIB | −24 | −48 | −48 | 10.35 | 759 |
| L | Lobule I_IV & V | −18 | −48 | −14 | 6.16 | 148 | |
| R | Lobule VIIIA & VIIIB | 16 | −44 | −54 | 9.97 | 865 | |
| R | Lobule I_IV & V | 18 | −36 | −20 | 5.02 | 120 | |
| lateral STG > PT | L | Crus I & II | −20 | −74 | −28 | 11.00 | 575 |
| L | Lobule VIIIA | −34 | −70 | −54 | 6.86 | 136 | |
| R | Crus I & II | 24 | −80 | −24 | 9.54 | 42 | |
| vSMC > PT | L | Lobule V & VI | −18 | −64 | −26 | 7.93 | 616 |
| L | Lobule VIIIA & VIII B | −8 | −67 | −50 | 5.56 | 135 | |
| R | Lobule V & VI | 12 | −62 | −24 | 8.09 | 487 | |
| R | Lobule VIIIA & VIII B | 8 | −67 | −48 | 4.65 | 76 | |
| vSMC > lateral STG | L | Lobule VIIIA & VIII B | −10 | −70 | −44 | 8.91 | 420 |
| L | Lobule V & VI | −16 | −62 | −20 | 10.29 | 332 | |
| R | Lobule VIIIA & VIII B | 36 | −52 | −56 | 6.90 | 209 | |
| R | Lobule V & VI | 10 | −72 | −46 | 8.57 | 165 | |
Note: R = right hemisphere, L = left hemisphere.
Functional Parcellation of the AC
A k-means clustering approach was applied to segment the AC into multiple subareas based on functional connectivity profiles. The k-means clustering algorithm was performed by MATLAB (https://www.mathworks.com/help/stats/kmeans.html). For each AC vertex, its functional connectivity with 1175 cerebral ROIs or with 22 526 cerebellar voxels (in the isotropic 2-mm MNI152 template) was calculated. AC vertices were clustered according to the similarity of their cerebral or cerebellar functional connectivity profiles, respectively. Similarity was estimated using a cosine similarity metric, which is effectively equivalent to the correlation metric but with higher computational efficiency. The clustering analysis was repeated 500 times with randomly selected initial cluster centroids to prevent from falling into local minima.
The optimal numbers of clusters were selected according to Silhouette criterion value (Rousseeuw 1987). Silhouette values were estimated by using MATLAB (https://www.mathworks.com/help/stats/silhouette.html) through feeding functional connectivity profiles and cluster assignments. Silhouette values varied from −1 to 1, with a higher value indicative of a better clustering solution. Clustering analyses were independently performed using cortico-cortical connectivity or cortico-cerebellar connectivity. We varied the cluster number from 2 to 8 and calculated a Silhouette value for each parcellation. Local maxima of Silhouette values appeared when AC was parcellated into 2 clusters and 7 clusters, either based on cortico-cortical connectivity or based on cortico-cerebellar connectivity. The similarity of the functional parcellation between cerebral and cerebellar-based parcellation of the AC was evaluated by the Dice overlap.
The myelin content was estimated by the T1/T2 ratio in the AC subregions (Glasser and Van Essen 2011). Due to the absence of T2 images in 2 datasets and the relatively low interindividual variability of myelin distribution, we adopted a commonly used myelin map derived from 440 participants of the Human Connectome Project (Glasser et al. 2016). Parcellation boundaries were overlaid on the myelin density map and the myelin content was averaged within each subregion.
Spatial Correlation Between Maps
Spearman correlations between maps were calculated using MATLAB (https://www.mathworks.com/help/stats/corr.html). To avoid the potential impact of spatial dependence between neighboring vertices for correlations, we have applied the Durbin–Watson test using MATLAB (https://mathworks.com/help/stats/durbin-watson-test.html). Specifically, we performed a repeated (n = 1000) random sampling of 7% of the vertices and computed the correlation coefficient on the subsets of the vertices. For each subset, the Durbin–Watson test was performed to estimate the spatial dependence. Correlation coefficients were z-transformed and averaged across the 1000 iterations. In all spatial correlations reported in our manuscript, the values of the Durbin–Watson statistic were close to 2, with P values >0.05, suggesting that there was no significant spatial autocorrelation in the subset of vertices.
Code and Data Availability
The CoRR-HNU dataset is publicly available through the Consortium for Reliability and Reproducibility Project (http://fcon_1000.projects.nitrc.org/indi/CoRR/html/hnu_1.html). The GSP dataset is available through the Brain GSP (https://www.neuroinfo.org/gsp). MATLAB codes that were utilized in the present study are available from the corresponding authors upon request.
Results
Different Parts of AC Connect to the Cerebellum Through Distinct Pathways
Utilizing a highly sampled resting-state fMRI dataset consisting of 30 healthy young adults (the CoRR-HNU dataset, 15 females and 15 males, ages 24 ± 2.41 years, 100-min resting-state scanning for each participant) (Zuo et al. 2014), we first estimated intersubject variability in AC functional connectivity using previously established methods (Mueller et al. 2013; Stoecklein et al. 2020). Replicating results from our prior report (Ren et al. 2020), we found that some regions in the AC were more variable across individuals than other regions. Importantly, interindividual variability in AC functional connectivity maps were delimited by a sharp boundary (Fig. 1A), with regions near the primary and secondary auditory areas demonstrating low interindividual variability, whereas higher AC areas showed a high degree of interindividual variability.
Instead of defining the AC as a single, homogeneous functional region, we examined the auditory cortico-cerebellar functional circuits using seeds placed in low- and high-variability regions. Three seeds were selected for each hemisphere (Fig. 1A,B, see Supplementary Table S1 for MNI coordinates of all seeds). Seed A was placed in HG, a well-known landmark of the human primary AC. Seeds B and C were placed adjacent to each other, just proximal to the boundary between the low- and high-variability regions in the STG. Specifically, seed B was located in the PT in the low-variability auditory area, whereas seed C was located in the lateral STG, just ventral to seed B, an area corresponding to the high-variability auditory area.
We found that both low- and high-variability areas of the AC showed strong functional coupling with the cerebellum (Fig. 1C, 1-sample t-test, q < 0.05, FDR corrected), independent of the cerebellar template used (Supplementary Fig. S1). Cerebellar functional connectivity maps for seeds placed in the HG and PT were highly similar (Spearman correlation, r = 0.744, P < 0.001 for the left hemispheric seeds and r = 0.697, P < 0.001 for the right hemispheric seeds). Additionally, maps based on the HG and PT seeds revealed multiple auditory representations in the cerebellum. These multiple representations were identified previously as a general functional organizing principle of the cerebellum (Buckner et al. 2011; Guell et al. 2018). The above findings were then replicated in an independent dataset, which is a subset of the GSP dataset (Holmes et al. 2015; Wang et al. 2015) consisting of 100 young, healthy adults (50 females and 50 males, mean age = 22.0 ± 3.2 years). Cerebellar correlation maps were highly replicable for seeds in the HG (Spearman correlation, left HG: r = 0.86, P < 0.001; right HG: r = 0.83, P < 0.001) and the PT (Spearman correlation, left PT: r = 0.84, P < 0.001; right PT: r = 0.78, P < 0.001) and modestly replicable for the lateral STG seed (Spearman correlation, left lateral STG: r = 0.62, P < 0.01; right lateral STG, r = 0.54, P < 0.01) (Supplementary Fig. S2).
Critically, functional connectivity maps obtained from the lateral STG seed were not correlated with those obtained from the PT seed (Spearman correlation, r = −0.042, P = 0.155 for the left hemispheric seeds and Spearman correlation, r = −0.028, P = 0.268 for the right hemispheric seeds). Comparison of connectivity maps between the 2 adjacent seeds in the lateral STG and the PT using paired t-tests (Fig. 2, q < 0.05, FDR corrected) also revealed functionally distinct cortico-cerebellar pathways. Importantly, the lateral STG seed showed strongly lateralized connectivity to the contralateral cerebellar hemisphere (LI = −0.898 for the left lateral STG seed and LI = 1 for the right lateral STG seed), whereas the HG and PT seeds showed strong functional connectivity to both cerebellar hemispheres with weak laterality (LI = 0.068 for the left HG seed, LI = 0.120 for the right HG seed, LI = 0.051 for the left PT seed, and LI = −0.139 for the right PT seed) (Fig. 1C and Supplementary Fig. S3 for contrasts between the left and right AC seeds). The contrast map of the cerebellar regions coupled with the HG and the lateral STG demonstrated a similar divergent pattern (Supplementary Fig. S5, paired t-test, q < 0.05, FDR corrected). Specifically, we found 4 regions of the cerebellum that were more strongly functionally coupled with the PT seed, compared with the lateral STG seed. These regions included Lobule VIIIA/VIIIB and Lobule I–IV/V (Table 1) in both hemispheres. Conversely, 3 regions of the cerebellum were more strongly correlated with the lateral STG seed than the PT seed, located in Crus I and II in both hemispheres and lateralized to the left hemisphere in Lobule VIIIA (Table 1). These nonoverlapping functional connectivity patterns indicate that the low- and high-variability areas of the AC are connected to the cerebellum through dissociable cortico-cerebellar pathways.
Figure 2.
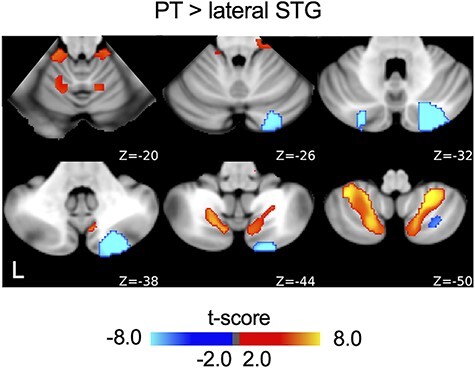
Seeds in the low- and high-variability regions of the AC reveal distinct auditory cortico-cerebellar pathways. Functional connectivity maps of the PT and lateral STG seeds (Fig. 1) were contrasted (q < 0.05, paired t-test, FDR corrected). The contrast map shows distinct connectivity patterns for these 2 seeds, indicating 2 divergent but parallel pathways between the AC and the cerebellum.
The Auditory Regions Are Distinct From the Sensorimotor Regions in Their Connectivity With the Cerebellum
The auditory and sensorimotor cortices are adjacent to each other and as such, often grouped together in functional connectivity-based network parcellation studies (Yeo et al. 2011). To investigate whether the auditory cortico-cerebellar pathways are dissociable from the sensorimotor pathways, we placed a seed in the vSMC (Fig. 3A and Supplementary Table S1 for MNI coordinates), which is just proximal to the AC, and then derived the ventral sensorimotor cortico-cerebellar connectivity map. The vSMC was strongly connected to Lobules V, VI, and VIIIA/B of the cerebellum (Fig. 3B, Table 1) (1-sample t-test, q < 0.05, FDR corrected), consistent with previous reports (Buckner et al. 2011; Marek et al. 2018). The cortico-cerebellar connectivity maps were replicated in the GSP dataset and demonstrated highly similar patterns to the original findings (spatial correlation r = 0.72, P < 0.001 for the left vSMC seed; spatial correlation r = 0.65, P < 0.001 for the right vSMC seed). To statistically compare whether the cerebellar functional maps could be distinguished from one another, we used a repeated measures ANOVA to test the average time series extracted from the PT, lateral STG, and vSMC seeds against the time series extracted from every voxel in the cerebellum (q < 0.01, FDR corrected). The results demonstrated that cerebellar voxels connected to these cortical seeds were highly dissociable in terms of their cortico-cerebellar pathways (Supplementary Fig. S4). Moreover, we compared the auditory cortico-cerebellar and sensorimotor cortico-cerebellar connectivity maps in a pairwise fashion (i.e., PT vs. vSMC and lateral STG vs. vSMC). We found that PT and vSMC seeds showed distinct but partially overlapping connectivity patterns in the cerebellum (Fig. 3B,C), whereas the lateral STG and vSMC region demonstrated segregated cerebellar connectivity patterns (Fig. 3C, paired t-test, q < 0.05, FDR corrected). Similar comparisons were carried out among HG, vSMC, and lateral STG seeds (Supplementary Fig. S5) and the contrast maps were overlaid on the flatten cerebellar surface (Supplementary Fig. S6). The results indicated that the HG and vSMC connectivity to the cerebellum were also dissociable. Taken together, these results suggest that auditory and sensorimotor areas connect to the cerebellum via distinct but partially overlapping pathways.
Cerebral and Cerebellar Connectivity Reveals Similar Functional Organization in the AC
To investigate whether AC cortico-cerebellar functional connectivity has similar inherent functional organization to that of AC cortico-cortical functional connectivity, we parcellated the AC into subregions based on the AC–cerebral connectivity patterns and then repeated the parcellation analysis utilizing AC–cerebellar functional connectivity profiles. The hypothesis was that the AC can be segmented into similar subregions based on cortico-cortical and cortico-cerebellar connectivity if AC–cerebellar and AC–cortical profiles contain coherent functional information. In other words, similar AC parcellation might reflect similarly organized cortico-cerebellar and cortico-cortical circuits in auditory processing and reflect similar auditory hierarchical organizations. To select the optimal number of clusters for the AC parcellation, we chose the local maxima of silhouette criterion values, which reflect the overall clustering accuracy, from 2 clusters to 8 clusters (Rousseeuw 1987). Intriguingly, both cerebral- and cerebellar-based parcellations consistently achieved maximal value at 2 clusters and local maxima at 7 clusters (Fig. 4A). In both cerebrum- and cerebellum-based parcellations, a sharp boundary around STG demarcated the AC into 2 subregions in the 2-cluster parcellation, which overlapped with the transition between the low-variability and high-variability regions (Fig. 1A). The cerebellar functional connectivity patterns of the 2 clusters showed similar segregation (Supplementary Fig. S7C) as the maps based on the seeds in the low- and high-variability areas (as shown in Fig. 1). This putative boundary is also well preserved in the 7-cluster parcellation (Fig. 4B, see Supplementary Fig. S7 for the cerebellar regions connected to each AC cluster, and see Supplementary Fig. S8 for the cerebral regions connected to each AC cluster). We then quantified the Dice overlap between cerebrum- and cerebellum-based parcellations, from 2 clusters to 8 clusters. The similarity also achieved the highest value (Dice overlap = 97.2%) at 2 clusters and a local maximal value (Dice overlap = 90.5%) at 7 clusters (Fig. 4C). The consistency of the optimal numbers of clusters combined with the high degree of similarity of cerebrum- and cerebellum-based parcellations indicates that the auditory cortico-cerebellar and auditory–cerebral pathways are organized in a highly similar manner. We then replicated the above results in the GSP dataset. The cerebrum- and cerebellum-based parcellations also showed highly similar patterns in this replication dataset (Dice overlap = 97.4% for 2-cluster parcellation and Dice overlap = 82.7% for 7-cluster parcellation, Supplementary Fig. S9).
Figure 4.
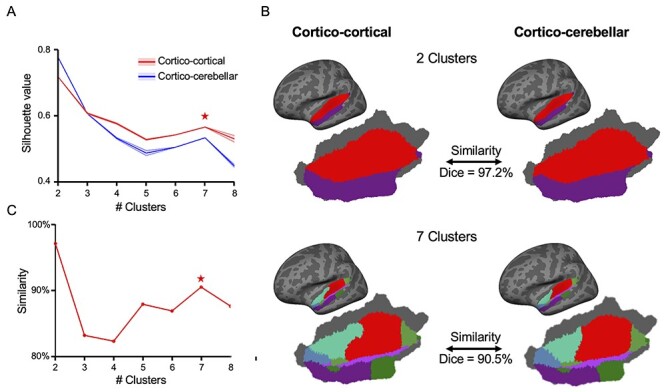
Cortico-cortical and cortico-cerebellar connectivity reveal consistent functional organization of the human AC. The human AC was parcellated into several clusters based on cortico-cortical connectivity as well as cortico-cerebellar connectivity, respectively. The Silhouette Criterion, which ranges from −1 to 1, was used to select the optimal cluster numbers. High Silhouette Criterion values indicate appropriate clustering solutions. (A) Both cortico-cortical and cortico-cerebellar parcellations showed high Silhouette values when the AC was divided into 2 clusters and 7 clusters (indicated by an asterisk). (B) Two-cluster and 7-cluster parcellations based on cortico-cortical connectivity (left) and cortico-cerebellar connectivity (right) are illustrated. A sharp boundary around STG splits the AC into 2 clusters, and this separation is well preserved in the 7-cluster parcellation. (C) Similarity between cortico-cortical and cortico-cerebellar parcellations measured by the Dice’s coefficient varies with the number of clusters. The 2 parcellation approaches showed high similarity when the AC was divided into 2 (Dice = 97.2%) and 7 clusters (Dice = 90.5%).
To test whether our functional parcellation captures some known anatomical properties of the AC, we examined the myelin density in these parcels. Heavy myelin content was found in HG and its surrounding regions (Fig. 5A). In the 2-cluster parcellation, the red cluster showed significantly higher myelin density than the purple cluster (the left column of Fig. 5B, red cluster = 1.398 ± 0.163 vs. purple cluster = 1.219 ± 0.086; p < 0.0001, t(2153) = 28.24, 2-sample t-test). In the 7-cluster parcellation, the red cluster (cluster 2) delineates the most myelinated region (Fig. 5A). The myelin density of the red cluster was significantly higher than that of other clusters (the right column of Fig. 5B, P < 0.0001, 2-sample t-tests, the multiple comparisons were corrected by the Bonferroni correction).
Figure 5.
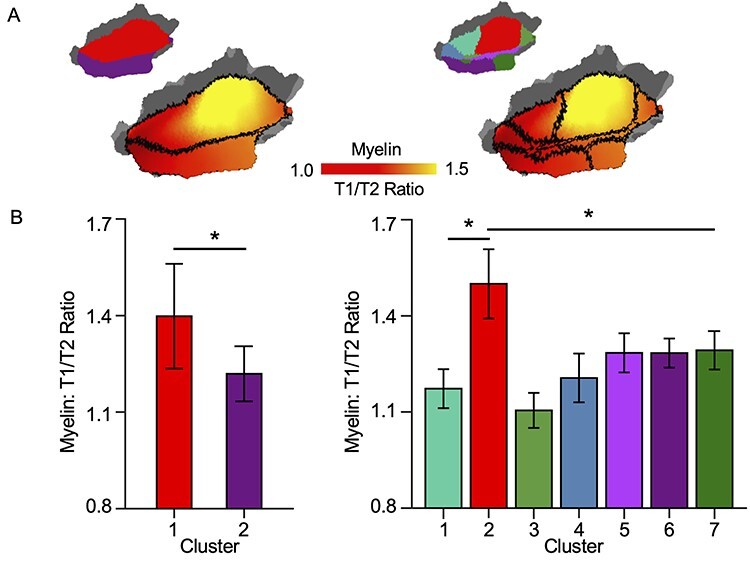
Functional parcellation of the human AC reflects differences in myelin content between subareas. (A) The myelin density estimated by the T1/T2 ratio is demonstrated in the AC. Boundaries of the 2-cluster (left) and 7-cluster (right) parcellations are indicated by the black lines. (B) The myelin density is significantly higher in the red cluster than in other clusters. This is true both in the 2-cluster parcellation (left: cluster 1 = 1.219 ± 0.086, cluster 2 = 1.398 ± 0.163; P < 0.0001, t(2153) = 28.24, 2-sample t-test) and the 7-cluster parcellation (right: P < 0.0001, 2-sample t-tests, the multiple comparisons were corrected by the Bonferroni correction).
Discussion
Despite significant advances in the understanding of the cerebellum’s involvement in nonmotor functions (Buckner et al. 2011; Marek et al. 2018; Diedrichsen et al. 2019), the functional mapping of auditory cortico-cerebellar circuits has posed challenges and remains understudied. Here, we used resting-state fcMRI to delineate the topographical organization and functional characteristics of auditory cortico-cerebellar circuits that involve different parts of the AC, which demonstrated different levels of interindividual variability. Although we observed strong functional connectivity between the AC and the cerebellum, the cerebellar connectivity maps of the low- and high-variability areas of the AC were distributed in a topographically divergent manner and manifested different lateralization patterns. Moreover, our results show that the auditory cortico-cerebellar and the sensorimotor cortico-cerebellar circuits are dissociable, despite the fact that the auditory and sensorimotor cortices are in close proximity to each other and often functionally grouped together in previous studies. Finally, we found that the AC can be segmented into fine-grained subareas either based on cerebral or cerebellar connectivity, suggesting that cortico-cortical and cortico-cerebellar circuits reflect a consistent functional organization in the human AC and the existence of parallel AC cortico-cerebellar circuits. Our findings shed new light on the precise functional mapping of the auditory cortico-cerebellar circuits that have been largely overlooked by previous neuroimaging studies. Convergent functional parcellations of the AC may reflect the inherent similarity between cerebellar and cerebral functional connectivity and are suggestive of the hierarchical organization of the human AC.
Dissociable Auditory Cortico-Cerebellar Pathways Involving Low- and High-Variability Areas of the AC
Our results show that the low- and high-variability areas of the AC are functionally coupled with distinct cerebellar regions. Moreover, the low-variability area showed strong functional connectivity to both cerebellar hemispheres, whereas the high-variability area showed strong functionally coupling with only the contralateral cerebellar hemisphere. Auditory cortico-cerebellar functional connectivity revealed in the present study showed a high degree of overlap with known anatomical pathways between low- and high-variability AC regions and the cerebellum. Previous tract tracing animal studies have identified cortico-cerebellar pathways that are polysynaptic in nature and indirectly connected to the cerebellum via relays in the pontine nuclei of the brainstem and thalamus (Schmahmann 1996; Baumann et al. 2015). Nonprimary auditory areas located in the STG are anatomically connected with lateral pontine nuclei (Schmahmann and Pandya 1991), which projects to Crus I, Crus II, and lobule VIIB (Brodal 1979). Similarly, a recent diffusion tensor imaging study revealed projections from the STS, a region proximal to the STG, to the contralateral cerebellar Crus I (Sokolov et al. 2014). Of particular importance here is the observation that the pattern of functional connectivity between the STG and regions within the cerebellum matched the anatomical distribution of projections from the pons to Crus I, II, and lobule VIIB (Fig. 2 and Table 1). Remarkably, the patterns of functional connectivity observed in the cerebellum, from seeding the low-variability areas of the AC, were also very similar to anatomical connections between the cerebellar lobules and the cochlear nucleus via cerebellifugal fibers. These connections, first described in guinea pigs (Rossi et al. 1967) and later reported in cats (Gacek 1973; Huang et al. 1982), involve the posterior vermis including Lobules VI, VII, and VIIIA.
Studies utilizing single-unit recordings in cat cerebellar vermis, including Lobules VI and VII, have found that these regions respond selectively to pure tones (Highstein and Coleman 1968; Freeman 1970; Aitkin and Boyd 1975; Altman et al. 1976). In contrast, in a study performed in anesthetized rats, neurons in the paraflocculus, just proximal to Crus I/II, responded predominantly to electrical stimulation delivered to the AC, whereas neurons in the midvermis were unresponsive to AC stimulation but instead responded to electrical stimulation delivered peripherally (Azizi et al. 1985). Although the aforementioned findings from animal studies might not parallel human auditory cerebellar organization in all respects (Besle et al. 2019), they strongly suggest the existence of functionally and structurally dissociable auditory cortico-cerebellar pathways in mammals. In humans, it has also been found that various types of auditory stimuli differentially activate distinct cerebellar regions. For example, the cerebellar lobule VI and VIII A/B are predominantly activated by stimuli related to early stages of auditory processing (Belin et al. 2002; Baumann and Mattingley 2010; Petacchi et al. 2011), whereas the cerebellar Crus I/II are more likely activated by stimuli related to higher-order auditory processing (Callan et al. 2006; Callan et al. 2007). In summary, there exist multiple dissociable auditory cortico-cerebellar pathways in the human brain.
The Role of the Cerebellum in Auditory Processing
An extensive body of evidence supports the premise that the cerebellum plays a general role in auditory processing, including discrimination of pitch (Parsons et al. 2009; Petacchi et al. 2011), sound intensity (Belin et al. 1998), auditory stimuli duration, and its perception (Ivry and Keele 1989; Koch et al. 2009; Grube, Cooper et al. 2010a; Grube, Lee et al. 2010b; Teki et al. 2011), as well as subserves higher-order functions, such as music and speech production, and recognition (Callan et al. 2006; Callan et al. 2007; Guell et al. 2018). The diverse involvement of the cerebellum in auditory functions highly overlap with those of the cerebral cortex. The auditory parcellations based on cortico-cortical and cortico-cerebellar functional connectivity consistently preserve the hierarchical organization in the AC (e.g., the putative boundary between low- and high-variability areas of the AC), suggesting that the cerebellum is widely involved in many domains of auditory processing, from the perception of sound elements to speech/music recognition. Despite functional involvement in overlapping task domains subserving auditory processes, the cerebellum and the cerebral cortex may contribute to different aspects (e.g., the temporal aspect of auditory processing for the cerebellum and the spectrogram of auditory processing for the cerebral cortex) or different stages (e.g., earlier stages of processing for the cerebellum and later stages of processing for the cerebral cortex) of the same tasks and therefore may collaborate with each other to accomplish the complex auditory functions.
Our results may also provide evidence to support an alternative hypothesis that the cerebellum plays a role in integration of multisensory information (Baumann et al. 2015). We found that cerebellar regions connected to the PT are partially overlapping with cerebellar regions connected to the sensorimotor cortex (Fig. 3). Findings from previous studies indicate that cerebellar visual and auditory regions partially overlap (Snider and Stowell 1944; Azizi and Woodward 1990; O'Reilly et al. 2010). Moreover, the partially overlapping visual, auditory, and sensorimotor representations in the cerebellum are functionally organized in a distinct manner from their corresponding representations in the cerebral cortex, which are topographically distributed without spatial overlap. The convergent connectivity patterns observed in the present study thus suggest that the cerebellum might be a node for integration of multisensory information (Ronconi et al. 2017). Taken together, our data indicate that the cerebellum may collaborate with the cerebral cortex to process different aspects or stages of auditory information and may be an important node for integrating multisensory information.
Functional Parcellation of the Human AC
Revealing the functional organization of the human AC has profound implications for basic and clinical neuroscience research, but the explorations have yet to yield a widely accepted model. Progress was made in the tonotopic mapping of the human AC (Romani et al. 1982; Formisano et al. 2003; Humphries et al. 2010; Ahveninen et al. 2016). However, only a few general processing streams of human AC are currently known (Ahveninen et al. 2006; Rauschecker and Scott 2009; Ahveninen et al. 2013). As a result, several different hierarchical organizational models of the human AC have been proposed (Morel et al. 1993; Rivier and Clarke 1997; Morosan et al. 2001; Wallace et al. 2002). The lack of a widely accepted model of human AC subregions, analogous to the detailed parcellation of nonhuman primate ACs (Morel et al. 1993; Rauschecker et al. 1995; Kaas and Hackett 2000; Rauschecker and Tian 2004; Kuśmierek and Rauschecker 2009), has contributed to fundamental theoretical disagreements on auditory processing in the human brain. A widely accepted nonhuman primate model delineates the AC into 3 primary core regions, surrounded by up to 8 nonprimary belt and additional higher-level parabelt regions (Morosan et al. 2001; Wallace et al. 2002). In humans, however, contrasting interpretations exist on the extent of broader functional subdivisions of ACs (Rauschecker and Tian 2000; Ahveninen et al. 2006; Ahveninen et al. 2013; Moerel et al. 2014), not to mention more detailed subareas. The present study attempted to reveal functional subregions of the human AC according to their cortico-cortical and cortico-cerebellar functional connectivity. We found that the boundaries of subregions follow the division between high- and low-variability regions, which may reflect the functional hierarchy within the AC. These subregions demonstrate distinct patterns of functional connectivity with the cerebellum and the cerebral cortex. However, the AC parcellations based on cortico-cortical and cortico-cerebellar connectivity were highly similar (Supplementary Figs S7 and S8). For example, in the 2-cluster parcellation, the red cluster was coupled with Lobule I–IV, V, and VIIIA/B, which is highly reminiscent of the pattern observed when seeding the primary AC. The purple cluster was coupled with Crus I/II and demonstrated strong lateralization. Moreover, the AC subregion representing the primary AC delineates the most highly myelinated auditory area. The content of myelinated fibers and radial bundles gradually decreases, with increasing distance from the primary AC (Glasser and Van Essen 2011; Nieuwenhuys 2013). Furthermore, our functional parcellation may partially reflect cytoarchitectonically defined areas including Te1, Te2, Te3, STS1, and STS2 (Morosan et al. 2001; Morosan et al. 2005; Amunts et al. 2020). In the 7-cluster parcellation, the red cluster (cluster 2) likely corresponds to the Te1 and Te2 areas, whereas the violet cluster (cluster 5) may correspond to the Te3 area. The dark green (cluster 7) and purple (cluster 6) clusters may represent STS1 and STS2 areas. Despite an unclear relationship between functional and cytoarchitectonic features, this convergence of functional and anatomical distinctions between subareas may indicate the underlying hierarchical organization in the human AC.
Intriguingly, the functional parcellations of the human AC from cortico-cortical and cortico-cerebellar connectivity show highly similar patterns. Technically, the samples in the AC share similar underlying structures in different feature spaces (cortical- and cerebellar-connectivity spaces), suggesting that the samples might distribute in highly similar manifolds imbedded in 2 different feature spaces. In other words, the functional organization of the AC, as reflected by cortico-cortical connectivity, including the hierarchy, lateralization, modularity, etc., might be well preserved in its connections with the cerebellum. Thus, the functional organization of cerebral cortex can be projected to and kept intact topographically within the cerebellum based on particular transformations, which has been previously postulated in numerous landmark studies (Buckner et al. 2011; Guell et al. 2018; Marek et al. 2018; Ji et al. 2019).
Rethinking Cerebellar Functional Mapping Using Resting-State fMRI
Functional parcellation based on resting-state functional connectivity has contributed greatly to our current understanding of cerebellar functional topography. For example, Buckner et al. 2011 demonstrated large-scale functional networks in the cerebellum using resting-state fMRI. Marek et al. 2018 seminal paper identified individual-specific functional cerebellar networks. However, auditory regions were overlooked by these influential studies, both of which employed winner-take-all strategies for network parcellation that may dilute fine-grained differences in the relatively small AC. In the present study, we demonstrate divergent AC–cerebellar functional connectivity pathways using seeds placed in AC subregions showing low and high intersubject variability (Ren et al. 2020), probably corresponding to lower- and higher-order auditory processes, respectively. Functional connectivity analyses with auditory-specific seeds revealed important features of the auditory cortico-cerebellar connectivity as well as the functional segregation within the AC. Our findings underscore the need to be cautious when mapping large-scale functional networks using functional connectivity parcellation strategies and urge us to be mindful of the pitfalls they impose by obscuring susceptible but critical networks. Indeed, ascribing a single function to a given voxel is tenuous at best, given a single voxel may be composed of somewhere on the order of 100 000 neurons (Helmstaedter 2013), and therefore may represent more than one functional domain. In this way, overlapping and nonwinner-take-all parcellation strategies are likely to yield more accurate and fine-detailed functional maps of the brain and should be adopted in future neuroimaging studies.
Potential Applications for Clinical Interventions
Extensive evidence derived from clinical case reports as well as empirical data implicates disruptions in cortico-cerebellar circuitry in the pathogenesis of psychotic disorders with auditory hallucinations, such as is often manifested in schizophrenia. Andreasen and colleagues proposed the “cognitive dysmetria” model to explain cortico-cerebellar circuit dysfunction that result in disrupted coordination of cognitive and sensory processing (Andreasen et al. 1996; Andreasen et al. 1999). In this model, the unitary disruption in these circuits are purported to explain diverse schizophrenia symptoms, such as hallucinations and impairments in language. Similarly, Schmahmann proposed the “dysmetria of thought” model in an attempt to categorize various cerebellar disorders into a single framework, in which clinical phenotypes are reflected by either an undershooting or overshooting of several cognitive abilities (Schmahmann 1998). According to this model, the cerebellum normally “detects, prevents, and corrects mismatches” between intended and perceived outcomes for mental processes (Schmahmann 1998) and neuropsychiatric symptoms, including those of psychosis, emerge when cerebellar function is disrupted (Schmahmann 1998). These models suggest that the cerebellum could be a potential target for clinical interventions for psychosis disorders. Recent anatomical and functional evidence also supports the cortico-cerebellar dysfunction in psychiatric disorders. For example, patients with auditory hallucinations show lower gray matter volume in lobule VIII than healthy controls (Cierpka et al. 2017) and the cerebellum is functionally activated during auditory hallucinations (Zmigrod et al. 2016; Powers et al. 2017). Aberrant cortico-cerebellar functional connectivity in patients with auditory hallucinations has also been reported (Clos et al. 2014; Shinn et al. 2015; Shinn et al. 2017; Mallikarjun et al. 2018). Taken together, a better understanding of the auditory cortico-cerebellar circuits, such as reported in the present study, might provide potential targets to treat auditory-related symptoms such as auditory hallucinations or language impairments.
Caveats and Limitations
Several caveats and limitations are worth considering when interpreting the aforementioned results. First, the low- and high-variability areas of the AC were not defined using auditory tasks but were estimated using interindividual variability in functional connectivity. Second, several confounds may introduce additional variability in the estimation of connectivity by blurring functional signals, including the relatively large voxel sizes (3 mm and 3.4 mm acquired for the CoRR-HNU and GSP datasets, respectively) and the generous smoothing kernel size (FWHM = 6 mm) used in data processing. Despite previous reports about the functional subdivisions in the HG (Moerel et al. 2014), this region has been shown to be a unitary functional structure in terms of both interindividual variability in functional connectivity and functional parcellation of the AC, likely due to the large voxel size. Third, outliers of head motion were not scrubbed in our analyses. However, both datasets were collected in young, healthy participants with little head motion (mean = 0.044 mm for CoRR-HNU dataset and mean = 0.060 mm for GSP100 dataset) and low outlier rate of motion (0.48% for a threshold 0.25 mm and 0.14% for a threshold 0.5 mm in CoRR-HNU dataset; 1.57% for a threshold 0.25 mm and 0.30% for a threshold 0.5 mm in GSP100 dataset). The small proportion of motion outliers present in our samples may have slightly impacted our estimation of long-distance functional connectivity at the group-level; however, the effects are likely negligible given the minimal head motion and relatively low outlier rate. Fourth, the AC parcellation is still lacking multimodal validation, although our parcellation boundary is consistent with the sharp boundary between the low- and high-variability regions and may reflect the differences in myelin content between subareas. Our AC parcellation should be validated by task-evoked fMRI, electrophysiological and/or other modalities in future studies. Finally, our analyses were conducted at the group-level. Individual-specific auditory cortico-cerebellar circuits and individualized functional parcellation of the AC will facilitate personalized precision medicine but require reliable, higher-resolution fMRI data and advanced analytical methods.
Funding
National Key Research and Development Program of China (grant numbers 2016YFC0105502, 2016YFC1306303, 2019YFB2204904); National Natural Science Foundation of China (grant numbers 81790652, 81790650, 61671042, 81527901, U1809209, 81790654, 81671285); National Institutes of Health (grant numbers R01NS091604, P50MH106435, R01DC016765, R01DC017991, R01DC016915, 1R21MH121831, 5K01MH111802); Shenzhen International Cooperative Research Project (grant number GJHZ20180930110402104).
Notes
Conflict of Interest: None declared.
Supplementary Material
Contributor Information
Jianxun Ren, National Engineering Laboratory for Neuromodulation, School of Aerospace Engineering, Tsinghua University, 100084 Beijing, China; Athinoula A. Martinos Center for Biomedical Imaging, Department of Radiology, Massachusetts General Hospital, Harvard Medical School, Charlestown, MA 02129, USA.
Catherine S Hubbard, Department of Neuroscience, Medical University of South Carolina, Charleston, SC 29425, USA.
Jyrki Ahveninen, Athinoula A. Martinos Center for Biomedical Imaging, Department of Radiology, Massachusetts General Hospital, Harvard Medical School, Charlestown, MA 02129, USA.
Weigang Cui, Athinoula A. Martinos Center for Biomedical Imaging, Department of Radiology, Massachusetts General Hospital, Harvard Medical School, Charlestown, MA 02129, USA; Department of Neuroscience, Medical University of South Carolina, Charleston, SC 29425, USA; Department of Automation Sciences and Electrical Engineering, Beihang University, 100083 Beijing, China.
Meiling Li, Athinoula A. Martinos Center for Biomedical Imaging, Department of Radiology, Massachusetts General Hospital, Harvard Medical School, Charlestown, MA 02129, USA.
Xiaolong Peng, Department of Neuroscience, Medical University of South Carolina, Charleston, SC 29425, USA.
Guoming Luan, Department of Neurosurgery, Comprehensive Epilepsy Center, Sanbo Brain Hospital, Capital Medical University, 100093 Beijing, China.
Ying Han, Department of Neurology, Xuanwu Hospital of Capital Medical University, 100053 Beijing, China.
Yang Li, Department of Automation Sciences and Electrical Engineering, Beihang University, 100083 Beijing, China.
Ann K Shinn, Psychotic Disorders Division, McLean Hospital, Harvard Medical School, Belmont, MA 02478, USA.
Danhong Wang, Athinoula A. Martinos Center for Biomedical Imaging, Department of Radiology, Massachusetts General Hospital, Harvard Medical School, Charlestown, MA 02129, USA.
Luming Li, National Engineering Laboratory for Neuromodulation, School of Aerospace Engineering, Tsinghua University, 100084 Beijing, China; Precision Medicine & Healthcare Research Center, Tsinghua-Berkeley Shenzhen Institute, Tsinghua University, 518055 Shenzhen, China; IDG/McGovern Institute for Brain Research at Tsinghua University, 100084 Beijing, China.
Hesheng Liu, Athinoula A. Martinos Center for Biomedical Imaging, Department of Radiology, Massachusetts General Hospital, Harvard Medical School, Charlestown, MA 02129, USA; Department of Neuroscience, Medical University of South Carolina, Charleston, SC 29425, USA.
References
- Ackermann H, Graber S, Hertrich I, Daum I. 1999. Cerebellar contributions to the perception of temporal cues within the speech and nonspeech domain. Brain Lang. 67:228–241. [DOI] [PubMed] [Google Scholar]
- Ahveninen J, Chang WT, Huang S, Keil B, Kopco N, Rossi S, Bonmassar G, Witzel T, Polimeni JR. 2016. Intracortical depth analyses of frequency-sensitive regions of human auditory cortex using 7TfMRI. Neuroimage. 143:116–127. [DOI] [PMC free article] [PubMed] [Google Scholar]
- Ahveninen J, Huang S, Nummenmaa A, Belliveau JW, Hung AY, Jääskeläinen IP, Rauschecker JP, Rossi S, Tiitinen H, Raij T. 2013. Evidence for distinct human auditory cortex regions for sound location versus identity processing. Nat Commun. 4:1–8. [DOI] [PMC free article] [PubMed] [Google Scholar]
- Ahveninen J, Jaaskelainen IP, Raij T, Bonmassar G, Devore S, Hamalainen M, Levanen S, Lin F-HH, Sams M, Shinn-Cunningham BG, et al. 2006. Task-modulated "what" and "where" pathways in human auditory cortex. Proc. Natl Acad Sci U S A. 103:14608–14613. [DOI] [PMC free article] [PubMed] [Google Scholar]
- Aitkin LM, Boyd J. 1975. Responses of single units in cerebellar vermis of the cat to monaural and binaural stimuli. J Neurophysiol. 38:418–429. [DOI] [PubMed] [Google Scholar]
- Altman JA, Bechterev NN, Radionova EA, Shmigidina GN, Syka J. 1976. Electrical responses of the auditory area of the cerebellar cortex to acoustic stimulation. Exp Brain Res. 26:285–298. [DOI] [PubMed] [Google Scholar]
- Amunts K, Mohlberg H, Bludau S, Zilles K. 2020. Julich-Brain: A 3D probabilistic atlas of the human brain's cytoarchitecture. Science. 369:988–992. [DOI] [PubMed] [Google Scholar]
- Andreasen NC, Nopoulos P, O'Leary DS, Miller DD, Wassink T, Flaum M. 1999. Defining the phenotype of schizophrenia: cognitive dysmetria and its neural mechanisms. Biol Psychiatry. 46:908–920. [DOI] [PubMed] [Google Scholar]
- Andreasen NC, O'Leary DS, Cizadlo T, Arndt S, Rezai K, Boles Ponto LL, Watkins GL, Hichwa RD. 1996. Schizophrenia and cognitive dysmetria: a positron-emission tomography study of dysfunctional prefrontal-thalamic-cerebellar circuitry. Proc Natl Acad Sci U S A. 93:9985–9990. [DOI] [PMC free article] [PubMed] [Google Scholar]
- Avants BB, Tustison N, Song G. 2009. Advanced normalization tools (ANTS). Insight J. 2:1–35. [Google Scholar]
- Azizi SA, Burne RA, Woodward DJ. 1985. The auditory corticopontocerebellar projection in the rat: inputs to the paraflocculus and midvermis. An anatomical and physiological study. Exp Brain Res. 59:36–49. [DOI] [PubMed] [Google Scholar]
- Azizi SA, Woodward DJ. 1990. Interactions of visual and auditory mossy fiber inputs in the paraflocculus of the rat: a gating action of multimodal inputs. Brain Res. 533:255–262. [DOI] [PubMed] [Google Scholar]
- Baumann O, Borra RJ, Bower JM, Cullen KE, Habas C, Ivry RB, Leggio M, Mattingley JB, Molinari M, Moulton EA, et al. 2015. Consensus paper: the role of the cerebellum in perceptual processes. Cerebellum. 14:197–220. [DOI] [PMC free article] [PubMed] [Google Scholar]
- Baumann O, Mattingley JB. 2010. Scaling of neural responses to visual and auditory motion in the human cerebellum. J Neurosci. 30:4489–4495. [DOI] [PMC free article] [PubMed] [Google Scholar]
- Belin P, McAdams S, Smith B, Savel S, Thivard L, Samson S, Samson Y. 1998. The functional anatomy of sound intensity discrimination. J Neurosci. 18:6388–6394. [DOI] [PMC free article] [PubMed] [Google Scholar]
- Belin P, McAdams S, Thivard L, Smith B, Savel S, Zilbovicius M, Samson S, Samson Y. 2002. The neuroanatomical substrate of sound duration discrimination. Neuropsychologia. 40:1956–1964. [DOI] [PubMed] [Google Scholar]
- Berlot E, Arts R, Smit J, George E, Gulban OF, Moerel M, Stokroos R, Formisano E, De Martino F. 2020. A 7 tesla fMRI investigation of human tinnitus percept in cortical and subcortical auditory areas. Neuroimage Clin. 25:102166. [DOI] [PMC free article] [PubMed] [Google Scholar]
- Besle J, Mougin O, Sanchez-Panchuelo RM, Lanting C, Gowland P, Bowtell R, Francis S, Krumbholz K. 2019. Is human auditory cortex organization compatible with the monkey model? Contrary evidence from ultra-high-field functional and structural MRI. Cereb Cortex. 29:410–428. [DOI] [PMC free article] [PubMed] [Google Scholar]
- Brodal P. 1979. The pontocerebellar projection in the rhesus monkey: an experimental study with retrograde axonal transport of horseradish peroxidase. Neuroscience. 4:193–208. [DOI] [PubMed] [Google Scholar]
- Buckner RL. 2013. The cerebellum and cognitive function: 25 years of insight from anatomy and neuroimaging. Neuron. 80:807–815. [DOI] [PubMed] [Google Scholar]
- Buckner RL, Krienen FM, Castellanos A, Diaz JC, Yeo BTT. 2011. The organization of the human cerebellum estimated by intrinsic functional connectivity. J Neurophysiol. 106:2322–2345. [DOI] [PMC free article] [PubMed] [Google Scholar]
- Callan DE, Kawato M, Parsons L, Turner R. 2007. Speech and song: the role of the cerebellum. Cerebellum. 6:321–327. [DOI] [PubMed] [Google Scholar]
- Callan DE, Tsytsarev V, Hanakawa T, Callan AM, Katsuhara M, Fukuyama H, Turner R. 2006. Song and speech: brain regions involved with perception and covert production. Neuroimage. 31:1327–1342. [DOI] [PubMed] [Google Scholar]
- Cierpka M, Wolf ND, Kubera KM, Schmitgen MM, Vasic N, Frasch K, Wolf RC. 2017. Cerebellar contributions to persistent auditory verbal hallucinations in patients with schizophrenia. Cerebellum. 16:964–972. [DOI] [PubMed] [Google Scholar]
- Clos M, Diederen KMJ, Meijering AL, Sommer IE, Eickhoff SB. 2014. Aberrant connectivity of areas for decoding degraded speech in patients with auditory verbal hallucinations. Brain Struct Funct. 219:581–594. [DOI] [PMC free article] [PubMed] [Google Scholar]
- Coalson TS, Van Essen DC, Glasser MF. 2018. The impact of traditional neuroimaging methods on the spatial localization of cortical areas. Proc Natl Acad Sci U S A. 115:E6356–E6365. [DOI] [PMC free article] [PubMed] [Google Scholar]
- Dick F, Tierney AT, Lutti A, Josephs O, Sereno MI, Weiskopf N. 2012. In vivo functional and myeloarchitectonic mapping of human primary auditory areas. J Neurosci. 32:16095–16105. [DOI] [PMC free article] [PubMed] [Google Scholar]
- Diedrichsen J, Balsters JH, Flavell J, Cussans E, Ramnani N. 2009. A probabilistic MR atlas of the human cerebellum. Neuroimage. 46:39–46. [DOI] [PubMed] [Google Scholar]
- Diedrichsen J, King M, Hernandez-Castillo C, Sereno M, Ivry RB. 2019. Universal transform or multiple functionality? Understanding the contribution of the human cerebellum across task domains. Neuron. 102:918–928. [DOI] [PMC free article] [PubMed] [Google Scholar]
- Fischl B, Sereno MI. 2018. Microstructural parcellation of the human brain. Neuroimage. 182:219–231. [DOI] [PMC free article] [PubMed] [Google Scholar]
- Fischl B, Sereno MI, Dale AM. 1999. Cortical surface-based analysis. II: inflation, flattening, and a surface-based coordinate system. Neuroimage. 9:195–207. [DOI] [PubMed] [Google Scholar]
- Formisano E, Kim DS, Di Salle F, Van De Moortele PF, Ugurbil K, Goebel R. 2003. Mirror-symmetric tonotopic maps in human primary auditory cortex. Neuron. 40:859–869. [DOI] [PubMed] [Google Scholar]
- Freeman JA. 1970. Responses of cat cerebellar Purkinje cells to convergent inputs from cerebral cortex and peripheral sensory systems. J Neurophysiol. 33:697–712. [DOI] [PubMed] [Google Scholar]
- Gacek RR. 1973. A cerebellocochlear nucleus pathway in the cat. Exp Neurol. 41:101–112. [DOI] [PubMed] [Google Scholar]
- Glasser MF, Coalson TS, Robinson EC, Hacker CD, Harwell J, Yacoub E, Ugurbil K, Andersson J, Beckmann CF, Jenkinson M, et al. 2016. A multi-modal parcellation of human cerebral cortex. Nature. 536:171–178. [DOI] [PMC free article] [PubMed] [Google Scholar]
- Glasser MF, Van Essen DC. 2011. Mapping human cortical areas in vivo based on myelin content as revealed by T1- and T2-weighted MRI. J Neurosci. 31:11597–11616. [DOI] [PMC free article] [PubMed] [Google Scholar]
- Grasby PM, Frith CD, Friston KJ, Bench C, Frackowiak RS, Dolan RJ. 1993. Functional mapping of brain areas implicated in auditory--verbal memory function. Brain. 116(Pt 1):1–20. [DOI] [PubMed] [Google Scholar]
- Greve DN, Fischl B. 2009. Accurate and robust brain image alignment using boundary-based registration. Neuroimage. 48:63–72. [DOI] [PMC free article] [PubMed] [Google Scholar]
- Grube M, Cooper FE, Chinnery PF, Griffiths TD. 2010a. Dissociation of duration-based and beat-based auditory timing in cerebellar degeneration. Proc Natl Acad Sci U S A. 107:11597–11601. [DOI] [PMC free article] [PubMed] [Google Scholar]
- Grube M, Lee KH, Griffiths TD, Barker AT, Woodruff PW. 2010b. Transcranial magnetic theta-burst stimulation of the human cerebellum distinguishes absolute, duration-based from relative, beat-based perception of subsecond time intervals. Front Psychol. 1:1–8. [DOI] [PMC free article] [PubMed] [Google Scholar]
- Guediche S, Holt LL, Laurent P, Lim SJ, Fiez JA. 2015. Evidence for cerebellar contributions to adaptive plasticity in speech perception. Cereb Cortex. 25:1867–1877. [DOI] [PMC free article] [PubMed] [Google Scholar]
- Guell X, Schmahmann JD, Gabrieli JDE, Ghosh SS. 2018. Functional gradients of the cerebellum. eLife. 7:1–22. [DOI] [PMC free article] [PubMed] [Google Scholar]
- Hakkinen S, Rinne T. 2018. Intrinsic, stimulus-driven and task-dependent connectivity in human auditory cortex. Brain Struct Funct. 223:2113–2127. [DOI] [PubMed] [Google Scholar]
- Helmstaedter M. 2013. Cellular-resolution connectomics: challenges of dense neural circuit reconstruction. Nat Methods. 10:501–507. [DOI] [PubMed] [Google Scholar]
- Heßelmann V, Hesselmann V, Wedekind C, Kugel H, Schulte O, Krug B, Klug N, Lackner KJ. 2001. Functional magnetic resonance imaging of human pontine auditory pathway. Hear Res. 158:160–164. [DOI] [PubMed] [Google Scholar]
- Highstein S, Coleman PD. 1968. Responses of the cerebellar vermis to binaural auditory stimulation. Brain Res. 10:470–473. [DOI] [PubMed] [Google Scholar]
- Holmes AJ, Hollinshead MO, O’keefe TM, Petrov VI, Fariello GR, Wald LL, Fischl B, Rosen BR, Mair RW, Roffman JL. 2015. Brain Genomics Superstruct Project initial data release with structural, functional, and behavioral measures. Sci Data. 2:1–16. [DOI] [PMC free article] [PubMed] [Google Scholar]
- Huang CM, Liu G. 1985. Electrophysiological mapping of the auditory areas in the cerebellum of the cat. Brain Res. 335:121–129. [DOI] [PubMed] [Google Scholar]
- Huang CM, Liu G, Huang R. 1982. Projections from the cochlear nucleus to the cerebellum. Brain Res. 244:1–8. [DOI] [PubMed] [Google Scholar]
- Humphries C, Liebenthal E, Binder JR. 2010. Tonotopic organization of human auditory cortex. Neuroimage. 50:1202–1211. [DOI] [PMC free article] [PubMed] [Google Scholar]
- Ivry RB, Keele SW. 1989. Timing functions of the cerebellum. J Cogn Neurosci. 1:136–152. [DOI] [PubMed] [Google Scholar]
- Ji JL, Spronk M, Kulkarni K, Repovš G, Anticevic A, Cole MW. 2019. Mapping the human brain's cortical-subcortical functional network organization. NeuroImage. 185:35–57. [DOI] [PMC free article] [PubMed] [Google Scholar]
- Kaas JH, Hackett TA. 2000. Subdivisions of auditory cortex and processing streams in primates. Proc Natl Acad Sci. 97:11793–11799. [DOI] [PMC free article] [PubMed] [Google Scholar]
- Koch G, Oliveri M, Caltagirone C. 2009. Neural networks engaged in milliseconds and seconds time processing: evidence from transcranial magnetic stimulation and patients with cortical or subcortical dysfunction. Philos Trans Royal Soc B. 364:1907–1918. [DOI] [PMC free article] [PubMed] [Google Scholar]
- Koziol LF, Budding D, Andreasen N, D'Arrigo S, Bulgheroni S, Imamizu H, Ito M, Manto M, Marvel C, Parker K, et al. 2014. Consensus paper: the cerebellum's role in movement and cognition. Cerebellum. 13:151–177. [DOI] [PMC free article] [PubMed] [Google Scholar]
- Krienen FM, Buckner RL. 2009. Segregated fronto-cerebellar circuits revealed by intrinsic functional connectivity. Cerebr Cortex. 19:2485–2497. [DOI] [PMC free article] [PubMed] [Google Scholar]
- Kuśmierek P, Rauschecker JP. 2009. Functional specialization of medial auditory belt cortex in the alert rhesus monkey. J Neurophysiol. 102:1606–1622. [DOI] [PMC free article] [PubMed] [Google Scholar]
- Li J, Kong R, Liegeois R, Orban C, Tan Y, Sun N, Holmes AJ, Sabuncu MR, Ge T, Yeo BTT. 2019. Global signal regression strengthens association between resting-state functional connectivity and behavior. Neuroimage. 196:126–141. [DOI] [PMC free article] [PubMed] [Google Scholar]
- Lu J, Liu H, Zhang M, Wang D, Cao Y, Ma Q, Rong D, Wang X, Buckner RL, Li K. 2011. Focal pontine lesions provide evidence that intrinsic functional connectivity reflects polysynaptic anatomical pathways. J Neurosci. 31:15065–15071. [DOI] [PMC free article] [PubMed] [Google Scholar]
- Mallikarjun PK, Lalousis PA, Dunne TF, Heinze K, Reniers RL, Broome MR, Farmah B, Oyebode F, Wood SJ, Upthegrove R. 2018. Aberrant salience network functional connectivity in auditory verbal hallucinations: a first episode psychosis sample. Transl Psychiatry. 8:1–9. [DOI] [PMC free article] [PubMed] [Google Scholar]
- Marek S, Siegel JS, Gordon EM, Raut RV, Gratton C, Newbold DJ, Ortega M, Laumann T, Adeyemo B, Miller DB. 2018. Spatial and temporal organization of the individual human cerebellum. Neuron. 100:977–993. e977. [DOI] [PMC free article] [PubMed] [Google Scholar]
- Mathiak K, Hertrich I, Grodd W, Ackermann H. 2004. Discrimination of temporal information at the cerebellum: functional magnetic resonance imaging of nonverbal auditory memory. Neuroimage. 21:154–162. [DOI] [PubMed] [Google Scholar]
- Moerel M, De Martino F, Formisano E. 2014. An anatomical and functional topography of human auditory cortical areas. Front Neurosci. 8:1–14. [DOI] [PMC free article] [PubMed] [Google Scholar]
- Morel A, Garraghty PE, Kaas JH. 1993. Tonotopic organization, architectonic fields, and connections of auditory cortex in macaque monkeys. J Comp Neurol. 335:437–459. [DOI] [PubMed] [Google Scholar]
- Morosan P, Rademacher J, Schleicher A, Amunts K, Schormann T, Zilles K. 2001. Human primary auditory cortex: cytoarchitectonic subdivisions and mapping into a spatial reference system. NeuroImage. 13:684–701. [DOI] [PubMed] [Google Scholar]
- Morosan P, Schleicher A, Amunts K, Zilles K. 2005. Multimodal architectonic mapping of human superior temporal gyrus. Anat Embryol (Berl). 210:401–406. [DOI] [PubMed] [Google Scholar]
- Mueller S, Wang D, Fox MD, Yeo BT, Sepulcre J, Sabuncu MR, Shafee R, Lu J, Liu H. 2013. Individual variability in functional connectivity architecture of the human brain. Neuron. 77:586–595. [DOI] [PMC free article] [PubMed] [Google Scholar]
- Nieuwenhuys R. 2013. The myeloarchitectonic studies on the human cerebral cortex of the Vogt-Vogt school, and their significance for the interpretation of functional neuroimaging data. Brain Struct Funct. 218:303–352. [DOI] [PubMed] [Google Scholar]
- O'Reilly JX, Beckmann CF, Tomassini V, Ramnani N, Johansen-Berg H. 2010. Distinct and overlapping functional zones in the cerebellum defined by resting state functional connectivity. Cereb Cortex. 20:953–965. [DOI] [PMC free article] [PubMed] [Google Scholar]
- Parsons LM. 2001. Exploring the functional neuroanatomy of music performance, perception, and comprehension. Ann N Y Acad Sci. 930:211–231. [DOI] [PubMed] [Google Scholar]
- Parsons LM, Petacchi A, Schmahmann JD, Bower JM. 2009. Pitch discrimination in cerebellar patients: evidence for a sensory deficit. Brain Res. 1303:84–96. [DOI] [PubMed] [Google Scholar]
- Pastor MA, Artieda J, Arbizu J, Marti-Climent JM, Penuelas I, Masdeu JC. 2002. Activation of human cerebral and cerebellar cortex by auditory stimulation at 40 Hz. J Neurosci. 22:10501–10506. [DOI] [PMC free article] [PubMed] [Google Scholar]
- Pastor MA, Thut G, Pascual-Leone A. 2006. Modulation of steady-state auditory evoked potentials by cerebellar rTMS. Exp Brain Res. 175:702–709. [DOI] [PubMed] [Google Scholar]
- Pastor MA, Vidaurre C, Fernández-Seara MA, Villanueva A, Friston KJ. 2008. Frequency-specific coupling in the cortico-cerebellar auditory system. J Neurophysiol. 100:1699–1705. [DOI] [PMC free article] [PubMed] [Google Scholar]
- Petacchi A, Kaernbach C, Ratnam R, Bower JM. 2011. Increased activation of the human cerebellum during pitch discrimination: a positron emission tomography (PET) study. Hear Res. 282:35–48. [DOI] [PubMed] [Google Scholar]
- Petacchi A, Laird AR, Fox PT, Bower JM. 2005. Cerebellum and auditory function: an ALE meta-analysis of functional neuroimaging studies. Hum Brain Mapp. 25:118–128. [DOI] [PMC free article] [PubMed] [Google Scholar]
- Power JD, Laumann TO, Plitt M, Martin A, Petersen SE. 2017a. On global fMRI signals and simulations. Trends Cogn Sci. 21:911–913. [DOI] [PubMed] [Google Scholar]
- Power JD, Plitt M, Laumann TO, Martin A. 2017b. Sources and implications of whole-brain fMRI signals in humans. Neuroimage. 146:609–625. [DOI] [PMC free article] [PubMed] [Google Scholar]
- Powers AR, Mathys C, Corlett PR. 2017. Pavlovian conditioning–induced hallucinations result from overweighting of perceptual priors. Science. 357:596–600. [DOI] [PMC free article] [PubMed] [Google Scholar]
- Rauschecker JP, Scott SK. 2009. Maps and streams in the auditory cortex: nonhuman primates illuminate human speech processing. Nat Neurosci. 12:718–724. [DOI] [PMC free article] [PubMed] [Google Scholar]
- Rauschecker JP, Tian B. 2000. Mechanisms and streams for processing of "what" and "where" in auditory cortex. Proc Natl Acad Sci U S A. 97:11800–11806. [DOI] [PMC free article] [PubMed] [Google Scholar]
- Rauschecker JP, Tian B. 2004. Processing of band-passed noise in the lateral auditory belt cortex of the rhesus monkey. J Neurophysiol. 91:2578–2589. [DOI] [PubMed] [Google Scholar]
- Rauschecker JP, Tian B, Hauser M. 1995. Processing of complex sounds in the macaque nonprimary auditory cortex. Science. 268:111–114. [DOI] [PubMed] [Google Scholar]
- Ren J, Liu H, Xu T, Schoeppe F, Wang D, Li M, Lin Y, Ramirez J, Lu J, Li L. 2020. Individual variability in functional organization of the human and monkey auditory cortex. Cereb Cortex. bhaa366. 10.1093/cercor/bhaa366. [DOI] [PMC free article] [PubMed] [Google Scholar]
- Rivier F, Clarke S. 1997. Cytochrome oxidase, acetylcholinesterase, and NADPH-diaphorase staining in human supratemporal and insular cortex: evidence for multiple auditory areas. NeuroImage. 6:288–304. [DOI] [PubMed] [Google Scholar]
- Romani GL, Williamson SJ, Kaufman L. 1982. Tonotopic organization of the human auditory cortex. Science. 216:1339–1340. [DOI] [PubMed] [Google Scholar]
- Ronconi L, Casartelli L, Carna S, Molteni M, Arrigoni F, Borgatti R. 2017. When one is enough: impaired multisensory integration in cerebellar agenesis. Cereb Cortex. 27:2041–2051. [DOI] [PubMed] [Google Scholar]
- Rossi G, Cortesina G, Robecchi MG. 1967. Cerebellifugal fibres to the cochlear nuclei and superior olivary complex. Acta Oto-Laryngol. 63:166–171. [DOI] [PubMed] [Google Scholar]
- Rousseeuw PJ. 1987. Silhouettes: a graphical aid to the interpretation and validation of cluster analysis. J Comput Appl Math. 20:53–65. [Google Scholar]
- Schmahmann JD. 1996. From movement to thought: anatomic substrates of the cerebellar contribution to cognitive processing. Hum Brain Mapp. 4:174–198. [DOI] [PubMed] [Google Scholar]
- Schmahmann JD. 1998. Dysmetria of thought: clinical consequences of cerebellar dysfunction on cognition and affect. Trends Cogn Sci. 2:362–371. [DOI] [PubMed] [Google Scholar]
- Schmahmann JD, Doyon J, McDonald D, Holmes C, Lavoie K, Hurwitz AS, Kabani N, Toga A, Evans A, Petrides M. 1999. Three-dimensional MRI atlas of the human cerebellum in proportional stereotaxic space. Neuroimage. 10:233–260. [DOI] [PubMed] [Google Scholar]
- Schmahmann JD, Pandya DN. 1991. Projections to the basis pontis from the superior temporal sulcus and superior temporal region in the rhesus monkey. J Comparative Neurol. 308:224–248. [DOI] [PubMed] [Google Scholar]
- Shinn AK, Baker JT, Lewandowski KE, Ongur D, Cohen BM. 2015. Aberrant cerebellar connectivity in motor and association networks in schizophrenia. Front Hum Neurosci. 9:134. [DOI] [PMC free article] [PubMed] [Google Scholar]
- Shinn AK, Roh YS, Ravichandran CT, Baker JT, Ongur D, Cohen BM. 2017. Aberrant cerebellar connectivity in bipolar disorder with psychosis. Biol Psychiatry Cogn Neurosci Neuroimaging. 2:438–448. [DOI] [PMC free article] [PubMed] [Google Scholar]
- Snider RS, Stowell A. 1944. Receiving areas of the tactile, auditory, and visual systems in the cerebellum. J Neurophysiol. 7:331–357. [Google Scholar]
- Sokolov AA, Erb M, Grodd W, Pavlova MA. 2014. Structural loop between the cerebellum and the superior temporal sulcus: evidence from diffusion tensor imaging. Cereb Cortex. 24:626–632. [DOI] [PubMed] [Google Scholar]
- Stoecklein S, Hilgendorff A, Li M, Forster K, Flemmer AW, Galie F, Wunderlich S, Wang D, Stein S, Ehrhardt H, et al. 2020. Variable functional connectivity architecture of the preterm human brain: impact of developmental cortical expansion and maturation. Proc Natl Acad Sci U S A. 117:1201–1206. [DOI] [PMC free article] [PubMed] [Google Scholar]
- Strick PL, Dum RP, Fiez JA. 2009. Cerebellum and nonmotor function. Annu Rev Neurosci. 32:413–434. [DOI] [PubMed] [Google Scholar]
- Teki S, Grube M, Kumar S, Griffiths TD. 2011. Distinct neural substrates of duration-based and beat-based auditory timing. J Neurosci. 31:3805–3812. [DOI] [PMC free article] [PubMed] [Google Scholar]
- Wallace MN, Johnston PW, Palmer AR. 2002. Histochemical identification of cortical areas in the auditory region of the human brain. Exp Brain Res. 143:499–508. [DOI] [PubMed] [Google Scholar]
- Wang D, Buckner RL, Fox MD, Holt DJ, Holmes AJ, Stoecklein S, Langs G, Pan R, Qian T, Li K, et al. 2015. Parcellating cortical functional networks in individuals. Nat Neurosci. 18:1853–1860. [DOI] [PMC free article] [PubMed] [Google Scholar]
- Wang D, Buckner RL, Liu H. 2013. Cerebellar asymmetry and its relation to cerebral asymmetry estimated by intrinsic functional connectivity. J Neurophysiol. 109:46–57. [DOI] [PMC free article] [PubMed] [Google Scholar]
- Wolfe JW. 1972. Responses of the cerebellar auditory area to pure tone stimuli. Exp Neurol. 36:295–309. [DOI] [PubMed] [Google Scholar]
- Yan Y, Dahmani L, Ren J, Shen L, Peng X, Wang R, He C, Jiang C, Gong C, Tian Y, et al. 2020. Reconstructing lost BOLD signal in individual participants using deep machine learning. Nat Commun. 11:5046. [DOI] [PMC free article] [PubMed] [Google Scholar]
- Yeo BT, Krienen FM, Sepulcre J, Sabuncu MR, Lashkari D, Hollinshead M, Roffman JL, Smoller JW, Zollei L, Polimeni JR, et al. 2011. The organization of the human cerebral cortex estimated by intrinsic functional connectivity. J Neurophysiol. 106:1125–1165. [DOI] [PMC free article] [PubMed] [Google Scholar]
- Zmigrod L, Garrison JR, Carr J, Simons JS. 2016. The neural mechanisms of hallucinations: a quantitative meta-analysis of neuroimaging studies. Neurosci Biobehav Rev. 69:113–123. [DOI] [PubMed] [Google Scholar]
- Zuo XN, Anderson JS, Bellec P, Birn RM, Biswal BB, Blautzik J, Breitner JC, Buckner RL, Calhoun VD, Castellanos FX, et al. 2014. An open science resource for establishing reliability and reproducibility in functional connectomics. Sci Data. 1:140049. [DOI] [PMC free article] [PubMed] [Google Scholar]
Associated Data
This section collects any data citations, data availability statements, or supplementary materials included in this article.
Supplementary Materials
Data Availability Statement
The CoRR-HNU dataset is publicly available through the Consortium for Reliability and Reproducibility Project (http://fcon_1000.projects.nitrc.org/indi/CoRR/html/hnu_1.html). The GSP dataset is available through the Brain GSP (https://www.neuroinfo.org/gsp). MATLAB codes that were utilized in the present study are available from the corresponding authors upon request.