Abstract
Inborn errors of metabolism (IEM) although individually rare, together constitute a significant proportion of childhood neurological disorders. Majority of these disorders occur due to deficiency of an enzyme in a specific metabolic pathway, leading to damage by accumulation of a toxic substrate or deficiency of an essential metabolite. Early diagnosis is crucial in many of these conditions to prevent or minimise brain damage. Whilst many of the neuroimaging features are nonspecific, certain disorders demonstrate specific patterns due to selective vulnerability of different structures to different insults. Along with clinical and biochemical profile, neuroimaging thus plays a pivotal role in differentiating metabolic disorders from other causes, in providing a differential diagnosis or suggesting a metabolic pathway derangement, and on occasion also helps make a specific diagnosis. This allows initiation of targeted metabolic and genetic work up and treatment. Familiarity with the clinical features, relevant biochemical features and neuroimaging findings of common metabolic disorders to facilitate a prompt diagnosis cannot thus be overemphasized. In this article, we describe the latest classification scheme, the clinical and biochemical clues and common radiological patterns. The diagnostic algorithm followed in daily practice after clinico-radiological phenotyping is alluded to and illustrated by clinical vignettes. Focused sections on neonatal metabolic disorders and mitochondrial disorders are also provided. The purpose of this article is to provide a brief overview and serve as a practical primer to clinical and radiological phenotypes and diagnostic aspects of IEM.
Keywords: Inborn errors of metabolism (IEM), childhood, neuroimaging, brain, magnetic resonance imaging (MRI)
Introduction
Disorders of inborn errors of metabolism (IEM), though individually rare, account for a large number of children presenting with a spectrum of neurological manifestations in clinical practice. IEMs are usually caused by complete or partial enzyme deficiencies, or defects in transporters, which lead to clinical manifestations from either accumulation of toxic products or lack of an essential end product. Clinical manifestations are heterogeneous and often non-specific, and can result from the involvement of multiple organ systems.
Even as increasing data from genomics, metabolomics and transcriptomics evolve, the clinico-radiologic phenotyping continues to hold a pivotal role in integration and accurate interpretation of the data. The role of neuroimaging is manifold, and includes raising the possibility of a metabolic disease process, narrowing down the differential diagnoses based on pattern recognition, and occasionally providing a specific diagnosis. Imaging also has a role in prognostication and follow-up. The implications are widespread, encompassing diagnosis and timely management of the metabolic derangement thereby minimising permanent neurological damage, facilitation of targeted testing and therapy, and initiation of genetic counselling. Role of imaging as a biomarker should also be emphasised as we enter the era of treatment and precision medicine for these disorders.
There are a number of ways to approach a suspected case of neurometabolic disorder. Pioneering work on pattern recognition and radiological approach has been performed by van der Knaap and Valk (1), and Barkovich (2) in this regard. In this article we provide a comprehensive initial approach to categorize, and summarize the most clinically and radiologically relevant aspects of this group of diseases. We also provide a focused review of antenatal and neonatal onset group of disorders, and mitochondrial cytopathies.
Definition and classification
Revolution in molecular diagnostics has led to a paradigm shift in our approach and definition of IEM. Any disorder with impairment of specific enzymes or biochemical pathways intrinsic to the pathomechanism can be labelled as an IEM, and the need for detection of an abnormal metabolite is no longer necessary (3).
Symptoms of neuro-metabolic disorders usually relate to decreased or abnormal formation of a protein that interferes with the normal function of the brain, either directly or indirectly. The deficiency or accumulation of these metabolites, or their specific role in signalling, energy metabolism or brain development contributes to disease phenotype.
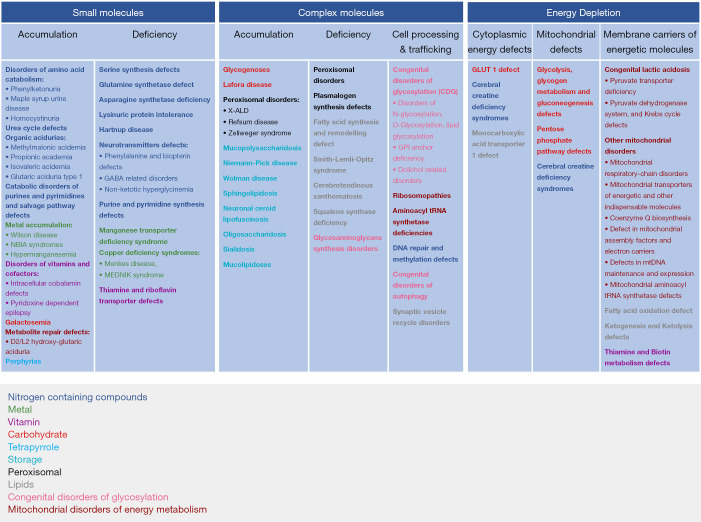
To translate the daunting complexity and increasing number of IEMs and increase the bedside clinical usability, a classification based on clinical, diagnostic and pathophysiological approach has been put forward by Saudubray et al. (4). It classifies IEM into the following groups.
Classification
Small molecule disorders
Disorders of small molecules in IEMs involve small, diffusible and water soluble molecules. Abnormal metabolites in this group of disorders can be easily measured in various body fluids. Most of these disorders are amenable to treatment and are divided into two major subcategories.
(I). Accumulation of small molecules
Accumulation of small molecules causes acute or progressive symptoms resulting from the accumulation of the metabolites proximal to the block. Manifestations occur after a varying symptom-free period and are often precipitated by intercurrent illness, food intake or fasting. This group of disorders generally do not hamper fetal development. Most disorders are treatable by reducing the toxic metabolites using special formulae, scavengers, and supplementation of cofactors. Classic IEMs such as amino-acidurias, organic acidurias and urea cycle defects belong to this category.
(II). Deficiency of small molecules
Deficiency of small molecules may occur due to defective synthesis of compounds distal to the metabolic block, or by defects in transport mechanisms. Disorders in this subgroup primarily affect neurodevelopment and may present with developmental malformations and birth defects. This group of disorders share many attributes in common with complex molecule disorders and also mimic chronic genetic non-metabolic encephalopathies. Defective transport of essential molecules through cellular membranes, inborn errors of non-essential amino acid and fatty acid synthesis, and neurotransmitter deficiency disorders are included in this group.
Complex molecule disorders
Disorders of complex molecules occur due to defective metabolism of water insoluble and non-diffusible large complex molecules. This group of disorders can be subcategorized into three groups as follows.
(I). Accumulation of complex molecules
Defective breakdown of complex molecules leads to storage of the material proximal to the block in lysosomes or in the cytoplasm leading to clinical manifestations. Clinically, these present as progressive disorders with late onset neurodegeneration with or without signs of storage disease. Antenatal manifestations are rare, though hydrops and malformations may be seen in severe forms. Lysosomal storage disorders are amongst the disorders in this group.
(II). Deficiency of complex molecules
These disorders occur due to defective synthesis of complex molecules. Neurodevelopmental abnormalities and neuroregression are usually seen and antenatal malformations are common. Most common disorders in this group include cholesterol and bile acid synthesis defects, glycogen depletion syndromes, fatty acid synthesis disorders and certain peroxisomal disorders.
(III). Cellular trafficking and processing disorders
This rapidly expanding group of disorders include defective post-translational modifications, defective trafficking, processing of complex molecules, and synaptic vesicle disorders. Congenital disorders of glycosylation (CDG) comprise the most common disorder in this subgroup.
Disorders of energy metabolism
Deficiency in energy production or utilization in various tissues leads to this important group of inherited metabolic disorders. Typically, recurrent episodes of metabolic crisis are triggered by catabolic states. Embryological development is rarely affected. This group is further divided into three subgroups.
(I). Membrane carriers of energetic molecules
This includes defective transport of various precursors of energy like glucose, lactate, pyruvate and ketone bodies (e.g., GLUT1 and MCT1 defects).
(II). Cytoplasmic energy defects
Defects in glycolysis, gluconeogenesis, glycogen metabolism, pentose phosphate pathway and disorders of creatine metabolism constitute this subgroup.
(III). Mitochondrial defects
Mitochondrial disorders are the most common form of inherited metabolic disorders and have a wide spectrum of clinical presentation. These typically involve multiple organ systems, predominantly those with high energy requirements such as the brain, visual and auditory function, skeletal muscles, liver and heart. Congenital lactic acidosis, respiratory chain defects, fatty acid oxidation disorders and defective mitochondrial maintenance and expression are common disorders in this group. Schematic representation of this classification with examples of the disorders are depicted in detail in Figure 1.
Figure 1.
Schematic representation of classification with examples of disorders.
Clinical phenotyping
Clinical symptoms depend on the particular metabolic pathway that is compromised. Although neurological symptoms comprise the predominant manifestation, these are rarely isolated and there are exceptions. Moreover, findings are usually across the spectrum in both severity and the systems involved. Age at presentation further limits the repertoire of clinical manifestation. Other factors which influence the clinical presentation include baseline nutritional status, magnitude of the precipitating factors including intercurrent illness, diet change, supportive therapy, and genetic modifiers. Clinical manifestations range from antenatal onset disorders with malformations, fulminant neonatal encephalopathy, to later onset and milder phenotypes. Clinical course may also vary with intermittent decompensations returning to normalcy, step ladder pattern of worsening, chronic progressive recruitment of symptoms, and also spontaneous improvement of various clinical manifestations. Differentiating primary neurological involvement versus neurological involvement as an endpoint of various other system involvements is the key factor in approach and management. Neurological and non-neurological clinical clues are listed in Tables 1 and 2.
Table 1. Neurological symptoms and clues in IEMs.
| Clinical manifestations | Disorders |
|---|---|
| Acute encephalopathy | Organic acidurias |
| Amino acidurias | |
| Urea cycle defects | |
| Fatty acid oxidation defects | |
| Primary lactic acidosis (pyruvate dehydrogenase deficiency, pyruvate carboxylase deficiency, mitochondrial respiratory chain defects) | |
| Non-ketotic hyperglycinemia | |
| Molybdenum cofactor deficiency | |
| Sulfite oxidase deficiency | |
| Progressive neurodegeneration | Lysosomal (Niemann-Pick disease, Gaucher disease, NCL, Krabbe disease, metachromatic leukodystrophy, GM1 and GM2 gangliosidosis) |
| Mitochondrial (MELAS, MERRF, mitochondrial DNA depletion syndromes) | |
| NBIA | |
| ALD | |
| MEGDEL | |
| Metal accumulation disorders | |
| Epilepsy | GLUT-1 deficiency |
| Pyridoxine dependent epilepsy | |
| Pyridoxal-5-phosphate responsive epilepsies | |
| Folinic acid responsive epilepsy | |
| Serine synthesis defects | |
| Non-ketotic hyperglycinemia | |
| Peroxisomal disorders | |
| Sulfite oxidase deficiency | |
| Molybdenum cofactor deficiency | |
| Respiratory chain disorders | |
| Menkes disease | |
| Mitochondrial disorders (POLG, MERRF) | |
| NCL | |
| Metal accumulation defects | |
| CDG syndromes | |
| Cerebral creatine deficiency syndromes | |
| Stroke | Homocystinuria |
| Fabry disease | |
| AGS | |
| Stroke like episodes | Urea cycle disorder |
| CDG | |
| MELAS | |
| Methylmalonic acidemia | |
| Propionic acidemia | |
| Isovaleric acidemia | |
| Hypotonia | Congenital lactic acidosis |
| Peroxisomal disorders | |
| Non-ketotic hyperglycinemia | |
| Urea cycle defects | |
| Sulfite oxidase deficiency | |
| Lowe syndrome | |
| Pompe disease | |
| Primary carnitine deficiency | |
| Fatty acid oxidation defects | |
| Primary coenzyme Q10 deficiency | |
| CDG syndromes with congenital myasthenic syndrome | |
| Spasticity | Sulfite oxidase deficiency |
| Hyperornithinemia, hyperammonemia, homocitrullinuria | |
| Arginase deficiency | |
| Homocysteine remethylation defects | |
| ALD | |
| Krabbe disease | |
| Canavan disease | |
| Metachromatic leukodystrophy | |
| Complex lipid defects | |
| Dystonia-Parkinsonism and other movement disorders | Neurotransmitter defects |
| Cerebral creatine deficiency syndromes | |
| Leigh disease | |
| Lesch-Nyhan syndrome | |
| Glutaric aciduria type 1 | |
| Biotin thiamine responsive basal ganglia disease | |
| Cerebral folate deficiency | |
| GLUT 1 deficiency | |
| Wilson disease | |
| Manganese transporter deficiency | |
| NBIA | |
| Late onset GM1 gangliosidosis | |
| Ataxia | Ataxia with vitamin E deficiency |
| Refsum disease | |
| CDG syndromes | |
| Niemann-Pick disease | |
| Complex lipid defects | |
| Cerebrotendinous xanthomatosis | |
| Mitochondrial disorders | |
| Hartnup disease | |
| Abetalipoproteinemia | |
| Primary coenzyme Q10 deficiency | |
| Intermittent forms of MSUD | |
| NCL | |
| GLUT-1 deficiency | |
| Lafora disease | |
| Neuropathy | Peroxisomal disorders |
| Homocysteine remethylation defects | |
| Complex lipid defects | |
| LCHAD | |
| Krabbe disease | |
| MLD | |
| Cockayne syndrome | |
| CDG | |
| Mitochondrial disorders | |
| Riboflavin transporter disorders | |
| Porphyria | |
| Sorbitol dehydrogenase deficiency | |
| Myopathy | Muscle glycogenoses |
| Disorders of long chain fatty acid and carnitine metabolism | |
| Lipin-1 deficiency | |
| Mitochondrial disorders | |
| Myoadenylate deaminase deficiency | |
| CDG | |
| Microcephaly | NCL |
| Alpers syndrome (POLG1 mutation) | |
| Sulfite oxidase deficiency | |
| Molybdenum cofactor deficiency | |
| Chondrodysplasia punctata | |
| Multiple sulfatase deficiency | |
| Dihydropyrimidine dehydrogenase deficiency | |
| Trichothiodystrophy | |
| Amino acid synthesis disorders: serine, asparagine, and glutamine synthetase deficiencies | |
| Methylene tetrahydrofolate reductase deficiency | |
| GLUT 1 deficiency | |
| Menkes disease | |
| Macrocephaly | Alexander disease |
| Canavan disease | |
| Glutaric aciduria type 1 | |
| L2-hydroxyglutaric aciduria | |
| Megalencephalic leukoencephalopathy with subcortical cysts | |
| Eye manifestations | External ophthalmoplegia (mitochondrial disorders, biotin thiamine responsive basal ganglia disease) |
| Gaze palsy (Niemann-Pick disease, Gaucher disease) | |
| Behavioral/psychiatric manifestations | Urea cycle disorder |
| Homocystinuria | |
| Hartnup disease | |
| SSADH deficiency | |
| Smith-Lemli-Opitz syndrome | |
| Cerebral creatine deficiency syndromes | |
| Porphyrias | |
| Lesch-Nyhan syndrome | |
| Adenylosuccinate lyase deficiency | |
| Phenylketonuria | |
| Sanfilippo syndrome | |
| Wilson disease | |
| Niemann-Pick type C disease | |
| Juvenile/adult onset metachromatic leukodystrophy | |
| Cobalamin C disease | |
| Late onset GM2 gangliosidosis |
AGS, Aicardi Goutieres syndrome; ALD, adrenoleukodystrophy; CDG, congenital disorders of glycosylation; LCHAD, long-chain 3-hydroxyacyl-CoA dehydrogenase deficiency; MEGDEL, 3-methylglutaconic aciduria, deafness, encephalopathy, and Leigh-like disease; MELAS, mitochondrial encephalopathy lactic acidosis and stroke like episodes; MLD, metachromatic leukodystrophy; NBIA, neurodegeneration with brain iron accumulation; NCL, neuronal ceroid lipofuscinosis; POLG, DNA polymerase subunit gamma deficiency; SSADH, succinic semialdehyde dehydrogenase deficiency.
Table 2. Non-neurological clues in IEMs.
| Predominant system involvement | Associated disorders |
|---|---|
| Abnormal odours | Glutaric acidemia (type II): sweaty feet, acrid |
| Hawkinsinuria: swimming pool | |
| 3-Hydroxy-3-methylglutaric aciduria: cat urine | |
| Isovaleric acidemia: sweaty feet, acrid | |
| Maple syrup urine disease: maple syrup | |
| Hypermethioninemia: boiled cabbage | |
| Multiple carboxylase deficiency: tomcat urine | |
| Phenylketonuria: mousy or musty | |
| Tyrosinemia: boiled cabbage, rancid butter | |
| Metabolic acidosis | With ketosis: organic acidurias, MSUD, MCD, pyruvate carboxylase deficiency, respiratory chain defects, ketolysis defects, MCT, gluconeogenesis defects |
| Without ketosis: pyruvate dehydrogenase deficiency, Ketogenesis defects, Fatty acid oxidation disorder, fructose 1-6 diphosphatase | |
| With hyperammonemia: urea cycle defects, HHH syndrome, LPI | |
| With hypoglycemia: gluconeogenesis defects, MSUD, HMG-CoA lyase, FAO | |
| Respiratory alkalosis | With hypoglycemia: FAO (MCAD), HMG-CoA lyase |
| Dysmorphic features | Smith-Lemli-Opitz syndrome, peroxisomal disorders, mucopolysaccharidosis, oligosaccharidosis, sialidosis, CDG |
| Skin/connective tissue | Ichthyosis: peroxisomal disorders, complex lipid defects (MEDNIK, CEDNIK, Sjogren-Larsson syndrome), CDG |
| Hair signs: Menkes, LPI, argininosuccinic aciduria, argininemia, biotin responsive multiple carboxylase deficiency (MCD) | |
| Bone dysplasia: peroxisomal disorders, MPS, mucolipidosis, cholesterol synthesis defects, complex lipid defects, O-CDG | |
| Eye | Retinopathy: mitochondrial, peroxisomal, CDG, LSD (GM1, NCL), complex lipid defects, Vit E, LCHAD |
| Cataracts: galactosemia, LPI, peroxisomal, complex lipid defects (Lowe, ELOV4, Chanarin-Dorfman, Sjogren-Larsson, CTX, Sengers) | |
| Ectopia lentis: homocystinuria, sulfite oxidase deficiency | |
| Optic atrophy: energy disorders (mitochondrial disorders, OA, PDH, MCD), LSD, NCL, Canavan, Pelizaeus Merzbacher, CDG, complex lipid defects, ATP1A3 (CAPOS) | |
| Visceral: liver, spleen, lungs | Lysosomal storage disorders: Gaucher, Niemann-Pick, MPS, GM1 gangliosidosis |
| CDG syndromes | |
| Peroxisomal disorders | |
| Complex lipid defects: Chanarin-Dorfman, Mevalonate kinase | |
| Muscle/heart | Mitochondrial |
| CDG | |
| Organic acidurias | |
| Fatty acid oxidation: LCHAD, trifunctional protein | |
| Complex lipid defects: Lipin1, Sengers, choline kinase | |
| Coagulopathies | Homocystinurias |
CDG, congenital disorder of glycosylation; CTX, cerebrotendinous xanthomatosis; CAPOS, cerebellar ataxia, areflexia, pes cavus, optic atrophy and sensorineural hearing loss; CEDNIK, Cerebral dysgenesis, neuropathy, ichthyosis and keratoderma; NCL, neuronal ceroid lipofuscinosis; FAO, fatty acid oxidation; HHH, hyperornithinemia, hyperammonaemia, homocitrullinuria; HMG-CoA, 3-hydroxy-3-methylglutaryl coenzyme A; LCHAD, long-chain 3-hydroxyacyl-CoA dehydrogenase; LPI, lysinuric protein intolerance; LSD, lysosomal storage disorders; MCD, multiple carboxylase deficiency; MCT, monocarboxylic acid transporter; MCAD, medium-chain acyl-CoA dehydrogenase; MEDNIK, Mental retardation, Enteropathy, Deafness, peripheral Neuropathy, Ichthyosis, Keratodermia; MSUD, maple syrup urine disease; MPS, mucopolysaccharidoses; OA, organic acidurias; PDH, pyruvate dehydrogenase.
Biochemical testing
Most IEMs have measurable abnormal metabolites in body fluids that can be detected through specialized biochemical laboratories. Collection of critical samples and transportation to the laboratory under appropriate conditions is important for meaningful interpretation of results. The magnitude of abnormalities may vary depending on time of sampling, nutritional status, dietary supplements, treatment received and the genotype. Initial work-up performed emergently for children with suspected IEM include blood counts, electrolytes, glucose, acid base status, ketones, liver and renal function tests, lactate, ammonia, uric acid, urine ketones and reducing substances (5). Empiric treatment based on these labs should be instituted urgently to ameliorate neurologic sequelae and prevent death. Further focused testing which help guide ongoing clinical management are plasma aminoacidogram, urine organic acid analysis, carnitine and acyl carnitine profile, transferrin isoelectric focusing, lysosomal enzymes, very long chain fatty acids, pyruvate, urine mucopolysaccharides and oligosaccharides, porphyria metabolites, guanidinoacetate, cerebrospinal fluid (CSF) glucose and neurotransmitters, and urine cholesterol metabolites. High anion gap acidosis and mildly elevated ammonia suggest organic acidemias which can be further confirmed by urine organic acid analysis. Hypoglycemia without ketosis points to a fatty acid oxidation defect which can be further categorized based on plasma carnitine and acyl carnitine profile. Persistently elevated lactate with normal perfusion points to a mitochondrial disorder. Highly elevated ammonia suggests urea cycle disorder which may be further delineated by aminoacidogram. Further advanced testing includes functional assays from fibroblast cultures, estimation of mitochondrial complexes, expanded metabolomics, lipidomics, glycomics and proteomics. Molecular diagnosis is eventually needed in most cases to confirm the diagnostic suspicion, to predict prognosis and treatment response, estimate risk of recurrence, and for pre-implantation diagnosis for future pregnancies in the family. Several disorders demonstrate abnormal metabolites which are identified only during acute crises and there are several disorders with low excretors irrespective of clinical status. In these scenarios, molecular testing helps in establishing the diagnosis.
Radiological phenotyping
The concept of selective vulnerability and utilization of pattern recognition
Selective vulnerability refers to the susceptibility of certain anatomic structures to particular toxic stimuli. The pattern of involvement in the brain therefore offers clues to the possible underlying metabolic derangement; some of which are pathognomonic, some suggestive, and others non-specific. The pattern of involvement depends on the stage of brain development and myelin maturation, receptor and neurotransmitter distribution, cell and region specific variability in molecular composition, energy requirements and affinity to certain toxins (1).
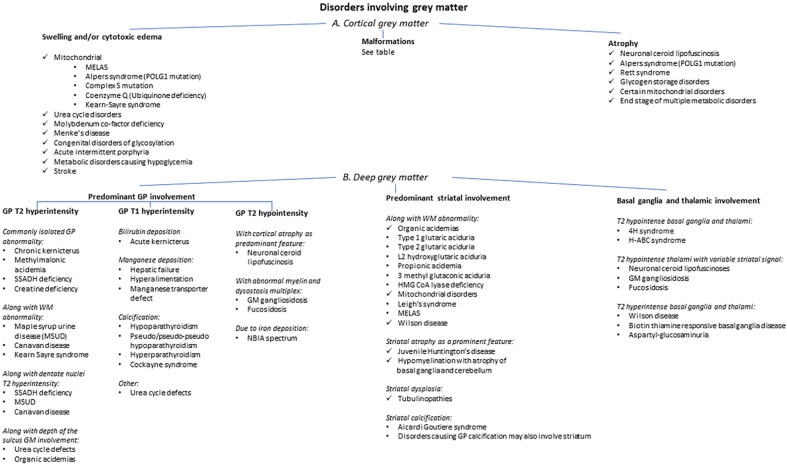
Cortical grey matter involvement
Two patterns of cortical involvement are recognised:
(I). Swelling and cytotoxic edema
These are usually hallmarks of different mitochondrial cytopathies, especially with pathogenic variants in mitochondrial DNA (mt DNA), the prototype being MELAS disease. In the acute stage, there is cortical swelling and restricted diffusion occurring in a nonvascular distribution with predilection to the primary visual, somatosensory, and auditory cortices. Temporal evolution involves cortical laminar necrosis, subsequent volume loss or, less commonly, complete resolution. Although classically described as asymmetric, symmetric involvement is increasingly recognised (6). Other mitochondrial diseases that show cortical restricted diffusion include polymerase gamma (POLG1) related disorders (with unilateral or bilateral parieto-occipital or perirolandic and thalamic involvement), ubiquinone deficiency (commonly with cerebellar involvement), complex V deficiency, and Kearns Sayre syndrome. Lactate can be commonly identified on magnetic resonance spectroscopy (MRS) from both involved and “normal appearing” parenchyma. Typical clinical presentation is with stroke like symptoms (“metabolic stroke”) Figure 2.
Figure 2.
Axial DWI (A,B) shows left occipitotemporal and frontal cortical restricted diffusion (arrows) in a child with MELAS. Axial T2 weighted image (C) shows preservation of cortical ribbon signal. DWI images (D,E) in another child with POLG mutation shows typical distribution of parieto-occipital and thalamic restriction as well as perirolandic changes (arrows). DWI, diffusion weighted imaging; POLG, polymerase gamma.
Imaging differentials include ischemic lesions (ischemic stroke), encephalitis (infection associated and autoimmune) and post-ictal change. Less commonly, other metabolic disorders such as CDG, Menkes disease, and acute intermittent porphyria present with cortical swelling and restricted diffusion. Vascular stroke is associated with classic homocystinuria and can present with arterial ischemic or venous infarction (lenticular dislocation if identified on imaging can be an important clue here).
(II). Atrophy
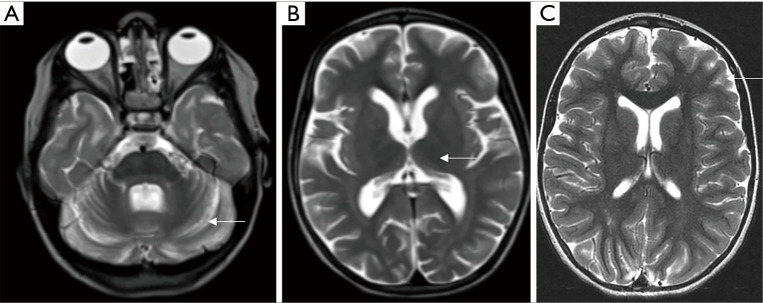
Atrophy is a nonspecific feature seen in many IEMs, and is commonly seen in storage disorders and mitochondrial cytopathies (7). Exemplary is neuronal ceroid lipofuscinosis (NCL) (Figure 3) which typically shows variable degrees of cerebral and cerebellar atrophy, T2 hypointense thalami, and T2/FLAIR white matter hyperintensity which typically begins in the periventricular region but can involve deep and subcortical white matter as well as the brainstem with progression of disease (8,9).
Figure 3.
Atrophy in IEM. Axial T2 weighted images (A,B) in a 5-year-old child with neuronal ceroid lipofuscinosis shows remarkable cerebellar (arrow, A) and diffuse cerebral volume loss. Note thalamic T2 hypointensity (arrow, B). Axial T2 image (C) in another 7-year-old child with mitochondrial cytopathy shows diffuse cerebral volume loss (arrow). IEM, inborn errors of metabolism.
Alpers disease is a mitochondrial disorder and is part of the POLG1-related spectrum. There is generalized atrophy which may be posterior predominant. Other clues to diagnosis include hepatic dysfunction [with or without hepatic encephalopathy which may be evident on magnetic resonance imaging (MRI)], as well as deep grey matter involvement (10,11).
The glycogen storage diseases typically show T2 hypointense thalami, abnormal myelin, cortical atrophy, coarse facies and dysostosis multiplex (2).
Deep grey matter involvement
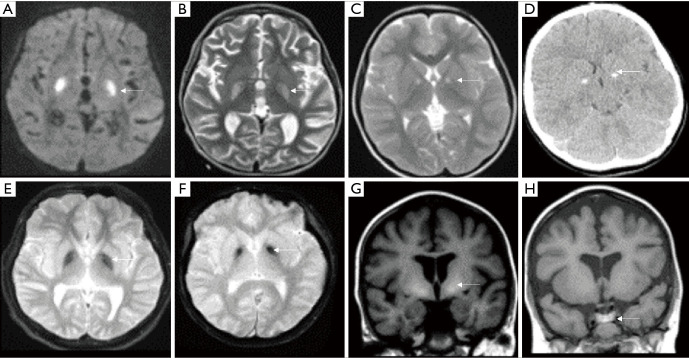
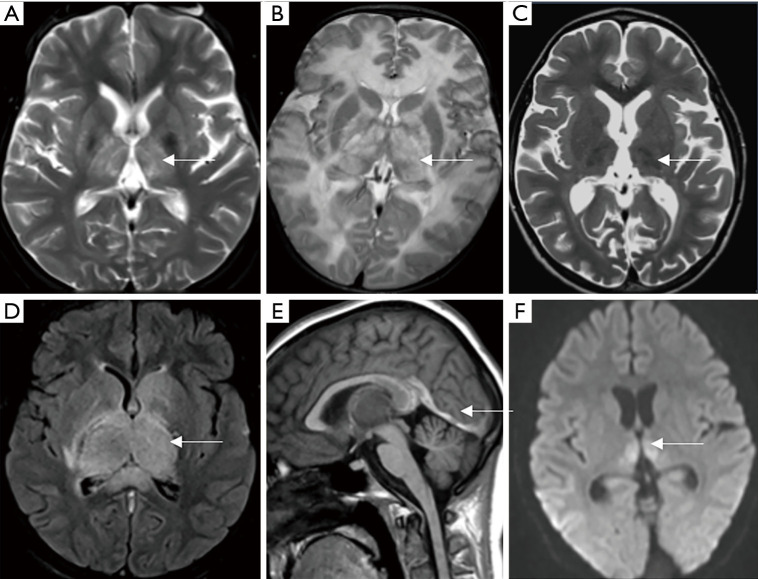
The major deep grey nuclei consist of the basal ganglia [globi pallidi (GP), putamen, caudate nuclei] and the thalami. The putamen and caudate nuclei are collectively termed as the “corpus striatum” or “striate nuclei”. Metabolic disease affecting these structures may show selective involvement of one or more of these structures (Figures 4-6).
Figure 4.
Pallidal changes in IEM. Axial DWI (A) in methylmalonic acidemia shows bilateral GP diffusion restriction (arrow) with corresponding hyperintensity on T2 weighted images (arrow, B). Axial T2 weighted image (C) shows symmetric hyperintensity involving anterior aspects of GP (arrow), with calcification on CT (arrow, D) in a case of MELAS. SWI shows GP hypointensity with laminar sparing in a case of MPAN (arrow, E) and anteromedial GP in PKAN (arrow, F). Coronal T1 weighted images showing GP (arrow, G) and anterior pituitary gland hyperintensity (arrow, H) in a case of manganese transporter deficiency. IEM, inborn errors of metabolism; DWI, diffusion weighted imaging; GP, globi pallidi; PKAN, pantothenate kinase-associated neurodegeneration; MPAN, mitochondrial membrane protein-associated neurodegeneration.
Figure 5.
Striatal changes in IEM. Axial DWI image (A) shows bilateral putaminal diffusion restriction (arrow) in organic acidemia. Axial T2 weighted image (B) shows bilateral striatal, thalamic and midbrain changes in mitochondrial disease (arrows). Axial T2 weighted image (C) shows bilateral T2 hyperintensity of striatum, medial thalamus and subcortical white matter (arrows) in biotin thiamine responsive basal ganglia disease. Axial T2 weighted image (D) shows widened opercula and symmetric striatal hyperintensity in type 1 glutaric aciduria (arrows). Axial T2 weighted image (E) shows diffuse white matter hyperintensity along with symmetric striatal swelling and hyperintensity in GM1 gangliosidosis (arrows). Small and heterogeneously dark thalami is also evident. IEM, inborn errors of metabolism; DWI, diffusion weighted imaging.
Figure 6.
Thalamic involvement in IEM and mimics. Axial T2 weighted image (A) shows bilateral symmetric thalamic (arrow) and putaminal involvement in a case of mitochondrial disease. Axial T2 weighted image (B) shows extensive white matter hyperintensity along with globi pallidal and thalamic hyperintensities (arrow) in a case of Canavan disease—note characteristic sparing of striate nuclei. Axial T2 weighted image (C) shows dark thalami (arrow) of neuronal ceroid lipofuscinosis- notice also significant cerebral volume loss for age. Axial FLAIR (D) and sagittal T1 weighted image (E) depicts straight sinus thrombosis with bilateral thalamic swelling and hyperintensity (arrow). Axial DWI (F) shows bilateral symmetric medial thalamic diffusion restriction (arrow) in a case of artery of Percheron stroke. IEM, inborn errors of metabolism; DWI, diffusion weighted imaging.
(I). GP
Bilateral GP T2/FLAIR hyperintensity are typically caused by toxic and metabolic etiologies. If the abnormality is confined to the GP, late onset methylmalonic acidemia (MMA), cerebral creatine deficiency syndromes and certain subtypes of pyruvate dehydrogenase deficiency (PDH) need consideration (once toxic causes such as carbon monoxide poisoning and kernicterus are excluded). Late onset MMA may show other nonspecific findings such as white matter T2/FLAIR hyperintensity and cortical atrophy, whilst cerebral creatine deficiency syndromes typically show reduced or absent creatine peak on MR spectroscopy (7). T2/FLAIR hyperintensity involving the GP as well as cerebellar dentate nuclei may be seen in succinate semialdehyde dehydrogenase (SSADH) deficiency, Canavan disease, propionic acidemia, maple syrup urine disease (MSUD), and mitochondrial cytopathies (2).
Bilateral GP T1 hyperintensity is uncommon, and therefore when seen should prompt a relatively narrow differential diagnosis. Molecules that are hyperintense on T1 include haemorrhage, calcification, bilirubin and manganese. Therefore, once HIE, kernicterus, carbon monoxide poisoning are excluded, one must consider disorders of manganese metabolism (hepatic failure, hyperalimentation and manganese transporter defect) (12-14). Indeed, any metabolic disorder which causes micro-haemorrhage and/or hypoxic injury with astrogliosis may also result in this picture.
Bilateral GP T2 hypointensity may occur due to iron, calcium or hemosiderin deposition. It is important to perform susceptibility weighted imaging (SWI) or gradient recalled echo (GRE) imaging that enables depiction of paramagnetic properties of these substances, manifesting as “signal drop-out”. When isolated to the GP, or with GP and dentate involvement, the spectrum of neurodegeneration with brain iron accumulation (NBIA) needs consideration (7). When there is both GP and thalamic T2 hypointensity, storage disorders such as neuronal ceroid lipofuscinosis, GM gangliosidosis, aspartylglucosaminuria and fucosidosis need consideration.
(II). Striate nuclei
Bilateral striatal T2 hyperintensity has a vast number of causes. Again, symmetric involvement generally suggests a toxic or metabolic process, although exceptions exist. Etiologies include organic acidemias such as propionic acidemia, types 1 and 2 glutaric aciduria and L2-hydroxyglutaric aciduria, mitochondrial disorders such as those causing Leigh’s syndrome, Wilson’s disease and biotin thiamine responsive basal ganglia disease (2).
Less commonly infectious, para-infectious or autoimmune inflammatory processes and diffuse infiltrating glial neoplasms can be symmetric and pose diagnostic challenges.
(III). Thalami
Neurometabolic causes with isolated thalamic involvement is uncommon. Thalamic T2 hypointensity is seen in storage disorders such as GM gangliosidosis, neuronal ceroid lipofuscinosis, Krabbe disease, fucosidoses and aspartylglucosaminuria (2,7,15). Corresponding hyperdensity on CT is typically seen in Krabbe disease and GM gangliosidosis. T2 hyperintense thalami is seen in Wilson disease, many mitochondrial cytopathies, Canavan disease and MSUD.
Many non-metabolic diseases can present with isolated or predominant thalamic involvement, and need to be considered in the appropriate setting. Acute necrotizing encephalopathy of childhood (ANEC) with or without underlying RANBP2 mutation occur following triggers such as influenza, adenovirus and rotavirus infection. Thalamic involvement is typical in ANEC, with trilaminar pattern on ADC and multiple microhemorrhages on MPGR or SWI (16). Diffuse glial neoplasms, Japanese encephalitis, deep venous thrombosis and Wernicke disease also show predominant thalamic changes.
In addition to the above, the deep grey nuclei may show secondary involvement in response to cortical or white matter injury, with atrophy being a common endpoint of many neurometabolic disease processes.
An algorithmic approach to grey matter involvement in IEM is presented in Figure 7.
Figure 7.
Algorithmic approach to grey matter involvement in IEMs. IEM, inborn errors of metabolism.
White matter involvement
According to the latest definition by van der Knaap et al. (17), leukodystrophy includes “all genetically determined disorders with selective and primary involvement of CNS white matter, irrespective of the structural white matter component involved and molecular process affected”.
A large number of IEMs present as leukodystrophies. Pattern and distribution of white matter abnormalities and associated findings help in specific diagnosis or narrowing the differential in a many of these disorders. But an equal or even larger number of disorders show nonspecific patterns. Heterogeneous appearance of the same disease, overlapping features of different disorders and evolution of findings add to challenges in interpretation.
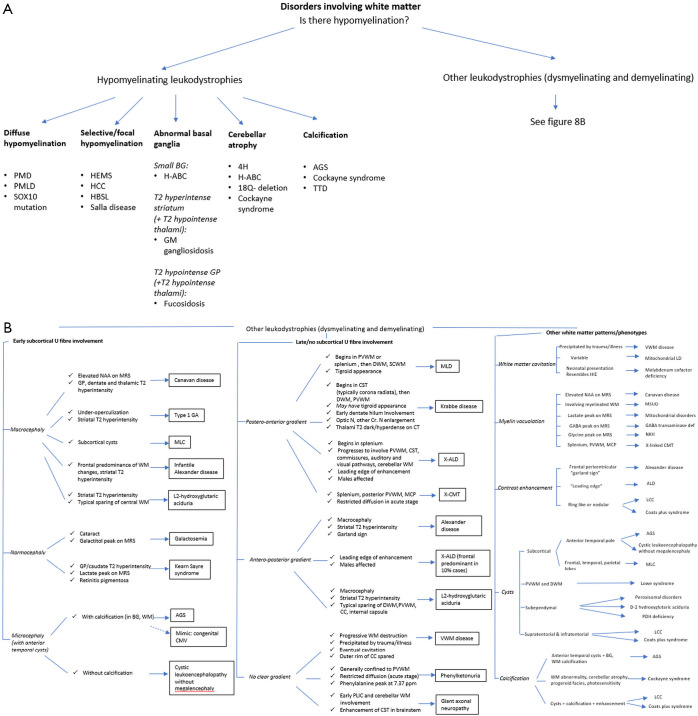
A systematic pattern-based approach with disorders categorized under each pattern is given in Figure 8.
Figure 8.
Algorithmic approach to white matter involvement in IEMs. (A) Depicting hypomyelinating disorders and (B) depicting other leukodystrophies. IEM, inborn errors of metabolism.
The first step is to identify features of hypomyelination as these form the largest subgroup of leukodystrophies. A diffuse reduction in expected myelin for age with T2 hyperintensity and variable T1 hypointensity may be seen (18). If the first MRI is performed in infancy, a repeat MRI following a minimum period of 6 months is required to confirm hypomyelination (as opposed to delayed myelin maturation). Hypomyelinating leukodystrophies (HLDs) show no significant interval progression of myelination. Further imaging-based differentiation is possible in many HLDs.
Other leukodystrophies show more striking T2 hyperintensity and T1 hypointensity of involved white matter when compared to HLDs. Disorders which involve the periventricular and deep white matter early with relative sparing of the subcortical U-fibers are plentiful. A useful approach is to then look for thalamic involvement. Presence of thalamic T2 hypointensity suggests Krabbe disease or GM gangliosidosis. Krabbe disease generally has additional features such as corticospinal tract involvement, dentate nucleus T2 hyperintensity, thickening of the optic and/or spinal nerves (19,20), whilst GM gangliosidosis additional features include striatal signal changes, dysmorphic facies, dysostosis multiplex and cerebellar atrophy (21,22). Lack of thalamic involvement and a tigroid appearance of involved white matter should raise the possibility of metachromatic leukodystrophy. This appearance is due to relative sparing of some myelin and lipid containing glial cells (23). This is, however, not specific to metachromatic leukodystrophy and can also be seen in Krabbe disease and GM gangliosidosis.
X-linked adrenoleukodystrophy usually has a posterior-anterior gradient, with the middle of the callosal splenium and/or hippocampal commissure being the first region to be involved. This then extends to involve the deep white matter of the parietal and occipital regions, with subsequent involvement of the internal and external capsules, Meyer’s loop, geniculate bodies and brainstem. A zonal pattern of involvement is characteristic on MRI, with a central burnt-out zone, an inflammatory zone and a zone of active demyelination (24).
If the subcortical white matter is affected early, it is especially important to note the head circumference. Early subcortical U-fiber involvement with macrocephaly are seen in infantile Alexander disease, Canavan disease, L2-hydroxyglutaric aciduria and megalencephalic leukoencephalopathy with subcortical cysts. Infantile Alexander disease has a typical anteroposterior gradient, involves striate nuclei (head of caudate nuclei in particular), diencephalic structures and brainstem, and may show a characteristic periventricular T2 hypointensity (25). Canavan disease has additional involvement of the GP, thalami, dentate nuclei and brainstem, typically spares the striate nuclei and corpus callosum; and shows characteristic elevated N-acetylaspartate (NAA) peak on MRS (7,26). Megalencephalic leukoencephalopathy with subcortical cysts shows diffuse white matter involvement with subcortical cysts (27). L2-hydroxyglutaric aciduria has characteristic imaging findings which include early subcortical U-fiber involvement, antero-posterior gradient, involvement of the striate and dentate nuclei; and typical sparing of thalami, deep and periventricular white matter, corpus callosum and internal capsules (28). A peculiar feature of L2-hydroxyglutaric aciduria is its carcinogenic nature (29).
Early subcortical U-fiber involvement with normal head size is seen in galactosemia and Kearns Sayre syndrome. Galactosemia can be diagnosed by eliciting galactitol peak on MRS (30). Kearns Sayre syndrome is a mitochondrial disorder with frequent globi pallidal and/or caudate involvement, along with retinitis pigmentosa (31).
Finally, early subcortical U fiber involvement with progressive microcephaly is a feature of Aicardi-Goutieres syndrome and cystic leukoencephalopathy without megalencephaly—these are further described below.
Subtle diffuse white matter changes can be seen secondary to neuroaxonal loss. Whilst this can potentially mimic hypomyelination on imaging, early appearance of significant diffuse parenchymal atrophy is a clue to differentiation.
Intra-myelinic edema is another pattern of white matter involvement seen in many IEMs, with MSUD being the prototypical example. In MSUD, there is symmetric restricted diffusion involving the myelinated white matter (32,33); imaging of MSUD is further discussed in the focused neonatal section. Intramyelinic edema is also the likely mechanism underlying altered white matter diffusivity in non-ketotic hyperglycinemia (NKH), chloride channel 2 (ClC2) related disease, megalencephalic leukoencephalopathy with subcortical cysts (MLC), and leukoencephalopathy with thalamus and brainstem abnormalities and lactate elevation (LTBL) (34).
Some examples of patterns are illustrated in Figure 9.
Figure 9.
White matter patterns in IEM. Axial T2 weighted image (A) in Alexander disease shows anterior predominant white matter involvement (arrow). Axial T2 weighted image (B) in metachromatic leukodystrophy shows symmetric confluent deep white matter hyperintensity with tigroid pattern (arrow). Axial T2 weighted image (C) and sagittal T1 weighted image (D) in Krabbe disease shows hyperintensities along corticospinal tracts and thickened prechiasmatic optic nerve (arrows). Axial T2 weighted image (E) shows typical posterior predominant changes (arrow) with splenial involvement in X-linked adrenoleukodystrophy. IEM, inborn errors of metabolism.
Cysts
Subcortical cysts are seen in megalencephalic leukoencephalopathy, Aicardi Goutiere syndrome (AGS) and cystic leukoencephalopathy without megalencephaly. The former shows temporal, frontal or parietal distribution of cysts. The latter two have microcephaly and predominantly anterior temporal pole cysts. Periventricular and deep white matter cysts are seen in oculocerebrorenal (Lowe) syndrome (35). Corpus callosal “cysts” (presumably perivascular spaces) are seen in the mucopolysaccharidoses. Subependymal (germinolytic) cysts are a feature of peroxisomal disorders (particularly Zellweger syndrome), D-2 hydroxyglutaric aciduria, pyruvate dehydrogenase E1-alpha deficiency, and complex mitochondrial dysfunction with pontocerebellar hypoplasia and glutaric aciduria type 1 (2). In addition, there can be cystic cavitation of lesions in MMA and Leigh’s syndrome. Cystic rarefaction of involved white matter is characteristically seen in vanishing white matter disease. Temporal cysts have also been described in galactosemia. Examples are depicted in Figure 10.
Figure 10.
Cysts and calcifications in IEM. Axial T2 weighted image (A) in leukoencephalopathy with calcifications and cysts (LCC) shows asymmetric white matter hyperintensity, left thalamic cysts (arrow) and right thalamic calcification. Axial T2 weighted image (B) in Zellweger syndrome shows subependymal cysts and polymicrogyria (arrows). Axial T2 weighted image (C) shows temporal polar white matter cysts (arrow) in galactosemia. Axial T2 weighted (D) and coronal FLAIR images (E) in vanishing white matter disease shows confluent white matter hyperintensity with cystic changes (arrows). Axial CT (F) in Aicardi Goutieres syndrome shows bilateral basal ganglia calcifications (arrow). IEM, inborn errors of metabolism.
Calcification
Basal ganglia calcification has been reported in mitochondrial disorders such as Kearns Sayre syndrome (36) and myoclonic epilepsy with ragged red fibers (37), GM1 gangliosidosis (38), and biotinidase deficiency (39). Calcifications confined to the GP have been reported in MMA (40) and pantothenate kinase–associated neuropathy (41). Cerebellar white matter calcification is seen in cerebrotendinous xanthomatosis (2). Dystrophic calcifications may also be seen in the parieto-occipital regions at the chronic or “burnt out” stage of X-ALD (1). Hyperdensity on CT along the corticospinal tracts and other involved white matter of Krabbe may be partially attributed to calcification.
Other conditions associated with calcification include AGS (42) with predominant basal ganglia and white matter distribution (Figure 10F), Cockayne syndrome (43) which shows globus pallidus, dentate, striatal and parenchymal distribution, Fahr’s disease and disorders of parathormone metabolism (44).
Malformations
Certain subgroups of IEMs affect different stages of neurodevelopment including neuronal proliferation, migration, myelination, and synapse formation. Common malformations associated with IEMs are listed in Table 3.
Table 3. Common malformations associated with IEMs (2,5).
| Malformation | Disorders |
|---|---|
| Corpus callosal abnormality (agenesis/dysgenesis) | Pyruvate dehydrogenase deficiency |
| Congenital disorders of glycosylation | |
| Non-ketotic hyperglycinemia | |
| Smith-Lemli-Opitz syndrome | |
| Fumarase deficiency | |
| Glutaric aciduria type 2 | |
| 3-hydroxyisobutyric aciduria | |
| Infantile Refsum disease | |
| Menke’s disease | |
| Zellweger syndrome | |
| Maternal phenylketonuria | |
| SNAP29 (CEDNIK syndrome) | |
| Microcephaly | Serine defects |
| Mitochondrial disorders | |
| NSDHL (X-linked) hemizygous males | |
| Dolichol synthesis defects | |
| Aerobic glucose oxidation defects | |
| Lissencephaly | Serine defects |
| Mitochondrial TPP depletion | |
| 3-hydroxyisobutyric aciduria | |
| Polymicrogyria | Peroxisomal disorders |
| Fumarase deficiency | |
| Smith-Lemli-Opitz syndrome | |
| SNAP29 (CEDNIK syndrome) | |
| Pachygyria | 3-hydroxyisobutyric aciduria |
| Pyruvate dehydrogenase deficiency | |
| Glutaric aciduria type 2 | |
| Smith-Lemli-Opitz syndrome | |
| SNAP29 (CEDNIK syndrome) | |
| Cerebellar abnormalities (hypoplasia/dysplasia/abnormal sulcation) | Congenital disorders of glycosylation |
| Non-ketotic hyperglycinemia | |
| Smith-Lemli-Opitz syndrome | |
| 3-hydroxyisobutyric aciduria | |
| Infantile Refsum disease | |
| Menke’s disease | |
| Zellweger syndrome | |
| DHA transporter defect | |
| Dolichol synthesis defects | |
| Fumarase deficiency | |
| Glutaric aciduria type 2 | |
| Bifunctional enzyme deficiency | |
| Lobar hypoplasias | Frontal |
| Smith-Lemli-Opitz syndrome | |
| Fronto-temporal | |
| Glutaric aciduria type 1 | |
| Simplified gyration | Glutaric aciduria type 1 |
| Asparagine synthetase deficiency | |
| Heterotopias | Peroxisomal disorders |
| Pyruvate dehydrogenase deficiency | |
| Fumarase deficiency | |
| Aerobic glucose oxidation defects | |
| Menkes disease |
Posterior fossa involvement
Although there are robust pattern recognition features involving supratentorial structures, on occasion, specific patterns of posterior fossa involvement help clinch the diagnosis. Furthermore, certain disorders have prominent posterior fossa manifestations in early stages which also aids in diagnosis.
Presence of dentate nucleus involvement along with subcortical white matter involvement allows a confident diagnosis of L-2-OH glutaric aciduria. Dorsal columns and lateral corticospinal tracts of the spinal cord, pyramids and/or decussation of the medial lemniscus in the medulla oblongata and intraparenchymal trigeminal involvement are diagnostic of DARS2 related LBSL. Alexander disease can occasionally present with multifocal enhancing brainstem lesions without classic supratentorial involvement (45), often mimicking neoplastic lesions.
Isolated cerebellar atrophy with or without parenchymal T2/FLAIR hyperintensity is seen in a wide spectrum of metabolic and neurogenetic disorders including mitochondrial disorders, storage disorders, Marinesco-Sjögren syndrome, PLA2G6-associated neurodegeneration (PLAN), and CDG.
Lower cranial nerve and cauda equina enhancement can be seen in MLD and Krabbe disease. The latter also demonstrates cerebellar white matter involvement and corticospinal tract involvement early in the course of the disease.
The role of diffusion weighted imaging (DWI)
DWI is key to identifying regions of cytotoxic edema and myelin splitting (intramyelinic) edema, and in differentiating these from regions of vasogenic edema. Many metabolic disorders demonstrate restricted diffusion in the acute stage, or at times of acute decompensation. These may imply “metabolic stroke” due to energy failure at the cellular level or a process that leads to intramyelinic edema. Patterns of restricted diffusion are extremely useful in approaching a suspected neurometabolic syndrome. Neonatal onset MSUD, neonatal onset MMA and NKH typically show restricted diffusion involving the myelinated white matter (15). Urea cycle disorders may show “ribbon like” restricted diffusion at the depth of the sulci (46). Many mitochondrial disorders present acutely with restricted diffusion variably in the deep grey nuclei, brainstem, cerebellar dentate nuclei, and cortices. DWI also helps in assessment of disease activity, while diffusion tensor imaging plays a role in identification and quantitative analysis of myelin damage, even in the subclinical phase. Some examples are depicted in Figure 11.
Figure 11.
Diffusion changes in IEM. Axial DWI (A) in POLG1 pathogenic mutation related mitochondrial cytopathy shows symmetric perirolandic diffusion restriction (arrow). Axial T2 weighted image (B) in maple syrup urine disease shows brain stem swelling and hyperintensity (arrow) along with cerebellar white matter and optic chiasm involvement. Corresponding DWI shows extensive diffusion restriction (arrow). Note “4 dots” in the brainstem. Axial DWI (C,D) and ADC (E) in non-ketotic hyperglycinemia showing confluent white matter diffusion restriction including posterior limb of internal capsule (arrows). IEM, inborn errors of metabolism; DWI, diffusion weighted imaging; POLG, polymerase gamma; ADC, apparent diffusion coefficient.
Contrast enhancement
Presence of enhancement is characteristic of certain conditions such as X-ALD (enhancement along Schaumburg zone 2-region of active inflammatory demyelination). Garland-like frontal periventricular enhancement is a hallmark of Alexander disease. Alexander disease can also present with nodular brainstem enhancement mimicking demyelinating disorders and low grade gliomas (45). Nonspecific enhancement may occur in Krabbe disease and certain mitochondrial disorders. Cranial and spinal nerve enhancement are known to occur in MLD and Krabbe disease (Figure 12).
Figure 12.
Enhancement in IEM. Sagittal post contrast T1 weighted (A) and axial FLAIR images (B) in Alexander disease shows focal nodular enhancement and hyperintensity in lower medulla including area postrema (arrows). Axial post contrast T1 weighted images (C,D) in metachromatic leukodystrophy shows bilateral trigeminal, facial and vestibulocochlear nerve enhancement (arrows). Axial post contrast T1 weighted image (E) in X-linked adrenoleukodystrophy shows confluent posterior predominant white matter changes with enhancement of intermediate Schaumburg zone (arrow). IEM, inborn errors of metabolism.
Role of MR spectroscopy
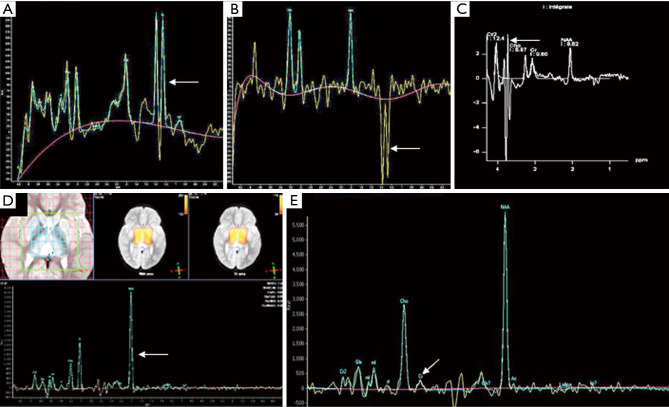
MR spectroscopy is invaluable in the work up of neurometabolic diseases. Indeed, it may be the only abnormality identified in creatine deficiency (absent or reduced creatine peak at 3.03 ppm) and in mitochondrial disorders (lactate at 1.3 ppm). It also helps in confirming the diagnosis in NKH (elevated glycine peak at 3.55 ppm which persists on long TE), MSUD (branched chain amino acid peak at 0.9 ppm), Canavan disease (very high NAA peak at 2.01 ppm), galactosemia (galactitol peak at 3.7 ppm) and phenylketonuria (phenylalanine peak at 7.3 ppm, using very short TE); and is a marker for hyperammonemia in urea cycle defects (elevated glutamate/glutamine peak between 2.2 and 2.4 ppm) (2,7,15,46,47). MRS can also predict disease progression (NAA/choline ratio below 5) in otherwise normal appearing parenchyma in X-ALD. Furthermore, it can be used to monitor therapy in creatine deficiency syndromes and phenylketonuria. Some examples are depicted in Figure 13.
Figure 13.
MR spectroscopy in IEMs. Short TE (A) and intermediate TE (B) MR spectroscopy in mitochondrial cytopathy shows large lactate peak at 1.3 ppm (arrows) (note lactate is inverted at intermediate TE). Short TE MR spectroscopy (C) shows galactitol peak at 3.7 ppm (arrow) in galactosemia. Intermediate TE MR Spectroscopy shows large NAA peak in Canavan disease (arrow, D) and very small creatine peak in cerebral creatine deficiency (arrow, E). MR, magnetic resonance; IEM, inborn errors of metabolism; NAA, N-acetylaspartate; TE, time to echo.
Certain important caveats need to be considered while interpreting MRS. Lactate elevation is not exclusive to mitochondrial disorders and can be seen in any disorder that results in anaerobic glycolysis such as ischemic lesions and in children who are critically ill due to any cause. Small lactate peaks are also known to occur in normal neonatal brains. Technical factors that can affect the appearance of peaks should also be kept in mind. Reduced or absent signal of lactate at 144 TE in higher field strength magnets due to J modulation is a good example (48).
Focused section
The devastating metabolic diseases of the newborn
Majority of the classically described small molecule category of IEM present in the neonatal period. As a rule of thumb, clinical manifestations of these disorders depend on the degree of residual enzyme activity and the rapidity in accumulation of toxic intermediates, energy or substrate deficiency. Whilst these classic disorders generally present following a lag period (during which there is exposure to the dietary substrates), many small molecule and energy deficiency disorders present antenatally or at the time of birth with various congenital anomalies, dysmorphism and malformations. Though the degree of residual enzyme activity and genotype phenotype correlation holds true in the majority of cases, there are exceptions with late onset and attenuated phenotypes occurring due to various genetic and non-genetic modifiers.
Whilst the broad pathophysiological approach helps in understanding this umbrella group of disorders, an integrated approach with clinical symptomatology, biochemical phenotyping and constellation of imaging findings is more useful in day-to-day practice. Acute encephalopathy is the most common clinical presentation in neonates with IEM, which is further explored by biochemical parameters. Other common presentations include epilepsy, neuromuscular weakness, dysmorphism, congenital anomalies and other organ system involvement such as hepatic and cardiac involvement (5).
Acute encephalopathy is usually accompanied by varying degrees of tone abnormalities, seizures, movement disorders, brainstem dysfunction and breathing pattern abnormalities. Organic acidurias and amino acidurias classically present with metabolic acidosis with high anion gap due to accumulation of ketone bodies, organic acids or lactate. Urine ketones when present are almost always abnormal in a neonate. Presence or absence of ketosis, lactatemia and hyperammonemia helps in further narrowing down the possibilities. Ketoacidosis with hyperammonemia signifies underlying organic acidurias. Inappropriate ketosis is also seen with aminoacidurias and disorders of ketone degradation such as ketothiolase deficiency. Absence of ketosis in a sick neonate is seen with fatty acid oxidation defects such as glutaric aciduria type II, very long-chain acyl-CoA dehydrogenase deficiency, carnitine palmitoyl transferase II deficiency and in ketogenesis defects such as HMG CoA lyase deficiency. Elevated lactate levels in the absence of sepsis and hypoperfusion points to disorders of pyruvate metabolism and mitochondrial disorders. Lactate-pyruvate ratio is a marker of cytoplasmic redox status and helps in further differentiating disorders with congenital lactic acidosis. Lactate elevation is also often found in advanced stages of many disorders such as organic acidurias and urea cycle defects which disturb the original metabolic profile. Therefore, an attempt should always be made to correlate lactate levels with stage of the disease and the degree of organ dysfunction. Absence of acidosis in a sick neonate or the presence of respiratory alkalosis with characteristic breathing pattern is seen in various urea cycle disorders. Again, it is imperative to pick this up early, as most urea cycle defects presenting in neonatal period have a rapid fatal course with shift of the acid base status to metabolic acidosis and hyperlactatemia. Varying degrees of hyperammonemia and acidosis is also seen in liver dysfunction due to various etiologies. Hypoglycemia with disproportionately low ketosis is seen with fatty acid oxidation disorders. Recurrent hypoglycaemia with ketosis is the hallmark of glycogen storage disorders, and associated lactate elevation is seen in disorders of gluconeogenesis.
The neonatal onset IEMs can be broadly grouped under the following categories:
(I). Disorders of intoxication
As alluded to earlier, these are related to accumulation of toxic products proximal to an interruption in a biochemical pathway. These toxic products can affect the normal function of the brain and other organs.
MR imaging is often nonspecific in later stages of the disease. Certain disorders however have characteristic imaging patterns particularly at the first episode of decompensation. Imaging at this stage is therefore crucial as it provides a narrow window of opportunity. As discussed in the pathologies below, both DWI and MRS are crucial to diagnosing a substantial number of disorders in this age group, and should therefore be routinely performed.
Neonatal onset MSUD has the classical distribution of restricted diffusion involving myelinated white matter at birth including the perirolandic white matter, posterior centrum semiovale, posterior limb of internal capsule, thalami, GP, cerebral peduncles, brainstem and cerebellar white matter. Typical appearance in the brainstem is that of “4 dots” representing involvement of the ventrally located corticospinal tracts and dorsally located central tegmental tracts (personal communication, Dr. Susan Blaser, The Hospital for Sick Children). This finding, along with thalamic, GP and diffuse cerebellar white matter involvement is useful to distinguish MSUD from neonatal onset MMA (see below). Extent of restricted diffusion with thalamic and GP involvement also helps differentiation from another MSUD mimic-NKH (see below). In addition to myelin splitting cytotoxic edema, MSUD also has extensive vasogenic edema involving the unmyelinated white matter leading to diffusely increased swelling and T2 hyperintensity. MR spectroscopy is useful in demonstrating a broad based branched chain amino acid peak at 0.9 ppm (46).
Neonatal onset non-ketotic hyperglycinemia may mimic MSUD, however the extent of involvement is less striking when compared to MSUD, and is generally confined to the corticospinal tract and cerebellar white matter. MR spectroscopy shows glycine peak at 3.55 ppm confirming the diagnosis. Moreover, NKH may demonstrate underdevelopment of the corpus callosum, which is not a feature of MSUD (2).
Neonatal onset MMA may show involvement of the supratentorial corticospinal tract. In the brainstem however, it typically has two “dots”—those involving central tegmental tracts (personal communication, Dr. Susan Blaser, The Hospital for Sick Children), without ventral brainstem and cerebellar white matter involvement, helping to distinguish it from MSUD. MMA may also present with a non-specific imaging pattern such as diffuse white matter edema. Late onset MMA typically has symmetric GP involvement.
Neonatal onset propionic acidemia is generally nonspecific on imaging, with diffuse swelling and white matter restricted diffusion (49). Isovaleric aciduria has been reported to have bilateral posterior putaminal signal abnormalities, atrophy and delayed myelination (50); bilateral GP and mesencephalic corticospinal tract involvement (51,52); nonspecific white matter edema and microhaemorrhages (46). Both propionic and isovaleric acidemias may present with intracranial haemorrhage due to thrombocytopenia or coagulopathy from hepatic dysfunction.
Urea cycle disorders with typical neonatal onset include carbamoyl phosphate synthetase deficiency, ornithine transcarbamylase deficiency, arginosuccinate lyase deficiency and citrullinemia. CNS injury occurs due to glutamate excitotoxicity resulting from hyperammonemia, and astrocytic swelling/cytotoxic edema due to the osmotically active glutamine. Imaging is usually nonspecific, with global edema and basal ganglia involvement. Sparing of the thalami helps distinguish urea cycle defects from profound HIE. Other patterns of injury include deep insular and perirolandic involvement, asymmetric lobar edema and ribbon like restricted diffusion involving the depth of the sulcus, the latter strongly suggestive of the diagnosis. MRS shows elevated glutamate/glutamine peak between 2.2 and 2.4 ppm and lactate peak at 1.3 ppm (46).
(II). Disorders of energy production
This encompasses conditions such as PDH, mitochondrial oxidative phosphorylation disorders, fatty acid oxidation disorders, sulfite oxidase deficiency and molybdenum cofactor deficiency. These can present with clinical and radiological features indistinguishable from moderate to severe perinatal asphyxia. Progressive downhill course after a period of initial stability and disproportionate lactic acidosis and should alert the physician to suspect a potential metabolic etiology in such scenarios.
The primary lactic acidosis disorders occurring in the neonatal period include pyruvate carboxylase deficiency, PDH, and mitochondrial respiratory chain defects. Imaging is often nonspecific if not unremarkable. MR spectroscopy may demonstrate an elevated lactate peak, however its absence does not exclude the diagnosis. PDH may show Leigh’s syndrome phenotype in up to 50% of patients, corpus callosal anomalies (agenesis, hypogenesis or diffuse thinning), and white matter cysts (2,53).
Sulfite oxidase deficiency is another disorder of energy metabolism. It may occur as an isolated form or in combination with molybdenum cofactor deficiency. Imaging in the acute phase typically shows severe cerebral edema with involvement of the deep grey nuclei, in particular the GP and subthalamic nuclei. Follow up imaging shows progressive necrosis involving the grey and white matter, including the deep grey nuclei and cerebellum. Eventually, it evolves into multi-cystic encephalomalacia like changes with severe atrophy mimicking severe global anoxia/hypoxia (54,55).
(III). Disorders of biosynthesis and catabolism of complex molecules
Peroxisomal disorders presenting in the neonatal period include Zellweger syndrome, neonatal adrenoleukodystrophy and peroxisomal bifunctional deficiency. Peroxisomes are cellular organelles, found ubiquitously, and are abundant in the developing brain. Peroxisomal function is crucial to neuronal migration and organization, as well as for normal myelin formation. These disorders therefore commonly present with dysmorphic features and congenital malformations due to prenatal onset of enzyme deficiency resulting in dysembryogenesis. Zellweger syndrome is characterised by extensive polymicrogyria like changes, delayed myelination, germinolytic cysts and several other malformations such as callosal and sulcal anomalies. Renal cysts and chondrodysplasia punctate involving the patella and acetabuli are also typical (2). Neonatal adrenoleukodystrophy has similar neuroimaging features with abnormal myelin and migrational abnormalities but lacks the skeletal changes. In addition there may be contrast enhancement similar to that seen in X-linked ALD related to active inflammation. Imaging features of peroxisomal bifunctional deficiency is indistinguishable from Zellweger syndrome (50). Krabbe disease and CDG also come under this group of disorders.
(IV). Neurotransmitter disorders
Neurotransmitter disorders presenting in this age group are NKH, pyridoxine deficiency and disorders of biopterin metabolism.
Mitochondrial disorders
Mitochondria are under dual genetic control, with mitochondrial DNA defects inherited maternally, and nuclear DNA defects inherited in Mendelian pattern. Therefore, in a suspected case based on clinico-radiological phenotyping, both WES and mitochondrial DNA sequencing should be performed. The phenomenon of heteroplasmy (varying mutational load in mitochondria) often explains the differences in severity between tissues in the same individual and also among members of the family with the same mutation. The complex genetic landscape of mitochondrial disease often translates into poor diagnostic yield.
Radiology plays a central role in suspecting mitochondrial disorders when typical findings are demonstrated. Symmetric diffusion restriction with characteristic deep grey nuclei and brainstem involvement, white matter changes and a significant lactate peak on MRS all raise the suspicion of mitochondrial disease. However, it should be kept in mind that often the imaging findings are nonspecific, and a “normal” or “nonspecific” MRI pattern does not exclude a mitochondrial disorder.
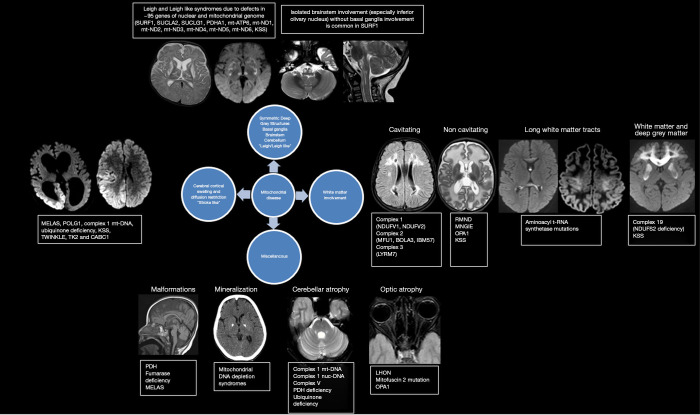
A representative figure of different patterns and common mutations responsible is provided in Figure 14.
Figure 14.
Mitochondrial diseases—different patterns and common genes.
Mitochondrial cytopathies have a wide spectrum of radiologic manifestations, with Leigh syndrome (LS) associated symmetric deep grey nuclei involvement being the most well recognised pattern. In a recent study on 53 children with LS, it was noted that mitochondrial DNA defects had a predilection to involve the cerebral and cerebellar cortices, the dorsomedial thalami, caudate bodies and substantia nigra; while pathogenic variants in nuclear DNA was more commonly associated with white matter involvement and diffuse thalamic involvement. Striatal involvement was seen in both groups (56). Other well described patterns include: cerebral and cerebellar cortical involvement and atrophy, white matter involvement with diffusion restriction and target like cavitation, and long tract involvement.
Diagnostic pathways and the impact of clinico-radiological phenotyping on diagnostic testing and interpretation of results
Since the initial description of alkaptonuria by Sir Archibald Garrod in 1902, there has been an exponential increase in the number of IEMs being described. A confirmed diagnosis at the metabolic pathway and molecular level is essential for management including genetic counselling concerning recurrence risk, therapeutic interventions, pre-emptive treatment of expected complications, and modifying the disease course. Deciphering the metabolic pathway is often the first step in searching for a therapeutic cure. Global metabolic profiling by untargeted mass spectrometry‐based metabolomic platforms and advances in genomics has transformed our understanding of IEMs and in the detection of novel metabolic disorders. Rapid growth in various fields like metabolomics, lipidomics, glycomics, genomics, transcriptomics and proteomics has led to discovery of novel metabolic disorders and increased understanding of pathophysiological states of various known IEMs, thereby paving pathway for translational genomics and personalized treatment options.
Next generation sequencing has revolutionized the field of metabolic medicine not only by unearthing new diseases, but also providing explanations for known complicated scenarios such as phenotypic expansion of common diseases, amalgamated phenotypes with two coexisting monogenic defects, synergistic heterozygosity of concurrent partial enzymatic deficiencies, or multiple genes in functionally related pathways. Nosology is ever changing with periodic updates to maintain its utility. Translational genomics has become a reality with advancement of our knowledge on the precise genetic or biochemical defect in a metabolic pathway and provides the opportunity to modify disease by therapeutic interventions ranging from nutritional manipulation, cofactor supplementation, substrate reduction therapy and gene therapies.
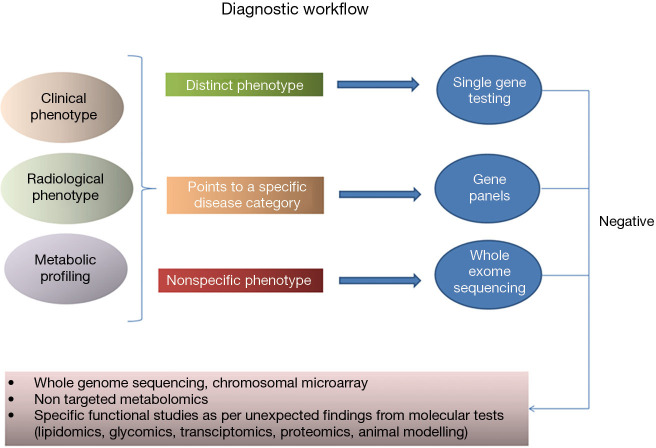
Whilst undisputedly metabolomics and genomics has revolutionized the field, clinical, biochemical and radiological phenotyping continues to be the stepping stone. There exist challenges in the interpretation of the huge data in the context of clinical, biochemical and radiological features. This exciting task of integration is extremely important for a meaningful translation of knowledge to bedside patient care. As high percentages of metabolic disorders are treatable, it is imperative to understand the limitations of each of these data when interpreted in isolation and that it holds meaning only in the appropriate clinical context. There are a range of options for evaluation based on the disease presentation per se, although one needs to consider the available resources, urgency of the situation and other factors. Whilst biochemical evaluation ranges from targeted metabolic testing to non-targeted metabolomics platforms, genetic evaluation ranges from targeted single gene testing to gene panels, whole genome and array-based technologies. Whilst single gene testing is simple, larger panels and whole exome sequencing carries the risk of finding unexpected results, which may necessitate further detailed functional testing to ascertain the significance of the variants found. Simple illustration of a diagnostic pathway is given in Figure 15.
Figure 15.
Diagnostic work flow of IEM based on clinic-radiologic phenotyping. IEM, inborn errors of metabolism.
Clinical vignettes
Case vignette 1
A 2-year-old boy presented with dystonia involving limbs, facial and bulbar muscles following an episode of encephalopathy at 8 months of age, precipitated by an episode of gastroenteritis. His perinatal period was uneventful and developmental milestones were age appropriate until 8 months of age. On examination, he was noted to be macrocephalic and had generalized dystonia. MRI findings are illustrated in Figure 16, urine gas chromatography-mass spectrometry (GCMS) revealed elevated levels of glutaric acid and 3-hydroxyglutaric acid. Plasma acyl-carnitine analysis revealed elevated levels of glutaryl carnitine (C5DC). Based on the clinical features, radiological and metabolic investigations he was diagnosed with glutaric aciduria type 1. Targeted single gene sequencing of GCDH revealed compound heterozygous variants (c.572T>C, c.1240G>A) consistent with the diagnosis of GA1.
Figure 16.
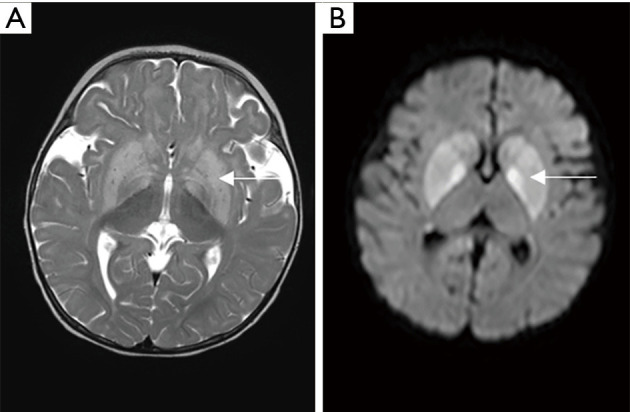
Glutaric aciduria type 1. Axial T2 weighted images (A) show symmetric swelling and hyperintensity of the caudate and lentiform nuclei bilaterally (arrow), as well as some frontotemporal underdevelopment with wide opercula. DWI images (B) show striatal and pallidal diffusion restriction (arrow). DWI, diffusion weighted imaging.
Case vignette 2
A 28-year-old lady presented at 18 weeks of gestation with concerns of fetal CNS malformations detected by an anomaly scan. Two of her children, both females, had global developmental delay, profound developmental disability and refractory seizures, and were deceased at 3.5 and 1.5 years of age respectively. Metabolic workup in one of these children revealed persistently elevated lactate, and MRI showed pronounced ventriculomegaly and white matter volume loss (Figure 17). Clinico-radiological suspicion was one of PDH. While planning for further testing including exome sequencing, the child unfortunately succumbed to the illness and family was lost to follow-up. They presented currently with pregnancy of 18 weeks with abnormality detected in fetal ultrasound. Fetal MRI done revealed absence of corpus callosum.
Figure 17.
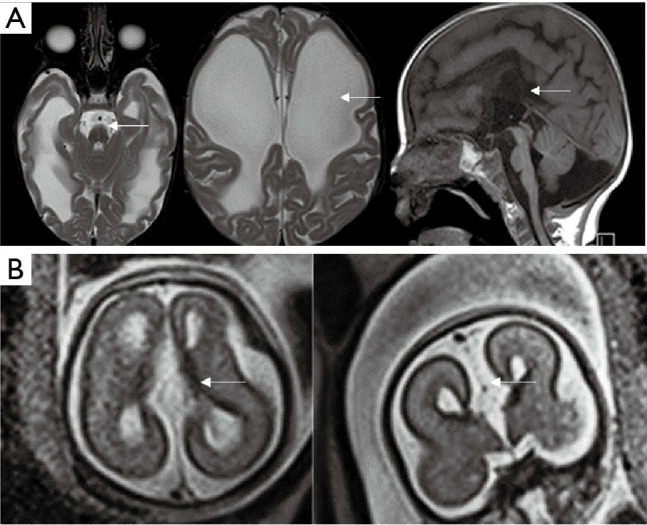
Pyruvate dehydrogenase deficiency. Axial T2 and sagittal T1 weighted images of the first child (A) shows significant lateral and third ventricular dilatation, normal fourth ventricle with unrecognisable corpus callosum and a small pons (arrows). Fetal MRI with axial and coronal T2 HASTE sequences (B) of second pregnancy shows absent corpus callosum (arrows). MRI, magnetic resonance imaging.
Aneuploidy screen was negative. Exome sequencing of fetal DNA obtained from amniocentesis revealed pathogenic variants consistent with pyruvate dehydrogenase (PDHA1) deficiency.
Case vignette 3
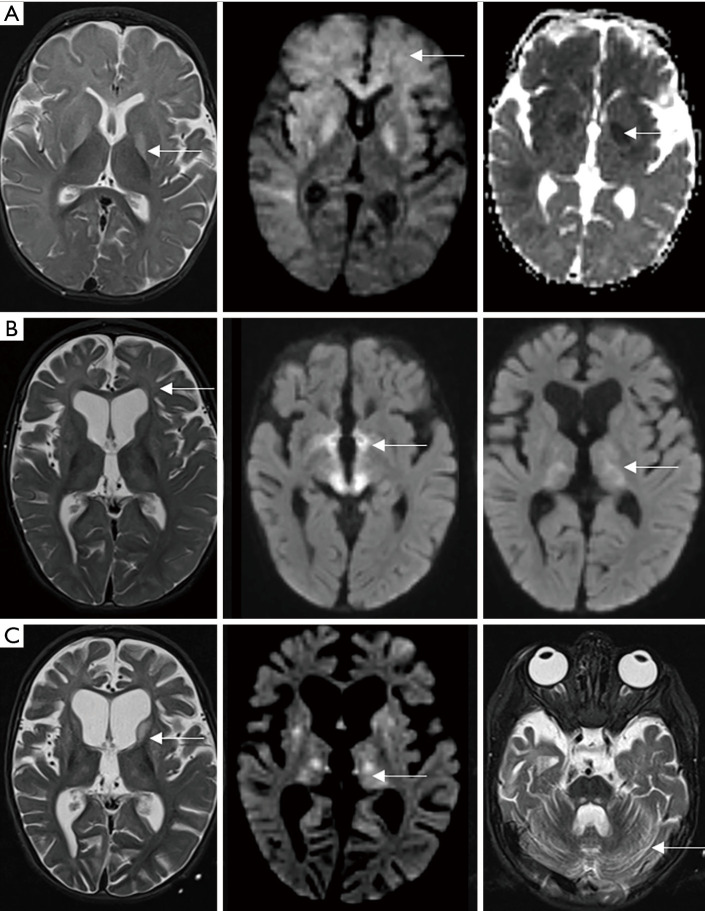
A 6-month-old girl presented with febrile encephalopathy and was diagnosed with H1N1 encephalitis. She had acute regression of acquired developmental milestones with the illness. There were EKG changes suggestive of left ventricular hypertrophy and hence an echocardiogram was done which confirmed left ventricular hypertrophy. MRI showed extensive asymmetric swelling and restricted diffusion in GP and frontal predominant white matter abnormality (Figure 18). She further developed epileptic spasms at 9 months of age which remitted within two days of initiation of steroids and vigabatrin. She had some developmental gains with physical therapy, however was readmitted at 10 months with subacute developmental regression in the form of absent head control, poor visual fixation, lethargy and hypotonia. Repeat MRI at this time showed significant interval volume loss and residual signal changes in previously involved areas and new areas of symmetric diffusion restriction involving the thalami, midbrain and inferior GP. Further evaluation with metabolic and genetic workup revealed a pathogenic variant in the MTATP6 gene, thus confirming mitochondrial complex V deficiency.
Figure 18.
Complex V deficiency. MRI at three different time points shows: (A) extensive swelling and restricted diffusion in globi pallidi and white matter with frontal predominance (arrows). (B) Significant interval volume loss and residual signal changes in previously involved areas and new areas of symmetric diffusion restriction involving thalami, midbrain and inferior globi pallidi (arrows) (latter findings were partly attributed to vigabatrin related changes). (C) Further cerebral and cerebellar volume loss with new areas of signal changes and restricted diffusion in basal ganglia (arrows). MRI, magnetic resonance imaging.
Case vignette 4
A three-year-old girl presented with gradual regression of attained milestones from two years of age. She also developed gradually progressive incoordination of limbs, involuntary movements and myoclonic seizures. There were no adverse perinatal events and she was developmentally normal until two years of age. There was no significant family history, although consanguinity was reported. Clinical exam revealed a normocephalic child with cerebellar ataxia, choreoathetosis and peripheral neuropathy. Neuroimaging revealed white matter hyperintensities and calcification (Figure 19). Diagnosis of cerebral folate deficiency was confirmed by a homozygous mutation in FOLR1 and low CSF levels of 5-methyltetrahydrofolate.
Figure 19.
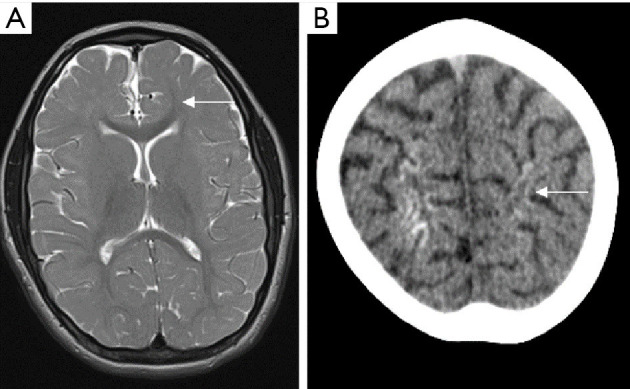
Cerebral folate deficiency. Axial T2 weighted image (A) shows diffuse reduction in myelination (arrow). Subsequent CT (B) shows bilateral parenchymal calcification (arrow).
Conclusions
Bidirectional interdependence and multidisciplinary collaboration are the best approach for accurate and timely diagnosis of these rare disorders. Radiologists play an important role in suspecting, guiding the diagnostic pathway and confirming the diagnosis by prospective and retrospective phenotyping.
Supplementary
The article’s supplementary files as
Acknowledgments
Funding: None.
Ethical Statement: The authors confirm that they are accountable for all aspects of the work in ensuring that questions related to the accuracy or integrity of any part of the work are appropriately investigated and resolved.
Footnotes
Provenance and Peer Review: This article was commissioned by the editorial office, Translational Pediatrics for the series “Pediatric Neuroradiology for Trainees and Fellows: An Updated Practical Guide”. The article has undergone external peer review.
Conflicts of Interest: All authors have completed the ICMJE uniform disclosure form (available at http://dx.doi.org/10.21037/tp-20-335). The series “Pediatric Neuroradiology for Trainees and Fellows: An Updated Practical Guide” was commissioned by the editorial office without any funding or sponsorship. Felice D’Arco served as the unpaid Guest Editor of the series and serves as an unpaid editorial board member of Translational Pediatrics from Sep 2019 to Oct 2021. The authors have no other conflicts of interest to declare.
References
- 1.van der Knaap MS, Valk J, Barkhof F, et al. Magnetic resonance of myelination and myelin disorders. 3rd ed. Berlin; New York: Springer; 2005:1084. [Google Scholar]
- 2.Barkovich AJ, Patay Z. Metabolic, Toxic, and Autoimmune/Inflammatory Brain Disorder. In: Barkovich AJ, Raybaud C. editors. Pediatric Neuroimaging. 6 edition. Wolters Kluwer Health; 2018:129-370. [Google Scholar]
- 3.Morava E, Rahman S, Peters V, et al. Quo vadis: the re-definition of “inborn metabolic diseases.” J Inherit Metab Dis 2015;38:1003-6. 10.1007/s10545-015-9893-x [DOI] [PubMed] [Google Scholar]
- 4.Saudubray JM, Mochel F, Lamari F, et al. Proposal for a simplified classification of IMD based on a pathophysiological approach: A practical guide for clinicians. J Inherit Metab Dis 2019;42:706-27. 10.1002/jimd.12086 [DOI] [PubMed] [Google Scholar]
- 5.Saudubray JM, Desguerre I, Sedel F, et al. Clinical Approach to Inborn Errors of Metabolism in Paediatrics. In: Fernandes J, Saudubray JM, van den Berghe G, et al. editors. Inborn Metabolic Diseases [Internet]. Berlin, Heidelberg: Springer Berlin Heidelberg; 2012:3-54 [cited 2020 Apr 7]. Available online: http://link.springer.com/10.1007/978-3-642-15720-2_1 [Google Scholar]
- 6.Bhatia KD, Krishnan P, Kortman H, et al. Acute Cortical Lesions in MELAS Syndrome: Anatomic Distribution, Symmetry, and Evolution. AJNR Am J Neuroradiol 2020;41:167-73. 10.3174/ajnr.A6325 [DOI] [PMC free article] [PubMed] [Google Scholar]
- 7.Barkovich AJ. An approach to MRI of metabolic disorders in children. J Neuroradiol 2007;34:75-88. 10.1016/j.neurad.2007.01.125 [DOI] [PubMed] [Google Scholar]
- 8.Vanhanen SL, Raininko R, Santavuori P. Early differential diagnosis of infantile neuronal ceroid lipofuscinosis, Rett syndrome, and Krabbe disease by CT and MR. AJNR Am J Neuroradiol 1994;15:1443-53. [PMC free article] [PubMed] [Google Scholar]
- 9.Biswas A, Krishnan P, Amirabadi A, et al. Expanding the Neuroimaging Phenotype of Neuronal Ceroid Lipofuscinoses. AJNR Am J Neuroradiol 2020;41:1930-6. 10.3174/ajnr.A6726 [DOI] [PMC free article] [PubMed] [Google Scholar]
- 10.Smith JK, Mah JK, Castillo M. Brain MR imaging findings in two patients with Alpers’ syndrome. Clinical Imaging 1996;20:235-7. 10.1016/0899-7071(95)00039-9 [DOI] [PubMed] [Google Scholar]
- 11.Engelsen BA, Tzoulis C, Karlsen B, et al. POLG1 mutations cause a syndromic epilepsy with occipital lobe predilection. Brain 2008;131:818-28. 10.1093/brain/awn007 [DOI] [PubMed] [Google Scholar]
- 12.Quadri M, Kamate M, Sharma S, et al. Manganese transport disorder: novel SLC30A10 mutations and early phenotypes. Mov Disord 2015;30:996-1001. 10.1002/mds.26202 [DOI] [PubMed] [Google Scholar]
- 13.Stamelou M, Tuschl K, Chong WK, et al. Dystonia with Brain Manganese Accumulation Resulting From SLC30A10 Mutations: A New Treatable Disorder. Mov Disord 2012;27:1317-22. 10.1002/mds.25138 [DOI] [PMC free article] [PubMed] [Google Scholar]
- 14.Herrero Hernandez E, Valentini MC, Discalzi G. T1-weighted hyperintensity in basal ganglia at brain magnetic resonance imaging: are different pathologies sharing a common mechanism? Neurotoxicology 2002;23:669-74. 10.1016/S0161-813X(02)00016-5 [DOI] [PubMed] [Google Scholar]
- 15.Patay Z, Blaser SI, Poretti A, et al. Neurometabolic diseases of childhood. Pediatr Radiol 2015;45 Suppl 3:S473-84. 10.1007/s00247-015-3279-y [DOI] [PubMed] [Google Scholar]
- 16.Biswas A, Varman M, Gunturi A, et al. Teaching NeuroImages: Acute necrotizing encephalopathy of childhood: Neuroimaging findings. Neurology 2018;90:e177-8. 10.1212/WNL.0000000000004800 [DOI] [PubMed] [Google Scholar]
- 17.van der Knaap MS, Bugiani M. Leukodystrophies: a proposed classification system based on pathological changes and pathogenetic mechanisms. Acta Neuropathol 2017;134:351-82. 10.1007/s00401-017-1739-1 [DOI] [PMC free article] [PubMed] [Google Scholar]
- 18.Malik P, Muthusamy K, Mankad K, et al. Solving the hypomyelination conundrum - Imaging perspectives. Eur J Paediatr Neurol 2020;27:9-24. 10.1016/j.ejpn.2020.04.007 [DOI] [PubMed] [Google Scholar]
- 19.Sasaki M, Sakuragawa N, Takashima S, et al. MRI and CT findings in Krabbe disease. Pediatr Neurol 1991;7:283-8. 10.1016/0887-8994(91)90046-N [DOI] [PubMed] [Google Scholar]
- 20.Muthusamy K, Sudhakar SV, Thomas M, et al. Revisiting magnetic resonance imaging pattern of Krabbe disease - Lessons from an Indian cohort. J Clin Imaging Sci 2019;9:25. 10.25259/JCIS-18-2019 [DOI] [PMC free article] [PubMed] [Google Scholar]
- 21.Chen CY, Zimmerman RA, Lee CC, et al. Neuroimaging findings in late infantile GM1 gangliosidosis. AJNR Am J Neuroradiol 1998;19:1628-30. [PMC free article] [PubMed] [Google Scholar]
- 22.Mugikura S, Takahashi S, Higano S, et al. MR findings in Tay-Sachs disease. J Comput Assist Tomogr 1996;20:551-5. 10.1097/00004728-199607000-00009 [DOI] [PubMed] [Google Scholar]
- 23.van der Voorn JP, Pouwels PJW, Kamphorst W, et al. Histopathologic correlates of radial stripes on MR images in lysosomal storage disorders. AJNR Am J Neuroradiol 2005;26:442-6. [PMC free article] [PubMed] [Google Scholar]
- 24.Kim JH, Kim HJ. Childhood X-linked Adrenoleukodystrophy: Clinical-Pathologic Overview and MR Imaging Manifestations at Initial Evaluation and Follow-up. Radiographics 2005;25:619-31. 10.1148/rg.253045118 [DOI] [PubMed] [Google Scholar]
- 25.van der Knaap MS, Naidu S, Breiter SN, et al. Alexander Disease: Diagnosis with MR Imaging. AJNR Am J Neuroradiol 2001;22:541-52. [PMC free article] [PubMed] [Google Scholar]
- 26.Grodd W, Krägeloh-Mann I, Petersen D, et al. In vivo assessment of N-acetylaspartate in brain in spongy degeneration (Canavan’s disease) by proton spectroscopy. Lancet 1990;336:437-8. 10.1016/0140-6736(90)91982-G [DOI] [PubMed] [Google Scholar]
- 27.van der Knaap MS, Barth PG, Stroink H, et al. Leukoencephalopathy with swelling and a discrepantly mild clinical course in eight children. Ann Neurol 1995;37:324-34. 10.1002/ana.410370308 [DOI] [PubMed] [Google Scholar]
- 28.Steenweg ME, Salomons GS, Yapici Z, et al. l-2-Hydroxyglutaric Aciduria: Pattern of MR Imaging Abnormalities in 56 Patients. Radiology 2009;251:856-65. 10.1148/radiol.2513080647 [DOI] [PubMed] [Google Scholar]
- 29.Patay Z, Orr BA, Shulkin BL, et al. Successive distinct high-grade gliomas in L-2-hydroxyglutaric aciduria. J Inherit Metab Dis 2015;38:273-7. 10.1007/s10545-014-9782-8 [DOI] [PMC free article] [PubMed] [Google Scholar]
- 30.Otaduy MCG, Leite CC, Lacerda MTC, et al. Proton MR Spectroscopy and Imaging of a Galactosemic Patient before and after Dietary Treatment. AJNR Am J Neuroradiol 2006;27:204-7. [PMC free article] [PubMed] [Google Scholar]
- 31.Chu BC, Terae S, Takahashi C, et al. MRI of the brain in the Kearns- Sayre syndrome: report of four cases and a review. Neuroradiology 1999;41:759-64. 10.1007/s002340050838 [DOI] [PubMed] [Google Scholar]
- 32.Brismar J, Aqeel A, Brismar G, et al. Maple syrup urine disease: findings on CT and MR scans of the brain in 10 infants. AJNR Am J Neuroradiol 1990;11:1219-28. [PMC free article] [PubMed] [Google Scholar]
- 33.Jan W, Zimmerman RA, Wang ZJ, et al. MR diffusion imaging and MR spectroscopy of maple syrup urine disease during acute metabolic decompensation. Neuroradiology 2003;45:393-9. 10.1007/s00234-003-0955-7 [DOI] [PubMed] [Google Scholar]
- 34.van der Knaap MS, Wolf NI, Heine VM. Leukodystrophies: Five new things. Neurol Clin Pract 2016;6:506-14. 10.1212/CPJ.0000000000000289 [DOI] [PMC free article] [PubMed] [Google Scholar]
- 35.Carroll WJ, Woodruff WW, Cadman TE. MR findings in oculocerebrorenal syndrome. AJNR Am J Neuroradiol 1993;14:449-51. [PMC free article] [PubMed] [Google Scholar]
- 36.Robertson WC, Viseskul C, Lee YE, et al. Basal Ganglia Calcification in Kearns-Sayre Syndrome. Arch Neurol 1979;36:711-3. 10.1001/archneur.1979.00500470081017 [DOI] [PubMed] [Google Scholar]
- 37.Barkovich AJ, Good WV, Koch TK, et al. Mitochondrial disorders: analysis of their clinical and imaging characteristics. AJNR Am J Neuroradiol 1993;14:1119-37. [PMC free article] [PubMed] [Google Scholar]
- 38.Chen CC, Chiu PC, Shieh KS. Type 1 GM1 gangliosidosis with basal ganglia calcification: a case report. Zhonghua Yi Xue Za Zhi (Taipei) 1999;62:40-5. [PubMed] [Google Scholar]
- 39.Schulz PE, Weiner SP, Belmont JW, et al. Basal ganglia calcifications in a case of biotinidase deficiency. Neurology 1988;38:1326-8. 10.1212/WNL.38.8.1326 [DOI] [PubMed] [Google Scholar]
- 40.Radmanesh A, Zaman T, Ghanaati H, et al. Methylmalonic acidemia: brain imaging findings in 52 children and a review of the literature. Pediatr Radiol 2008;38:1054-61. 10.1007/s00247-008-0940-8 [DOI] [PubMed] [Google Scholar]
- 41.Shi X, Zheng F, Ye X, et al. Basal ganglia calcification and novel compound heterozygous mutations in the PANK2 gene in a Chinese boy with classic Pantothenate kinase-associated neurodegeneration: A case report. Medicine (Baltimore) 2018;97:e0316. 10.1097/MD.0000000000010316 [DOI] [PMC free article] [PubMed] [Google Scholar]
- 42.Aicardi J, Goutières F. A progressive familial encephalopathy in infancy with calcifications of the basal ganglia and chronic cerebrospinal fluid lymphocytosis. Ann Neurol 1984;15:49-54. 10.1002/ana.410150109 [DOI] [PubMed] [Google Scholar]
- 43.Koob M, Laugel V, Durand M, et al. Neuroimaging in Cockayne Syndrome. AJNR Am J Neuroradiol 2010;31:1623-30. 10.3174/ajnr.A2135 [DOI] [PMC free article] [PubMed] [Google Scholar]
- 44.Livingston JH, Stivaros S, Warren D, et al. Intracranial calcification in childhood: a review of aetiologies and recognizable phenotypes. Dev Med Child Neurol 2014;56:612-26. 10.1111/dmcn.12359 [DOI] [PubMed] [Google Scholar]
- 45.van der Knaap MS, Salomons GS, Li R, et al. Unusual variants of Alexander’s disease. Ann Neurol 2005;57:327-38. 10.1002/ana.20381 [DOI] [PubMed] [Google Scholar]
- 46.Poretti A, Blaser SI, Lequin MH, et al. Neonatal Neuroimaging Findings in Inborn Errors of Metabolism. J Magn Reson Imaging 2013;37:294-312. 10.1002/jmri.23693 [DOI] [PMC free article] [PubMed] [Google Scholar]
- 47.Blaser S, Feigenbaum A. A neuroimaging approach to inborn errors of metabolism. Neuroimaging Clin N Am 2004;14:307-29, ix. 10.1016/j.nic.2004.03.013 [DOI] [PubMed] [Google Scholar]
- 48.Lange T, Dydak U, Roberts TPL, et al. Pitfalls in Lactate Measurements at 3T. AJNR Am J Neuroradiol 2006;27:895-901. [PMC free article] [PubMed] [Google Scholar]
- 49.Reddy N, Calloni SF, Vernon HJ, et al. Neuroimaging Findings of Organic Acidemias and Aminoacidopathies. Radiographics 2018;38:912-31. 10.1148/rg.2018170042 [DOI] [PubMed] [Google Scholar]
- 50.Patay Z. MR imaging workup of inborn errors of metabolism of early postnatal onset. Magn Reson Imaging Clin N Am 2011;19:733-59;vii. 10.1016/j.mric.2011.09.001 [DOI] [PubMed] [Google Scholar]
- 51.Sogut A, Acun C, Aydin K, et al. Isovaleric acidaemia: cranial CT and MRI findings. Pediatr Radiol 2004;34:160-2. 10.1007/s00247-003-1049-8 [DOI] [PubMed] [Google Scholar]
- 52.Wani NA, Qureshi UA, Jehangir M, et al. Atypical MR lenticular signal change in infantile isovaleric acidemia. Indian J Radiol Imaging 2016;26:131. 10.4103/0971-3026.178362 [DOI] [PMC free article] [PubMed] [Google Scholar]
- 53.Wada N, Matsuishi T, Nonaka M, et al. Pyruvate dehydrogenase E1α subunit deficiency in a female patient: evidence of antenatal origin of brain damage and possible etiology of infantile spasms. Brain Dev 2004;26:57-60. 10.1016/S0387-7604(03)00072-X [DOI] [PubMed] [Google Scholar]
- 54.Hoffmann C, Ben-Zeev B, Anikster Y, et al. Magnetic resonance imaging and magnetic resonance spectroscopy in isolated sulfite oxidase deficiency. J Child Neurol 2007;22:1214-21. 10.1177/0883073807306260 [DOI] [PubMed] [Google Scholar]
- 55.Millichap J. MRI Findings and Outcome in Molybdenum Cofactor Deficiency. Pediatr Neurol Briefs 2011;25:75-6. 10.15844/pedneurbriefs-25-10-4 [DOI] [Google Scholar]
- 56.Alves CAPF, Teixeira SR, Martin‐Saavedra JS, et al. Pediatric Leigh Syndrome: Neuroimaging Features and Genetic Correlations. Ann Neurol 2020;88:218-32. 10.1002/ana.25789 [DOI] [PubMed] [Google Scholar]
Associated Data
This section collects any data citations, data availability statements, or supplementary materials included in this article.
Supplementary Materials
The article’s supplementary files as


