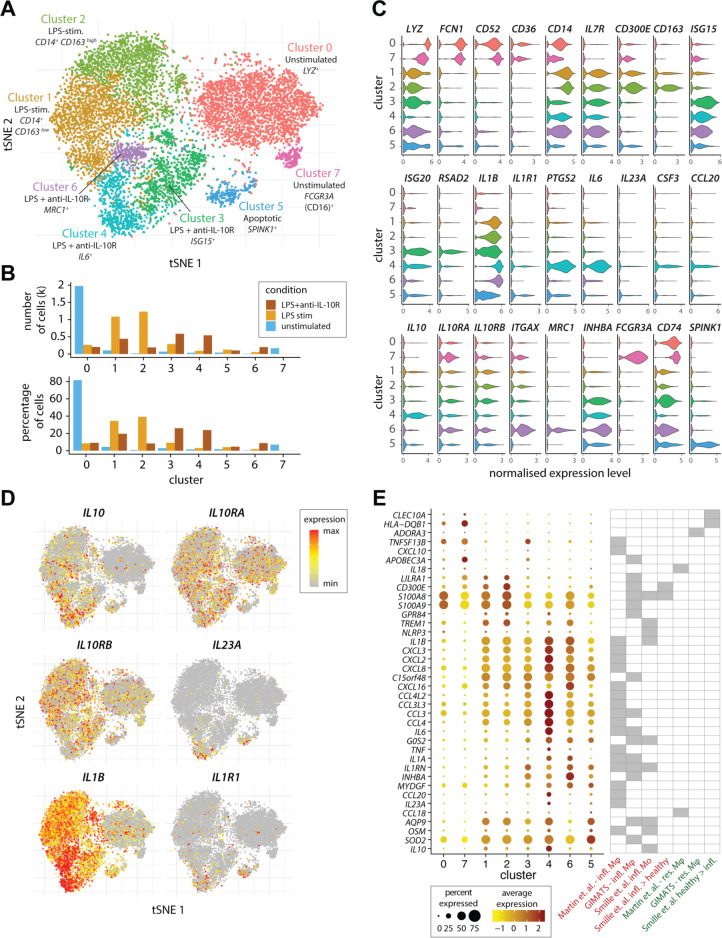
Figure 2.
Single-cell RNA sequencing identifies subsets of inflammatory monocytes. (A) The tSNE plot shows the subpopulations of unstimulated, LPS-stimulated and combined LPS and anti-IL-10R-stimulated monocytes that were identified by a graph-based clustering approach following cross-condition alignment with Harmony (for details please see the online supplemetary materials and supplementary references61) (B) Bar plots show the number and frequency of cells in each of the identified clusters among three stimulation conditions in each of the identified clusters. (C) The violin plots show expression (x-axis) of genes characteristic of the identified monocyte clusters (y-axis). (D) Expression of IL10, IL10RA, IL10RB, IL23A, IL1B and IL1R1 across the single monocytes according to (A). (E) The dot plot shows the expression of genes associated with Mo and Mφ in single-cell studies of CD (Martin et al)9 and UC (Smille et al)25 in the identified clusters of single cells (A). The genes shown were previously identified as characteristic of inflammatory macrophages in CD (‘Martin et al infl. Mφ’) or in anti-TNF-resistant CD (‘GIMATS–infl. Mφ’),9 as characteristic of inflammatory monocytes (‘Smille et al infl. Mo’) or higher in monocytes from inflamed versus healthy tissue (‘Smille et al infl.>healthy’) in UC,25 as characteristic of resident intestinal Mφ in the context of CD (‘Martin et al.–res. Mφ’ and ‘GIMATS–res. Mφ’),9 or more highly expressed in healthy than diseased tissue in the context of UC (‘Smille et al healthy>infl.’).25 For further details, please see the Methods section. CD, Crohn’s disease; GIMATS, IgG plasma cells - inflammatory mononuclear phagocytes - activated T cells - stromal cells; IL, interleukin; LPS, lipopolysaccharide; Mφ, macrophages; Mo, monocyte; TNF, tumour necrosis factor; tSNE, t-distributed stochastic neighbour embedding.

