Abstract
Objective
Despite the need for diagnostics and research, data on fluid biomarkers in hereditary spastic paraplegia (HSP) are scarce. We, therefore, explore Neurofilament light chain (NfL) levels in cerebrospinal fluid (CSF) of patients with hereditary spastic paraplegia and provide information on the influence of demographic factors.
Methods
The study recruited 59 HSP cases (33 genetically confirmed) and 59 controls matched in age and sex. Neurofilament light chain levels were assessed by enzyme‐linked immunosorbent assay. The statistical analysis included the effects of age, sex, and genetic status (confirmed vs. not confirmed).
Results
Levels of CSF NfL were significantly increased in patients with hereditary spastic paraplegia compared to controls (median 741 pg/mL vs. 387 pg/mL, p < 0.001). Age (1.4% annual increase) and male sex (81% increase) impacted CSF NfL levels in patients. The age‐dependent increase of CSF NfL levels was steeper in controls (2.6% annual increase). Thus, the CSF NfL ratio of patients and matched controls—expressing patients’ fold increases in CSF NfL—declined considerably with age.
Interpretation
CSF NfL is a reliable cross‐sectional biomarker in hereditary spastic paraplegia. Sex is a relevant factor to consider, as male patients have remarkably higher CSF NfL levels. While levels also increase with age, the gap between patients and controls is narrowing in older subjects. This indicates distinct temporal dynamics of CSF NfL in patients with hereditary spastic paraplegia, with a rise around phenotypic conversion and comparatively static levels afterward.
Introduction
Hereditary spastic paraplegia (HSP) comprises a group of inherited disorders sharing the clinical hallmark of progressive spastic paraparesis. The underlying cause of spastic paraparesis and pathological core feature of HSP is a length‐dependent axonal degeneration of upper motor neurons. In complicated forms of HSP, signs and symptoms indicating affection of additional neurological systems can be present and may include cognitive impairment, cerebellar ataxia, and peripheral neuropathy among many others. Thorough neurological examination, exclusion of secondary causes and genetic testing are the most important diagnostic tools in HSP. In addition, fluid biomarkers are warranted to support the differentiation of HSP from disease mimics and provide outcome measures for upcoming clinical trials. Since Neurofilament light chain (NfL) has been shown to be elevated in cerebrospinal fluid (CSF) and—more recently—blood across various neurological diseases 1 , 2 and to reflect the degeneration of upper motor neurons, 3 it might also be promising as a biomarker in HSP. The NfL protein is part of the neuronal cytoskeleton and is expected to be released upon neuro‐axonal damage. 4 NfL levels physiologically increase with age and are influenced by sex; these parameters, therefore, need to be monitored when assessing NfL in patients and controls. 5 , 6 , 7 In amyotrophic lateral sclerosis (ALS), the most common motor neuron disease, CSF and blood NfL levels are proven diagnostic and prognostic biomarkers. 8 , 9 In contrast, data on NfL in HSP are scarce, with previous studies either comprising very small samples without comparison to controls 10 , 11 or addressing serum NfL (sNfL). 12 The latter study reported significantly elevated sNfL levels, but details on the possible influence of age and sex on NfL levels are missing. 12 Moreover, as the properties of NfL clearance from CSF to the periphery are incompletely understood, information on CSF NfL (cNfL) is still required. In this study, we, therefore, aim to provide insight into cNfL levels in HSP and examine the influence of age and sex as well as the diagnostic performance of cNfL levels.
Subjects and Methods
Subjects
We recruited a total of 118 participants from the Department of Neurology, Hertie Institute for Clinical Brain Research, University Hospital Tübingen. The patient cohort consisted of 59 individuals with HSP as diagnosed according to established criteria. 13 In 33 patients (56%), the diagnosis of HSP was genetically confirmed. HSP type SPG5 was most common in this subgroup (n = 17), followed by SPG4 (n = 10), SPG3, SPG6, SPG11, SPG30, SPG35 and SPG46 (each n = 1). CSF samples of 14 patients with HSP type SPG5 were obtained at the baseline visit of the STOP SPG5 trial, 14 while other HSP CSF samples were acquired as part of the diagnostic workup. A cohort of 59 controls was selected to match patients in age and sex (pair matching). The control cohort comprised 23 healthy individuals that donated CSF for research purposes and 36 individuals who underwent lumbar puncture for diagnostic purposes, yet did not have any neurological deficits. Diagnoses in the latter group included primary headache disorders (n = 13), depression (n = 9), functional disorders (n = 8), restless legs syndrome (n = 3), anxiety disorder (n = 1), benign fasciculation syndrome (n = 1) and trigeminal autonomic cephalgia (n = 1). None of the mentioned conditions is known to alter cNfL levels. Controls were matched to yield an equal age distribution across patients and controls (median age in patients 45.7 years, mean 43.8, range 15.9–76.2; median age in controls 48.0, mean 46.1, range 18.2–76.3; two‐sided Mann–Whitney test, p = 0.27). The same was true for sex (male/female ratio = 1.11 in patients; male/female ratio = 1.04 in controls; two‐sided Chi‐square test, p = 0.85).
Written informed consent was obtained from participants or their legal representatives. The local ethics committee approved of the study (172/2018BO2, 199/2011BO1).
Biomaterial
CSF samples were centrifuged (10 min at room temperature and 2000g) and the supernatant was frozen at −80°C within 60 min after collection, stored in the local Biobank of the Hertie Institute for Clinical Brain Research and analyzed without previous thaw‐freeze cycles.
NfL measurements
cNfL was analyzed by conventional ELISA (UmanDiagnostics AB, Umeå, Sweden). The inter‐assay CV was below 15% for all sample concentrations. The concentrations of all samples were within the measurable range of 100–10000 pg/mL except for three samples (one patient, two controls) which fell below 100 pg/mL. These values were set to 100 pg/mL for statistical analysis and figures.
Statistical analysis
Categorical variables are described as absolute and relative frequencies; continuous variables were reported as either means (±standard deviation) or medians and interquartile range, depending on the distribution of the data. Normal distribution was evaluated by graphical methods. We used propensity score matching to build a cohort of controls matching patients in age and sex (in the mode “optimal matching,” according to Thoemmes (2012). Propensity score matching in SPSS. arXiv:1201.6385). Propensity scores were calculated from a logistic regression model using a caliper of 0.2. Non‐parametric methods were employed to analyze group effects; the two‐way Wilcoxon test was used to analyze the group effects of matched pairs, and the Mann–Whitney test to analyze subgroups (independent samples). Effect size for both tests was calculated as . As cNfL is known to increase with age in controls and many neurological disorders, 1 we sought to control for age in comparisons involving differently aged groups. We thus calculated each patient’s individual cNfL increase as the difference of cNfL concentrations in each patient and its matched control. We used this measure to compare cNfL levels between genetically confirmed and non‐confirmed patients, since their age differed significantly. Other non‐parametric comparisons between independent samples were based on original cNfL concentrations, as there were no significant differences in age between the respective groups.
To assess the influence of multiple factors on cNfL levels in patients and controls, we employed a generalized estimating equations (GEEs) model with log‐transformed cNfL concentrations to meet the assumption of normality. The GEEs model used had a gamma distribution and identity link, the independent variables in the model included sex and age. The impact of sex was analyzed by ANCOVA in the subgroups of all HSP patients and controls. We used non‐parametric procedures in the subgroups of genetically confirmed and non‐confirmed patients, as the assumptions of ANCOVA were not met in these subgroups due to smaller sample sizes. In an unplanned exploratory analysis, we compared the log differences between patients and controls (i.e., the log quotients of cNfL) in males and females. ROC analysis was used to test the performance of cNfL in differentiating patients from controls. All procedures were carried out using IBM SPSS statistics software version 25.
Results
CSF NfL levels are elevated in hereditary spastic paraplegia
Patients were found to have significantly higher cNfL concentrations with a median of 741 pg/mL (mean 919, range 100–3715) than controls with a median of 387 pg/mL (mean 397, range 100–772; two‐sided Wilcoxon test, p < 0.001, r = 0.51) (Fig. 1). This was confirmed by GEEs analysis (p < 0.001, B = 0.213). Controlling for age and sex, the GEEs model indicated cNfL levels in patients were elevated by 63% compared to controls. Levels of cNfL in controls were similar to previously published controls of the same age, emphasizing that our controls did not carry relevant neurological disorders. 8 , 15 , 16
Figure 1.
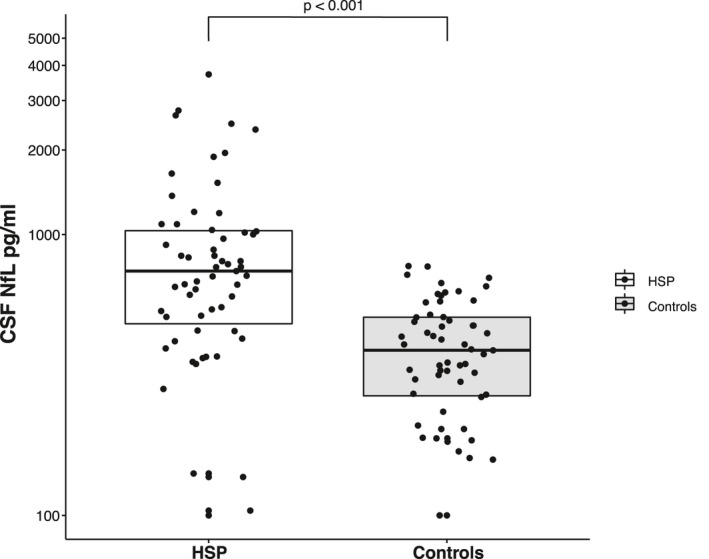
Scatter and box plot of cNfL levels in HSP patients and controls. Horizontal lines represent medians, and boxes show interquartile ranges. Note the logarithmic scale of the Y‐axis.
Our finding of significantly higher cNfL levels in HSP was maintained when analyzing genetically confirmed and non‐confirmed cases separately. In 33 genetically confirmed cases, the median cNfL level was 765 pg/mL (mean 858, range 137–2480) compared to a median of 375 pg/mL (mean 384, range 100–772) in a priori matched controls (two‐sided Wilcoxon test, p < 0.001, r = 0.54). The 26 patients diagnosed with HSP without genetic confirmation had a median cNfL concentration of 612 pg/mL (mean 998, range 100–3715), while the median in a priori matched controls was 411 pg/mL (mean 414, range 100–701; two‐sided Wilcoxon test, p = 0.004, r = 0.40). cNfL levels, as measured by patients’ individual NfL increases (see statistical analysis), did not differ significantly between genetically confirmed and non‐confirmed patients (two‐sided Mann–Whitney test, p = 0.25, r = 0.15). Taking into account median values and effect sizes, our finding of elevated cNfL levels in HSP was, therefore, not primarily driven by genetically unconfirmed cases that might comprise HSP mimics.
Age and sex influence CSF NfL levels in hereditary spastic paraplegia
To explore the association of different factors with cNfL levels in HSP patients, we performed a two‐way ANCOVA with log‐transformed cNfL levels, testing for age, sex, genetic status (confirmed vs. not confirmed), disease duration, disease severity, and their interactions. We assessed disease severity by grouping patients according to ambulation status, establishing three subgroups (free ambulation/walking aid required/loss of ambulation). Levels of cNfL by disease severity are shown in Figure 2. Employing backward selection, age, and sex were identified to be significant contributors in HSP patients and entered into the final model. The effect of age (p = 0.022, F (1, 56) = 5.579, B = 0.006, partial η 2 = 0.091) translated into an annual increase of 1.4% in cNfL levels (Fig. 3). This increase was calculated by back‐transformation of the log‐level coefficient B. In controls, the annual age‐related increase was 2.6% (two‐way ANCOVA, p < 0.001, F (1, 57) = 102.326, B = 0.011, partial η 2 = 0.642). As the rate of cNfL increase over time was different between patients and controls, we calculated the cNfL ratio of each matched pair (patient/control) to cross‐sectionally assess temporal dynamics. This ratio—expressing HSP patients’ fold increases in cNfL—significantly declined with age (Spearman’s ρ = −0.270, p = 0.04) (Fig. 4).
Figure 2.
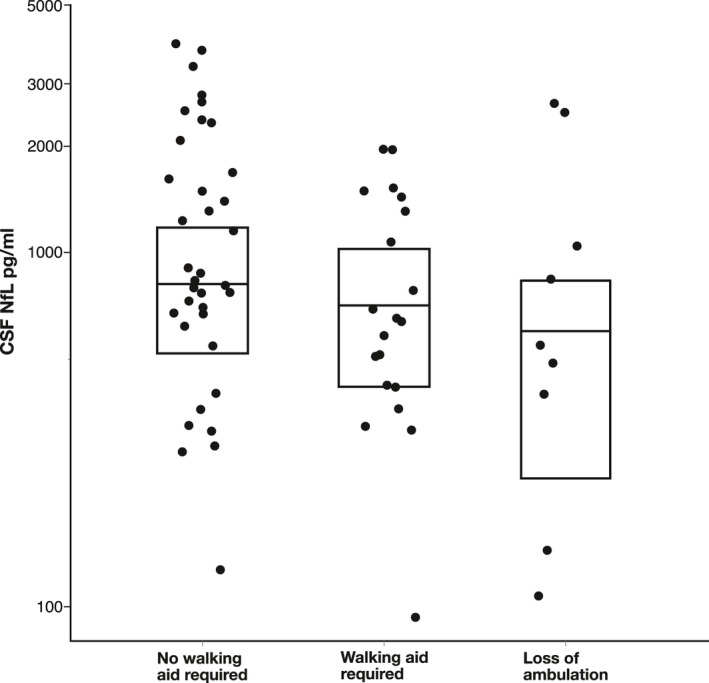
Scatter and box plot of cNfL levels by disease severity in HSP patients. Disease severity was not found to have a significant influence on cNfL levels. Horizontal lines represent medians, and boxes show interquartile ranges.
Figure 3.
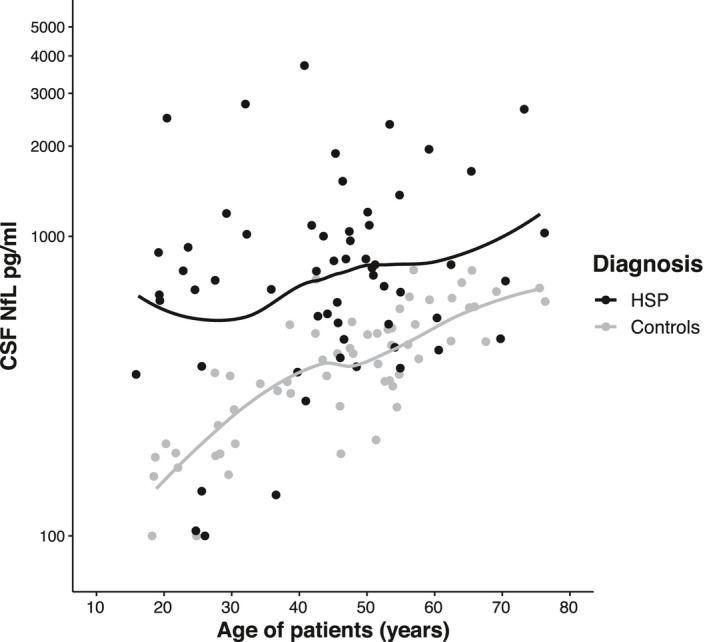
Scatter plot of cNfL levels by age in HSP patients (black dots) and controls (grey dots) with LOESS fits. Note the logarithmic scale of the Y‐axis.
Figure 4.
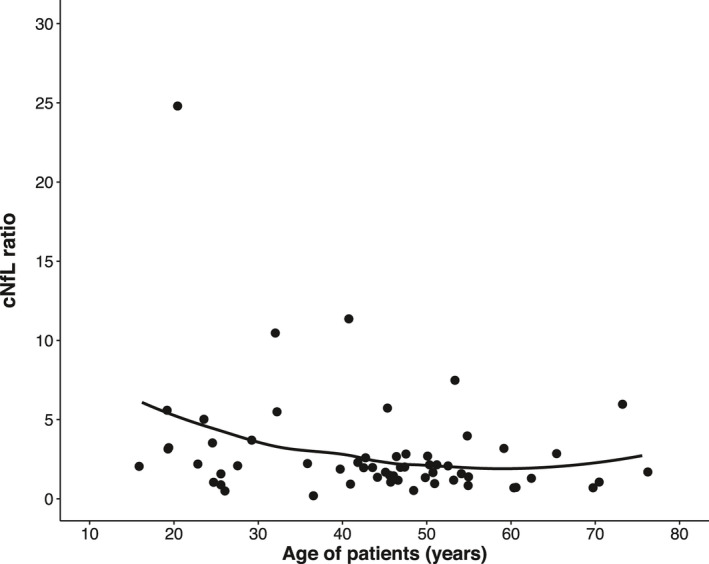
HSP patients’ individual cNfL ratios, calculated by dividing the cNfL level of each patient by the cNfL level of its matched control, with LOESS fit. Note the logarithmic scale of the Y‐axis. The maximum value (cNfL ratio = 24.8) is due to the matching of a patient with a high cNfL level to a control with the lowest cNfL level.
Remarkably, sex had a greater impact than age in HSP patients (p = 0.002, F (1, 56) = 11.13, B = 0.257, partial η 2 = 0.166); cNfL levels were elevated by 81% in males compared to females. This coincided well with actual cNfL levels in male (median 966 pg/mL, mean 1143) and female patients (median 538 pg/mL, mean 673) (Table 1, Fig. 5). This trend towards higher cNfL levels in males was visible in both genetically confirmed and non‐confirmed cases as well as in controls (Fig. 5). While reaching significance in genetically non‐confirmed patients (two‐sided Mann–Whitney Test, p = 0.024, r = 0.44), the difference, however, was not statistically significant in genetically confirmed patients (two‐sided Mann–Whitney test, p = 0.063, r = 0.32) and controls (two‐way ANCOVA, p = 0.19, F (1, 56) = 1.771, B = 0.046, partial η 2 = 0.031). Moreover, we compared the quotients of patients versus controls (individual cNfL increase, see statistical analysis) between male and female subjects and found significantly higher quotients for males as compared to females (independent t test, log scale, t (57) = 3.29, p = 0.002).
Table 1.
Median CSF NfL levels in HSP patients and controls.
| CSF NfL | All HSP patients | HSP genetically confirmed | HSP genetically not confirmed | Controls |
|---|---|---|---|---|
| Total median (p25–75) | 741 pg/mL (455–1038) | 765 pg/mL (606–984) | 612 pg/mL (366–1412) | 387 pg/mL (264–508) |
| Male median (p25–75) | 966 pg/mL (663–1373) | 828 pg/mL (663–1016) | 1283 pg/mL (596–2185) | 427 pg/mL (313–588) |
| Female median (p25–75) | 538 pg/mL (367–799) | 638 pg/mL (534–840) | 422 pg/mL (360–728) | 375 pg/mL (187–458) |
Figure 5.
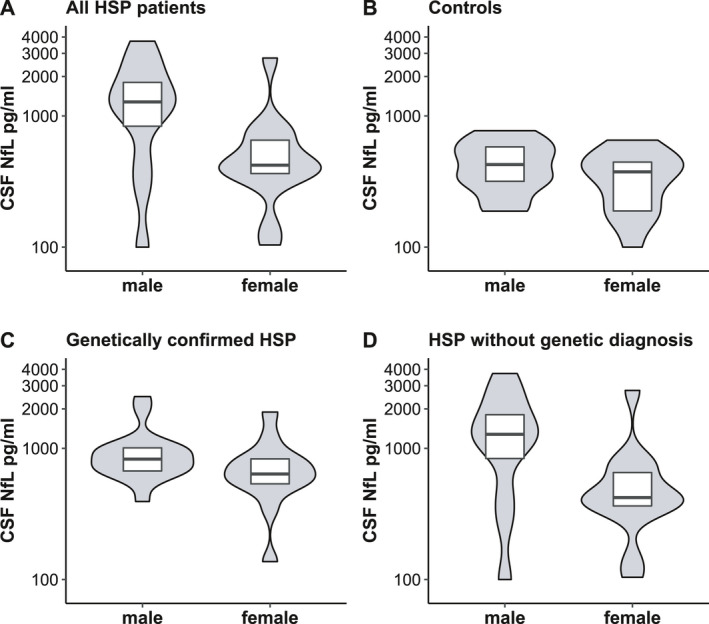
Scatter plots of cNfL levels by sex in (A) all HSP patients, (B) controls, (C) genetically confirmed HSP patients, and (D) HSP patients without genetic diagnosis. Horizontal lines represent medians, and boxes show interquartile ranges. Note the logarithmic scale of the Y‐axis.
Value of CSF NfL in differentiating patients from controls
Since cNfL was elevated in HSP patients, we went on to assess its value as a diagnostic tool. ROC analysis resulted in a good classification of patients and controls by cNfL (AUC = 0.81, 95% CI: 0.73–0.89, p < 0.001) (Fig. 6). Considering the different rates of age‐related cNfL increase in patients and controls, we divided the matched pairs of our cohort by median split according to the patient’s age. In the younger group (age ≤ 45.7 years, range 15.9–45.7), cNfL performed similarly to the analysis involving the whole cohort (AUC = 0.83, 95% CI: 0.71–0.95, p < 0.001). Its differentiating effect in older subjects (age > 45.7 years, range 46.0–76.2) was only slightly lower (AUC = 0.80, 95% CI: 0.69–0.92, p < 0.001). Since sex was identified to influence cNfL levels in patients and the cNfL quotient between patients and matched controls, we further conducted separate ROC analyses for males and females. This resulted in an improved diagnostic performance of cNfL in males (AUC = 0.87, 95% CI: 0.78–0.97, p < 0.001), while its precision in females was moderately good (AUC = 0.75, 95% CI: 0.62–0.88, p = 0.001).
Figure 6.
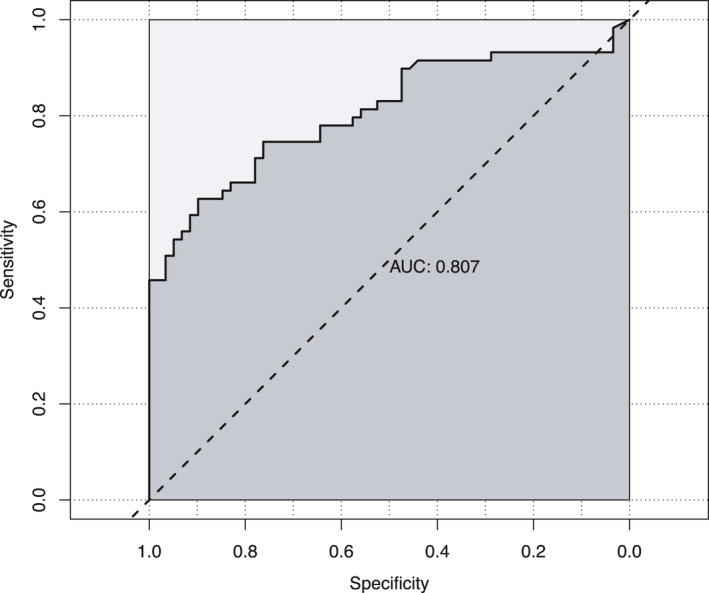
Performance of cNfL in separating HSP patients from controls (ROC analysis, AUC = 0.81, 95% CI: 0.73–0.89, p < 0.001).
DISCUSSION
With this study, we present the first comprehensive analysis of cNfL levels in HSP. Our findings show that cNfL concentrations are markedly elevated in HSP patients compared to age‐ and sex‐matched controls, establishing cNfL as a diagnostic biomarker in HSP. Importantly, the extent of cNfL increase was comparable in genetically confirmed HSP cases as well as in cases without confirmation (Table 1). This finding is clinically highly relevant, as the clinical differentiation between HSP and other motoneuron diseases can be challenging in some cases in the absence of a genetic diagnosis. The equal distribution of cNfL across genetically confirmed and non‐confirmed cases thus demonstrates that (i) our group of clinically diagnosed, genetically non‐confirmed HSP cases is unlikely to comprise other motor neuron disease mimics and (ii) emphasizes the diagnostic value of cNfL in HSP patients for which no genetic diagnosis can be obtained. Despite the good classificatory performance of cNfL in discriminating HSP patients from controls demonstrated by the ROC analysis, the interpretation of cNfL on an individual level remains challenging. While the majority of cNfL values are well separated between HSP cases and controls—as can be seen by the only minimal overlap of the interquartile ranges of cNfL levels (Table 1, Fig. 1)—there is nonetheless some overlap in the value range for some individuals. Moreover, the diagnostic performance of cNfL in discriminating HSP from “HSP mimics” like other motoneuron diseases or primary progressive multiple sclerosis remains to be demonstrated.
cNfL levels were markedly lower in HSP than in previously published studies on ALS, 1 , 10 , 15 , 17 likely reflecting the usually milder course and confinement of degeneration to upper motor neurons in HSP. Therefore, the previously established differentiation of HSP and ALS by sNfL 12 is likely to be accomplished by cNfL as well. While serum samples are easier to obtain than CSF, the analysis of sNfL is currently only available at specialized health care centers and mostly restricted to research purposes. As cNfL measurements are broadly available and well established, they remain highly relevant in clinical practice. Data on NfL in primary lateral sclerosis (PLS), a disorder also restricted to upper motor neurons with considerable clinical overlap to HSP, but a more rapid progression, are scarce. On the basis of two studies reporting cNfL levels in PLS to be considerably elevated and close to those in ALS, 10 , 17 cNfL could support the differentiation of HSP from PLS. Thus, studies directly contrasting cNfL in HSP, PLS, and other clinical differential diagnoses and controlling for age and sex are warranted to study its diagnostic performance in these phenotypically related disorders.
Remarkably, sex had a substantial effect on cNfL levels in HSP patients, with men’s levels being increased by 81%. Sex‐related differences in cNfL levels have been repeatedly reported before in neurological disorders and controls, commonly resulting in higher cNfL levels in men. 1 , 6 , 7 , 18 , 19 The magnitude of the effect we found in HSP is greater than in other neurological disorders and controls in meta‐analyzed studies, with increases in males usually ranging roughly from 10% to 40%. 1 In our study, the effect of sex seems to be partially driven by genetically non‐confirmed cases. Despite not reaching statistical significance, the tendency to higher cNfL levels in males could also be observed in genetically confirmed cases (Table 1, Fig. 5). Therefore, sex should be taken into consideration when interpreting cNfL levels in HSP, as our ROC analyses in patients versus controls suggest a better diagnostic performance in men and quotients between pairs of patients and controls were significantly larger in males as compared to females. A potential limitation of our study in general and investigations of subgroups, in particular, is the limited sample size. If possible, we, therefore, sought to evaluate our findings by additional statistical tests. In the case of sex‐related differences, both the ROC analyses and the quotients between pairs of patients and controls favor a better diagnostic performance of cNfL in men.
When analyzing the influence of age, cNfL levels in HSP patients increased by 1.4% annually. This rate is below reported values in other slowly progressive neurodegenerative diseases such as Parkinson’s disease and Alzheimer’s disease, 1 possibly reflecting the typically even slower disease course of HSP. In spite of an annual increase of 2.6% in controls and a subsequently narrowing cNfL gap between patients and controls (Fig. 3), the diagnostic performance of cNfL was preserved in older subjects. Considering higher cNfL levels at young ages and slower age‐related increase over time in HSP patients relative to controls, this course suggests a more marked increase around phenotypic conversion and comparatively static cNfL levels afterward. The relative stability of this biomarker in HSP is also emphasized by our finding that disease duration and severity do not significantly influence cNfL levels. Likely the stable cNfL levels reflect a steady state between cNfL liberation from degenerating axons on the one hand and cNfL clearance on the other hand. The higher rate of age‐related annual cNfL increase in controls compared to HSP patients may further indicate a declining number of upper motor neuron axons in HSP cases as the source of cNfL as the disease progresses. Similar temporal dynamics of sNfL have recently been described in Spinocerebellar ataxia type 3 (SCA3) 20 and Friedreich’s ataxia, 21 representing two other slowly progressive neurodegenerative disorders. The temporal dynamics of NfL over the disease course, here deduced from cohort‐based analyses, will have to be confirmed in serial measurements of NfL in HSP patients. These analyses will also clarify whether the relatively static levels of NfL after phenotypic conversion impede the use of NfL as a progression biomarker at later disease stages.
We here provide the first comprehensive analysis of cNfL levels in HSP, including a detailed analysis of factors influencing cNfL levels and an exploration of the temporal dynamics and diagnostic performance of cNfL in discriminating HSP cases from controls. This work, therefore, lays the foundation for future analysis of cNfL in other contexts of use, for example, potential application as prognostic, monitoring or therapy response biomarker.
Conflict of Interest
Dr. Schüle reports grants from the National Institute of Neurological Disorders and Stroke, grants from Bundesministerium für Bildung und Forschung (BMBF), grants from the European Union’s Horizon 2020 research and innovation program and grants from HSP Research Foundation, during the conduct of the study. Prof. Maetzler receives or received funding from the European Union, Bundesministerium für Bildung und Forschung (BMBF), Michael J. Fox Foundation, Robert Bosch Foundation, Neuroalliance, Lundbeck, and Janssen. He received speaker honoraria from Abbvie, Bayer, GlaxoSmithKline, Licher MT, Rölke Pharma, and UCB, was invited to Advisory Boards of Abbvie, Biogen, Lundbeck, and Market Access & Pricing Strategy GmbH, and is an advisory board member of the Critical Path for Parkinson's Consortium. He serves as the co‐chair of the MDS Technology Task Force. All other authors have nothing to disclose.
Author Contributions
CK: Design and conceptualization of the study, acquisition of data (patient recruitment, patient assessment, CSF sampling), analysis of data, drafting and revision of the manuscript. LMSH: Analysis of data, revision of the manuscript. TWR: Acquisition of data (patient recruitment, patient assessment, CSF sampling), revision of the manuscript. WM: Acquisition of data (patient recruitment, patient assessment, CSF sampling), revision of the manuscript. IW: Acquisition of data (patient recruitment, patient assessment, CSF sampling), revision of the manuscript. SH: Acquisition of data (patient recruitment, patient assessment, CSF sampling), revision of the manuscript. CW: Acquisition of data (patient recruitment, patient assessment, CSF sampling), revision of the manuscript. HH: Acquisition of data (patient recruitment, patient assessment, CSF sampling), revision of the manuscript. JR: NfL measurements, revision of the manuscript. MA: NfL measurements, revision of the manuscript. LS: Design and conceptualization of the study, acquisition of data (patient recruitment, patient assessment), revision of the manuscript. PM: Analysis of data, revision of the manuscript. RS: Design and conceptualization of the study, acquisition of data (patient recruitment, patient assessment), drafting and revision of the manuscript.
Acknowledgment
Biosamples were obtained from the Neuro‐Biobank of the University of Tübingen, Germany, which is supported by the University of Tübingen, the Hertie Institute for Clinical Brain Research (HIH), and the German Center for Neurodegenerative Diseases (DZNE).
Research reported in this publication was supported by the National Institute of Neurological Disorders and Stroke and the National Institutes of Health under Award Number 5R01NS072248 (RS) and through a pilot grant from the CReATe consortium. The CReATe consortium (U54NS092091) is part of the Rare Diseases Clinical Research Network (RDCRN), an initiative of the Office of Rare Diseases Research (ORDR), NCATS. This consortium is funded through a collaboration between NCATS and the NINDS.
This work was further supported by the Bundesministerium für Forschung und Bildung (BMBF) through funding for the TreatHSP network (01GM1905 to RS), the European Union’s Horizon 2020 research and innovation program under grant agreement No 779257 for the Solve‐RD project (RS), and the HSP Research Foundation (RS).
Several authors of this publication are the member(s) of the European Reference Network for Rare Neurological Diseases ‐ Project ID No 739510 (RS, LS, HH).
TWR was supported by the Clinician Scientist program (Grant #386‐0‐0), University of Tübingen, Medical Faculty.
CW was supported by the National Ataxia Foundation and the Wilhelm Vaillant Stiftung.
HH was supported by the fortüne program (Grant #2554‐0‐0), University of Tübingen, Medical Faculty.
We thank Elke Stransky for excellent technical assistance. Open access funding enabled and organized by ProjektDEAL.
Funding Information
Biosamples were obtained from the Neuro‐Biobank of the University of Tübingen, Germany, which is supported by the University of Tübingen, the Hertie Institute for Clinical Brain Research (HIH), and the German Center for Neurodegenerative Diseases (DZNE).
Research reported in this publication was supported by the National Institute of Neurological Disorders and Stroke and the National Institutes of Health under Award Number 5R01NS072248 (RS) and through a pilot grant from the CReATe consortium. The CReATe consortium (U54NS092091) is part of the Rare Diseases Clinical Research Network (RDCRN), an initiative of the Office of Rare Diseases Research (ORDR), NCATS. This consortium is funded through a collaboration between NCATS and the NINDS.
This work was further supported by the Bundesministerium für Bildung und Forschung (BMBF) through funding for the TreatHSP network (01GM1905 to RS and LS), the European Union’s Horizon 2020 research and innovation program under grant agreement No 779257 for the Solve‐RD project (RS), and the HSP Research Foundation (RS).
Several authors of this publication are the member(s) of the European Reference Network for Rare Neurological Diseases ‐ Project ID No 739510 (RS, LS, HH).
TWR was supported by the Clinician Scientist program (Grant #386‐0‐0), University of Tübingen, Medical Faculty.
CW was supported by the National Ataxia Foundation and the Wilhelm Vaillant Stiftung.
HH was supported by the fortüne program (Grant #2554‐0‐0), University of Tübingen, Medical Faculty.
Funding Statement
This work was funded by Neuro‐Biobank grant ; University of Tübingen grant ; Hertie Institute for Clinical Brain Research grant ; German Center for Neurodegenerative Diseases grant ; National Institute of Neurological Disorders and Stroke grant ; National Institutes of Health grant 5R01NS072248; CReATe consortium grant U54NS092091; Rare Diseases Clinical Research Network grant ; Office of Rare Diseases Research grant ; NCATS grant ; Bundesministerium für Forschung und Bildung grant ; TreatHSP grant 01GM1905; European Union’s Horizon 2020 grant 779257; Solve‐RD project grant ; HSP Research Foundation grant ; European Reference Network for Rare Neurological Diseases grant 739510; Clinician Scientist program grant #386‐0‐0; National Ataxia Foundation grant ; Wilhelm Vaillant Stiftung grant ; fortüne program grant #2554‐0‐0.
References
- 1. Bridel C, van Wieringen WN, Zetterberg H, et al. Diagnostic value of cerebrospinal fluid neurofilament light protein in neurology: a systematic review and meta‐analysis. JAMA Neurol 2019;76:1035–1048. [DOI] [PMC free article] [PubMed] [Google Scholar]
- 2. Gaetani L, Blennow K, Calabresi P, et al. Neurofilament light chain as a biomarker in neurological disorders. J Neurol Neurosurg Psychiatry 2019;90:870–881. [DOI] [PubMed] [Google Scholar]
- 3. Menke RA, Gray E, Lu CH, et al. CSF neurofilament light chain reflects corticospinal tract degeneration in ALS. Ann Clin Transl Neurol 2015;2:748–755. [DOI] [PMC free article] [PubMed] [Google Scholar]
- 4. Petzold A. Neurofilament phosphoforms: surrogate markers for axonal injury, degeneration and loss. J Neurol Sci 2005;233:183–198. [DOI] [PubMed] [Google Scholar]
- 5. Vågberg M, Norgren N, Dring A, et al. Levels and age dependency of neurofilament light and glial fibrillary acidic protein in healthy individuals and their relation to the brain parenchymal fraction. PLoS One 2015;10:e0135886. [DOI] [PMC free article] [PubMed] [Google Scholar]
- 6. Mielke MM, Syrjanen JA, Blennow K, et al. Comparison of variables associated with cerebrospinal fluid neurofilament, total‐tau, and neurogranin. Alzheimers Dement 2019;15:1437–1447. [DOI] [PMC free article] [PubMed] [Google Scholar]
- 7. Mielke MM. Consideration of sex differences in the measurement and interpretation of Alzheimer disease‐related biofluid‐based biomarkers. J Appl Lab Med 2020;5:158–169. [DOI] [PMC free article] [PubMed] [Google Scholar]
- 8. Lu C‐H, Macdonald‐Wallis C, Gray E, et al. Neurofilament light chain: a prognostic biomarker in amyotrophic lateral sclerosis. Neurology 2015;84:2247–2257. [DOI] [PMC free article] [PubMed] [Google Scholar]
- 9. Rossi D, Volanti P, Brambilla L, et al. CSF neurofilament proteins as diagnostic and prognostic biomarkers for amyotrophic lateral sclerosis. J Neurol 2018;265:510–521. [DOI] [PubMed] [Google Scholar]
- 10. Steinacker P, Feneberg E, Weishaupt J, et al. Neurofilaments in the diagnosis of motoneuron diseases: a prospective study on 455 patients. J Neurol Neurosurg Psychiatry 2016;87:12–20. [DOI] [PubMed] [Google Scholar]
- 11. Andréasson M, Lagerstedt‐Robinson K, Samuelsson K, et al. Altered CSF levels of monoamines in hereditary spastic paraparesis 10: a case series. Neurol Genet 2019;5:e344. [DOI] [PMC free article] [PubMed] [Google Scholar]
- 12. Wilke C, Rattay TW, Hengel H, et al. Serum neurofilament light chain is increased in hereditary spastic paraplegias. Ann Clin Transl Neurol 2018;5:876–882. [DOI] [PMC free article] [PubMed] [Google Scholar]
- 13. Schule R, Holland‐Letz T, Klimpe S, et al. The Spastic Paraplegia Rating Scale (SPRS): a reliable and valid measure of disease severity. Neurology 2006;67:430–434. [DOI] [PubMed] [Google Scholar]
- 14. Schöls L, Rattay TW, Martus P, et al. Hereditary spastic paraplegia type 5: natural history, biomarkers and a randomized controlled trial. Brain 2017;140:3112–3127. [DOI] [PMC free article] [PubMed] [Google Scholar]
- 15. Gaiottino J, Norgren N, Dobson R, et al. Increased neurofilament light chain blood levels in neurodegenerative neurological diseases. PLoS One 2013;8:e75091. [DOI] [PMC free article] [PubMed] [Google Scholar]
- 16. Benatar M, Wuu J, Andersen PM, et al. Neurofilament light: a candidate biomarker of presymptomatic amyotrophic lateral sclerosis and phenoconversion. Ann Neurol 2018;84:130–139. [DOI] [PMC free article] [PubMed] [Google Scholar]
- 17. Feneberg E, Oeckl P, Steinacker P, et al. Multicenter evaluation of neurofilaments in early symptom onset amyotrophic lateral sclerosis. Neurology 2018;90:e22–e30. [DOI] [PubMed] [Google Scholar]
- 18. Gaetani L, Höglund K, Parnetti L, et al. A new enzyme‐linked immunosorbent assay for neurofilament light in cerebrospinal fluid: analytical validation and clinical evaluation. Alzheimer's Res Ther 2018;10:8. [DOI] [PMC free article] [PubMed] [Google Scholar]
- 19. Mattsson N, Insel PS, Palmqvist S, et al. Cerebrospinal fluid tau, neurogranin, and neurofilament light in Alzheimer's disease. EMBO Mol Med 2016;8:1184–1196. [DOI] [PMC free article] [PubMed] [Google Scholar]
- 20. Wilke C, Haas E, Reetz K, et al. Neurofilaments in spinocerebellar ataxia type 3: blood biomarkers at the preataxic and ataxic stage in humans and mice. EMBO Mol Med 2020;12:e11803. [DOI] [PMC free article] [PubMed] [Google Scholar]
- 21. Hayer SN, Liepelt I, Barro C, et al. NfL and pNfH are increased in Friedreich's ataxia. J Neurol 2020;267:1420–1430. [DOI] [PMC free article] [PubMed] [Google Scholar]


