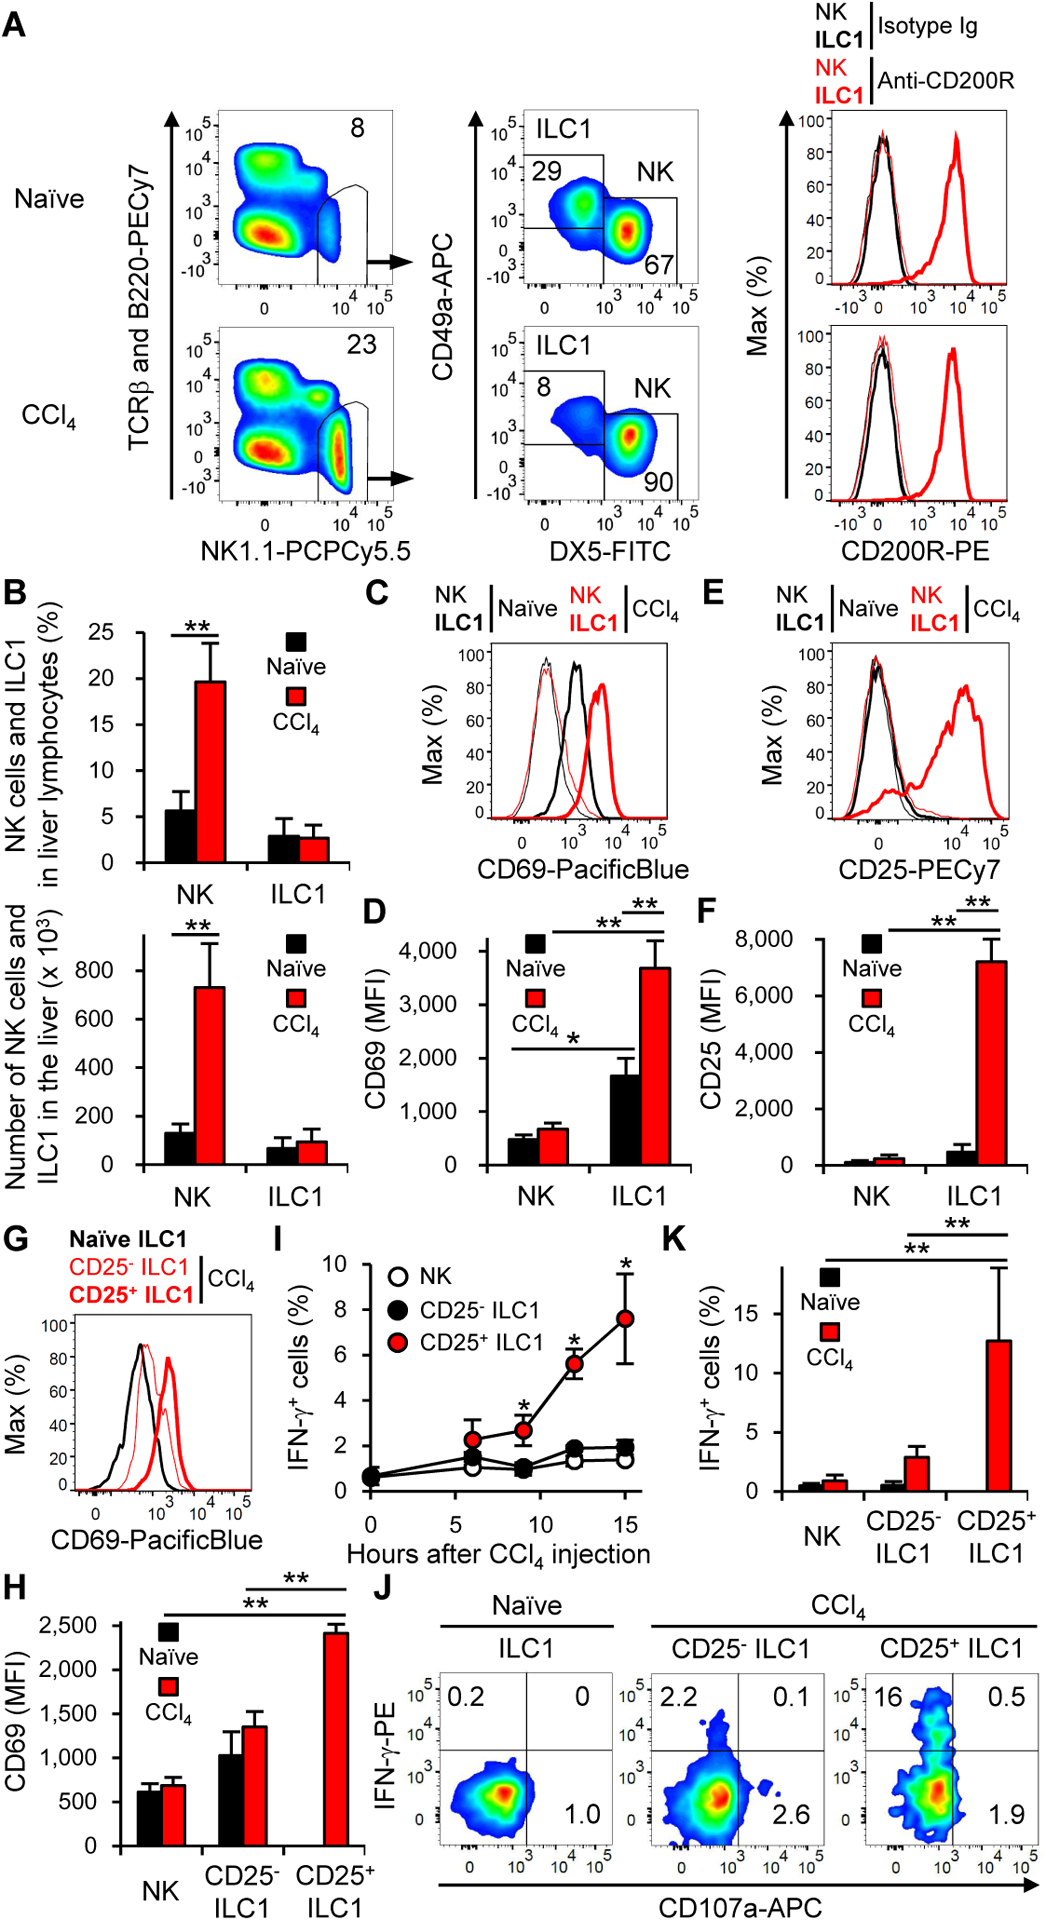
Figure 1. Liver ILC1 but not NK cells are activated and produce IFN-γ after CCl4 injection.

(A) Gating strategy and expression of CD200R for NK cells and ILC1 from the liver of mice before (naïve) and 18 h after CCl4 injection (n = 2–5 for gating strategy and n = 3–4 for CD200R). (B) The percentages and the number of NK cells and ILC1 in the liver before (naïve) and 18 h after CCl4 injection. Data were pooled from 6 experiments (n = 5–14). (C) Expression of CD69 on NK cells and ILC1 in the liver before and 18 h after CCl4 injection (n = 2–5). (D) Mean fluorescence intensity (MFI) of CD69 on NK cells and ILC1 in the liver before and 18 h after CCl4 injection. Data were pooled from 4 experiments (n = 4–14). (E) Expression of CD25 on NK cells and ILC1 in the liver before and 18 h after CCl4 injection (n = 2–5). (F) MFI of CD25 on NK cells and ILC1 in the liver before and 18 h after CCl4 injection. Data were pooled from 2 experiments (n = 4). (G) Expression of CD69 on ILC1 in the liver of mice before CCl4 injection and on CD25− ILC1 and CD25+ ILC1 in the liver 15 h after CCl4 injection (n = 2–5). (H) MFI of CD69 on NK cells and ILC1 in the liver of mice before CCl4 injection and on NK cells, CD25− ILC1, and CD25+ ILC1 in the liver 15 h after CCl4 injection. Data were pooled from 3 experiments (n = 9–13). (I) Kinetics of the percentages of IFN-γ+ cells in NK cells, CD25− ILC1, and CD25+ ILC1 in the liver after CCl4 injection (n = 4). *p<0.05 vs. NK cells and CD25− ILC1. (J) The percentages of IFN-γ+ cells in ILC1 in the liver before CCl4 injection and those in CD25− ILC1 and CD25+ ILC1 in the liver 15 h after CCl4 injection (n = 2–5). (K) The percentages of IFN-γ+ cells in NK cells and ILC1 in the liver before CCl4 injection and those in NK cells, CD25− ILC1, and CD25+ ILC1 in the liver 15 h after CCl4 injection. Data were pooled from 3 experiments (n = 9–13). Data are representative of more than 20 (A, C, and E), 3 (G and J), and 2 (I, and A (CD200R)) independent experiments. **p<0.005. Error bars show s.d. See also Figures S1 and S2.
