

Abstract
Innovative analytical frameworks are required to capture the complex gene-environment interactions. We investigate the insufficiency of commonly used models for disease genome analysis and suggest considering genetic interactions in complex diseases. For non-genetic factors, we study the emerging wearable technologies that have enabled quantification of physiological and environmental factors at an unprecedented breadth and depth. We propose a Bayesian framework to hierarchically model personalized gene-environmental interaction to enable precision health and medicine.
For decades, a linear equation, P = G+E, has been used to model the genetic (G) and environmental (E) contribution to phenotypic traits (P), assuming their independent contribution toward a given phenotype. Additive genetics, that is the aggregated contribution from multiple independent individual loci, is typically used to characterize the genetic contribution. As such, the term “heritability” (the narrow-sense heritability, unless otherwise indicated in this Commentary) is defined by the fraction of phenotypic variance explained by genetic variance, and the remaining unexplained fraction is likely attributed to non-genetic factors. Despite the wide use of these linear additive models to study gene-environment interaction, puzzles have started to emerge from recent analyses of large-scale disease genomes. For instance, for many diseases with a strong genetic underpinning, the classical association frameworks usually cannot identify significant signals, leading to the concept of “missing heritability” (Manolio et al., 2009). Misinterpreting the genetic contribution will lead to an erroneous attribution of disease etiologies to non-genetic origins (and vice versa), significantly affecting management of disease risk and crafting of health policy.
The source of the missing heritability has largely remained unidentified, and it has been unclear whether these linear models can indeed capture the intrinsic complexity of complex diseases involving hundreds or thousands of at-risk loci. On the environmental side, epidemiological studies routinely conduct participant interviews or analyze administered health records; however, considering the vast diversity of individuals’ lifestyles, behaviors, physiologies, and exposomes, it remains unclear how the risk estimates at a population level can be applied to personalized health management, especially when individuals have diverse genetic predispositions to a given disease. Therefore, technological advancement is needed to acquire and assemble these non-genetic data at a personal resolution, which, integrated with personal genomic data, will ultimately lead to precision health management. Here, we investigate the current bottlenecks in modeling gene-environment interactions and provide perspectives on shifting our current research paradigm toward an improved understanding of complex human diseases and gene-environment interactions.
Disease Genomics: Identifying the Origin of Missing Heritability
The long-standing question in today’s disease genome analysis is the missing heritability, where the genetic component of complex diseases cannot be effectively captured by existing approaches assuming locus independence and additive genetics. Even for those genetic loci successfully identified, their effect size is typically low. For example, studying 130,664 major depressive disorder cases and 330,470 controls identified 44 significant loci, but none had risk allele odds ratio above 1.05 (Wray et al., 2018). This observation has led to different speculations on the nature of complex diseases: it is unclear whether disease etiologies come from rare variants with strong effect sizes or common variants with weak effect sizes. If the observed weak effect sizes are true, current models suggest a pervasive involvement of loci across the entire genome in complex diseases, each with a subtle effect but their aggregation explains the majority of the phenotypic variance (Boyle et al., 2017). It is also possible that, given the obvious complexity of biological systems, the missing heritability could result from model insufficiency, where our existing statistical models cannot best fit the genomic data, losing insights into the intrinsic complexity of disease etiologies. In this scenario, innovative analytical methodologies are needed. Given the extensive discussion in the literature on the role of common and rare variants underlying disease etiologies, we herein ask whether the widely used linear model assuming additive genetics is sufficient to capture disease heritability.
We designed a simulation study for this purpose. We deterministically generated genotype-phenotype mapping, thus setting the true heritability to be 1 (no contribution from non-genetic factors), and then examined how much heritability could be practically estimated using our existing statistical method, varying the genotype-phenotype mapping function from linearity to a high level of non-linearity. We used a deep neural network to create the genotype-phenotype map, in which the non-linearity of the mapping can be fully controlled (Figure 1A, described below).
Figure 1. Frameworks for Disease Genome Analysis.
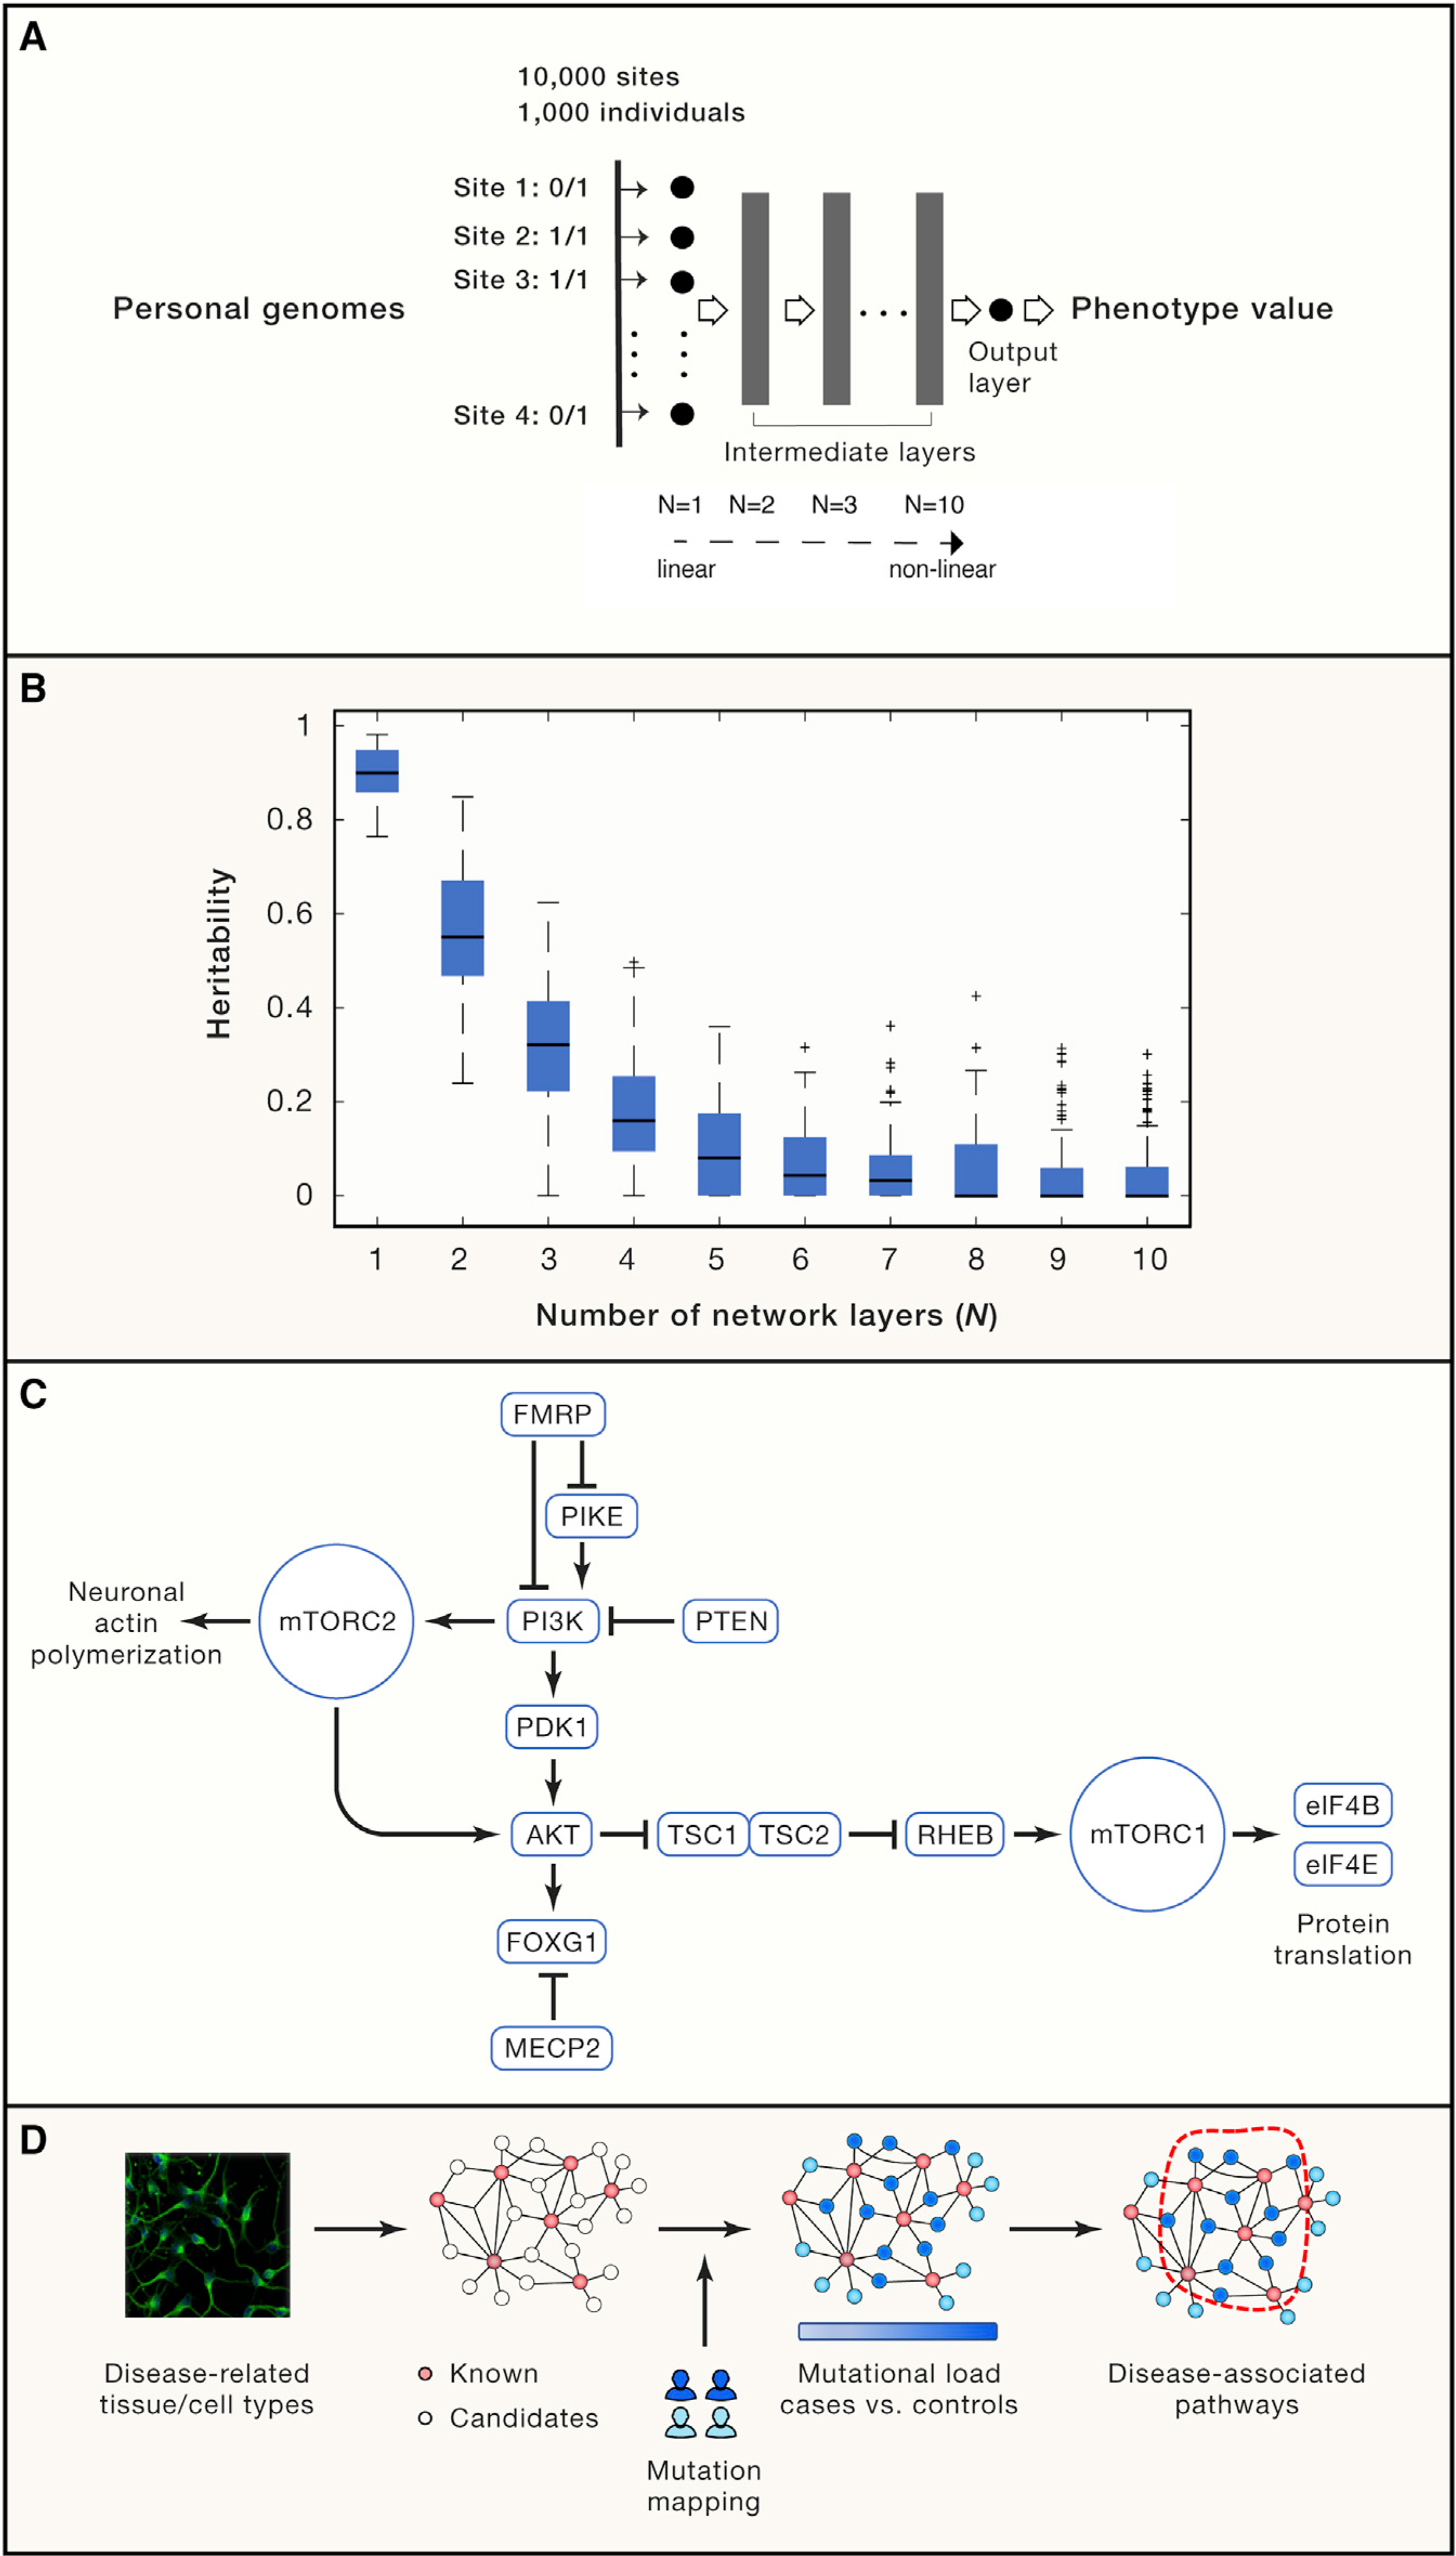
(A) A simulation study for identifying the potential source of missing heritability employing a deep neural network. 10,000 polymorphic sites from 1,000 individuals were randomly extracted from a published GWAS (Hong et al., 2017), which were then fed into a pre-configured (with a fixed weight on each edge) deep neural network with varying layers (from N = 1 to N = 10) to model the genotype-phenotype mapping. In particular, N = 1 is a linear regression model taking genotype input across all polymorphic sites (only the input layer and no intermediate layer), and their linear combination generates the output of a phenotype value, thereby representing the conventional additive genetic model. When multiple intermediate layers are involved (N > 1), the aggregated signal will be non-linearly transformed multiple times, as such N = 10 is a deep neural network representing a highly non-linear mapping from genotypes to a phenotypic trait. The network output is the phenotype value for each person that is deterministically derived from one’s genotypes after deep neural network transformation. We configured 5,000 nodes in each intermediate layer with a Sigmoid transfer function. For each N, the simulation was replicated for 100 times by setting network weights based on a standard normal distribution.
Details about the simulation experiment. We input the genotypes of each individual into a feedforward neural network defined as:
f1 = σ(W1x + b1)(i)
f2 = σ(W2f1 + b2)(ii)
...
fi = σ(Wifi−1 + bi)(iii)
...
fN−1 = σ(WN−1fN−2 + bN−1)(iv)
y = WNfN−1 + bN(v)
Where N>1 in Equations (i-v), and fi is the output from the i-th layer of the network. When N=1, the above equations degenerate to y = W1x + b.
Note that x∈R10000 is the genotype vector; σ is the sigmoid function; Wi and bi (i = 1, …, N) are the weight matrix and bias term for each layer, respectively. Specifically, we defined W1∈R5000×10000 for the input layer, WN∈R1×5000 for the output layer and Wi∈R5000×5000 for the intermediate layers. In the simulation experiment, we varied the number of layers from N = 1 to N = 10 to incrementally increase model complexity, i.e., the degree of non-linearity. For each N, we replicated the simulation 100 times. For each time, we kept the network structure unchanged and only configured a new set of weights and the bias term by sampling from a standard normal distribution independently, i.e., .
(B) The missed heritability is proportional to systems complexity using the commonly used linear mixture model (implemented by the GCTA toolkit).
(C) An example of the PI3K/AKT/mTOR pathway, where most its member proteins are associated with neurodevelopmental diseases.
(D) A systems biology strategy using multi-omics data to identify pathways significantly affected by disease-associated pathways. Biological pathways are first constructed using multi-omics profiling techniques in disease-related tissue/cell types, seeded with known disease-associated genes. Genomic mutations were then mapped onto the experimentally derived network to identify a compact sub-network most enriched for patient-specific mutations, which reveals disease-associated pathways.
We randomly sampled genotypes of 10,000 polymorphic sites from 1,000 individuals (Data S1) from a published GWAS cohort (Hong et al., 2017). For each individual, we then fed the person’s genotypes into a deep neural network with a pre-configured weight on each edge, and the network served as a mapping function to deterministically derive a continuous phenotype value from the input genotypes (Figure 1A). We varied the number of layers of the neural network from N = 1 to N = 10. In this experimental design, the complexity of the genotype-phenotype mapping function is controlled, proportional with the number of the intermediate layers.
Given the true heritability at 1, we asked how much heritability would be missed if we follow the common practice of using a linear additive model to study systems with varying complexities. For each N (N = 1 to 10), we then employed the widely used tool GCTA (genome-wide complex trait analysis) to estimate heritability, which fits phenotype and genotype data in a mixed linear model. As expected, at N = 1 (a linear model, no intermediate layer), the estimated heritability was 0.90 ± 0.05, close to the targeted value of 1. However, at N = 2 (one intermediate non-linear layer), the estimated heritability sharply decreased to 0.56 ± 0.13 (Figure 1B), and thus a moderate departure from linearity (N = 1) resulted in a significant loss of heritability almost by half. More strikingly, at N = 10 (a deep neural network achieving highly non-linear mapping), the estimated heritability was close to zero (Figure 1B), hallmarking an almost complete loss of heritability. Therefore, the degree of missing heritability is proportional to the complexity of genotype-phenotype mapping (Figure 1B). In other words, the current practice based on linear models and additive genetics is appropriate for diseases with a linear genotype-phenotype mapping but is over-simplified if disease etiologies are complex and non-linear, namely involving extensive interactions among genetic components.
Modeling Genetic Interactions in Complex Human Diseases
The non-linear behavior is a characteristic feature of complex systems, where the output of a system is not proportional to a linear aggregation of the input. This is best exemplified by epistatic interactions between genes, such as the identified 222,784 gene pairs displaying strong dependencies between each other, manifested by aggravating and alleviating interactions in human cells (Horlbeck et al., 2018). In the same vein, duplicate genes could also provide backup capacity against a loss of their paralogous copies (Hsiao and Vitkup, 2008). As such, it is more reasonable to understand mutational consequences at a systems level rather than in individual genes. To place this concept in a context of disease etiologies, we consider the PI3K/AKT/mTOR pathway (Figure 1C), which is essential for synaptic plasticity and neuron growth (Borrie et al., 2017). Nearly every one of its member proteins has been associated with or causal for neurodevelopmental disorders, including PTEN (macrocephaly/autism syndrome), RHEB (intellectual disability), eIF4B/eIF4E (autism), and the TSC1-TSC2 protein complex (tuberous sclerosis), and the pathway is also connected with the snydromic factors FMRP (fragile X syndrome) and MECP2 (Rett syndrome). Using the conventional linear model, variants in these genes would be considered mutational heterogeneity, posing a significant challenge to disease gene mapping in a typical association study and thus leading to missing heritability. However, viewed from the cellular map, these heterogeneous mutations in fact converge onto a common set of pathways, which potentially could explain nearly half of patients with neurodevelopmental disorders in a recent study (Yeung et al., 2017). Therefore, to address the intrinsic complexities in human diseases, the interacting components in a biological system must be considered.
To improve the existing model, we herein propose two complementary strategies from a systems perspective. The first strategy (Figure 1D) is to leverage multi-omic approaches to re-construct a reference cellular map, which can be a protein interaction network or gene co-expression network seeded with known disease-associated genes. We can then map genomic mutations onto the cellular map and perform graph search algorithms to identify sub-networks most affected by patient-specific mutations (particularly the rare variants), thus identifying disease-associated genetic components. This strategy has been successfully applied to studying neurodevelopmental diseases (Gilman et al., 2011). The second strategy is a data-driven framework powered by machine learning approaches. The underlying assumption is that there exists a minimal set of genes whose mutation patterns best distinguish cases from controls. Therefore, one can first identify deleterious mutations, and then aggregate them in each gene. A sparse learning algorithm is then performed to select the subset of genes whose mutation burden separates cases from controls. Mapping these selected genes onto the human protein interaction network immediately reveals the affected pathways in a disease. This strategy was successfully applied to find genetic components associated with abdominal aortic aneurysm (Li et al., 2018) and can be extended to studying many other complex diseases.
Taken together, the linear model for narrow-sense heritability and statistical associations is insufficient to study complex human diseases, if the underlying genotype-phenotype mapping is non-linear as expected for pathway and modular complex systems. Although genetic interactions are considered in the broad-sense heritability, numerous interacting components in a complex biological system cannot be statistically derived from available data (the reason broad-sense heritability has not been extensively studied). Therefore, for diseases with substantial complexity, we suggest borrowing strength from multi-omics profiling experiments and machine learning algorithms to reveal the underlying genetic component.
Leveraging Emerging Technologies to Reveal the Non-genetic Basis of Complex Disease
The interplay between genetic and non-genetic factors (such as lifestyles and environmental exposures) gives rise to disease phenotypes. However, compared with genetic analysis, analyzing the non-genetic basis is more challenging simply because of the vast diversity of each person’s lifestyle, behavior and environmental exposure. The conventional investigation of environmental contribution to human diseases has been primarily based on studying participant interviews or analyzing administered clinical records. These epidemiological studies are often performed at a population level (e.g., risk odds ratios), and cannot be immediately translated to personal health management. More importantly, by examining participant interviews or clinical records, one can only investigate a limited number of elements on record, and these epidemiological data are often highly sparse, collected at discrete time points (during the interview or clinical visits), losing insights into disease progression across different stages, from latency, onset to recovery.
Technologies have evolved rapidly in recent years, conferring unprecedented power to study the non-genetic basis of human diseases. Specifically, for the analysis of electronic health records (EHRs), recent advancement in computational capacity (e.g., graphics processing unit and cloud computing) and algorithm development (e.g., deep learning) has now enabled the development of a highly scalable representation system to unify EHRs from various medical centers, followed by constructing deep learning models to predict individuals’ clinical outcomes (for instance, in-hospital mortality rate and unplanned readmission) (Rajkomar et al., 2018). This practice is in contrast with conventional EHR analysis at the population level for risk odds ratio estimation, thereby bridging population health and personalized medicine, which, in conventional thinking, are two opposite directions.
However, EHR data are static and only document observations from discrete clinical visits, thus losing insights into personal physiological and behavioral dynamics in real time. The emerging wearable biosensor technologies represent the next-generation solution to meet this demand (Li et al., 2017). Devices, such as smart watches, smart rings, EEG headbands, smart clothes, and even environmental exposure monitors (Jiang et al., 2018) are small electronic devices developed to be comfortably worn on or loosely attached to human body to track various physiological and environmental parameters in real-time (Figure 2A). Compared to medical instruments, wearable devices are more accessible by the general population. Though initially developed as fitness trackers, wearable devices are now being repurposed for health management. The rapid growth of wearable technology enables continuous measurement of a wide range of clinical biometrics, including heart rate, heart rate variability, skin temperature, blood oxygen level, respiration rate, glucose level, exposed microorganisms (Hall et al., 2018; Jiang et al., 2018; Li et al., 2017). Real-time monitoring of these parameters, detecting abnormal signs, and predicting upcoming risk events may significantly revolutionize clinical practice and improve health management at a personal level.
Figure 2. Wearable Sensors for Health Management and Physiological Data Acquisition.
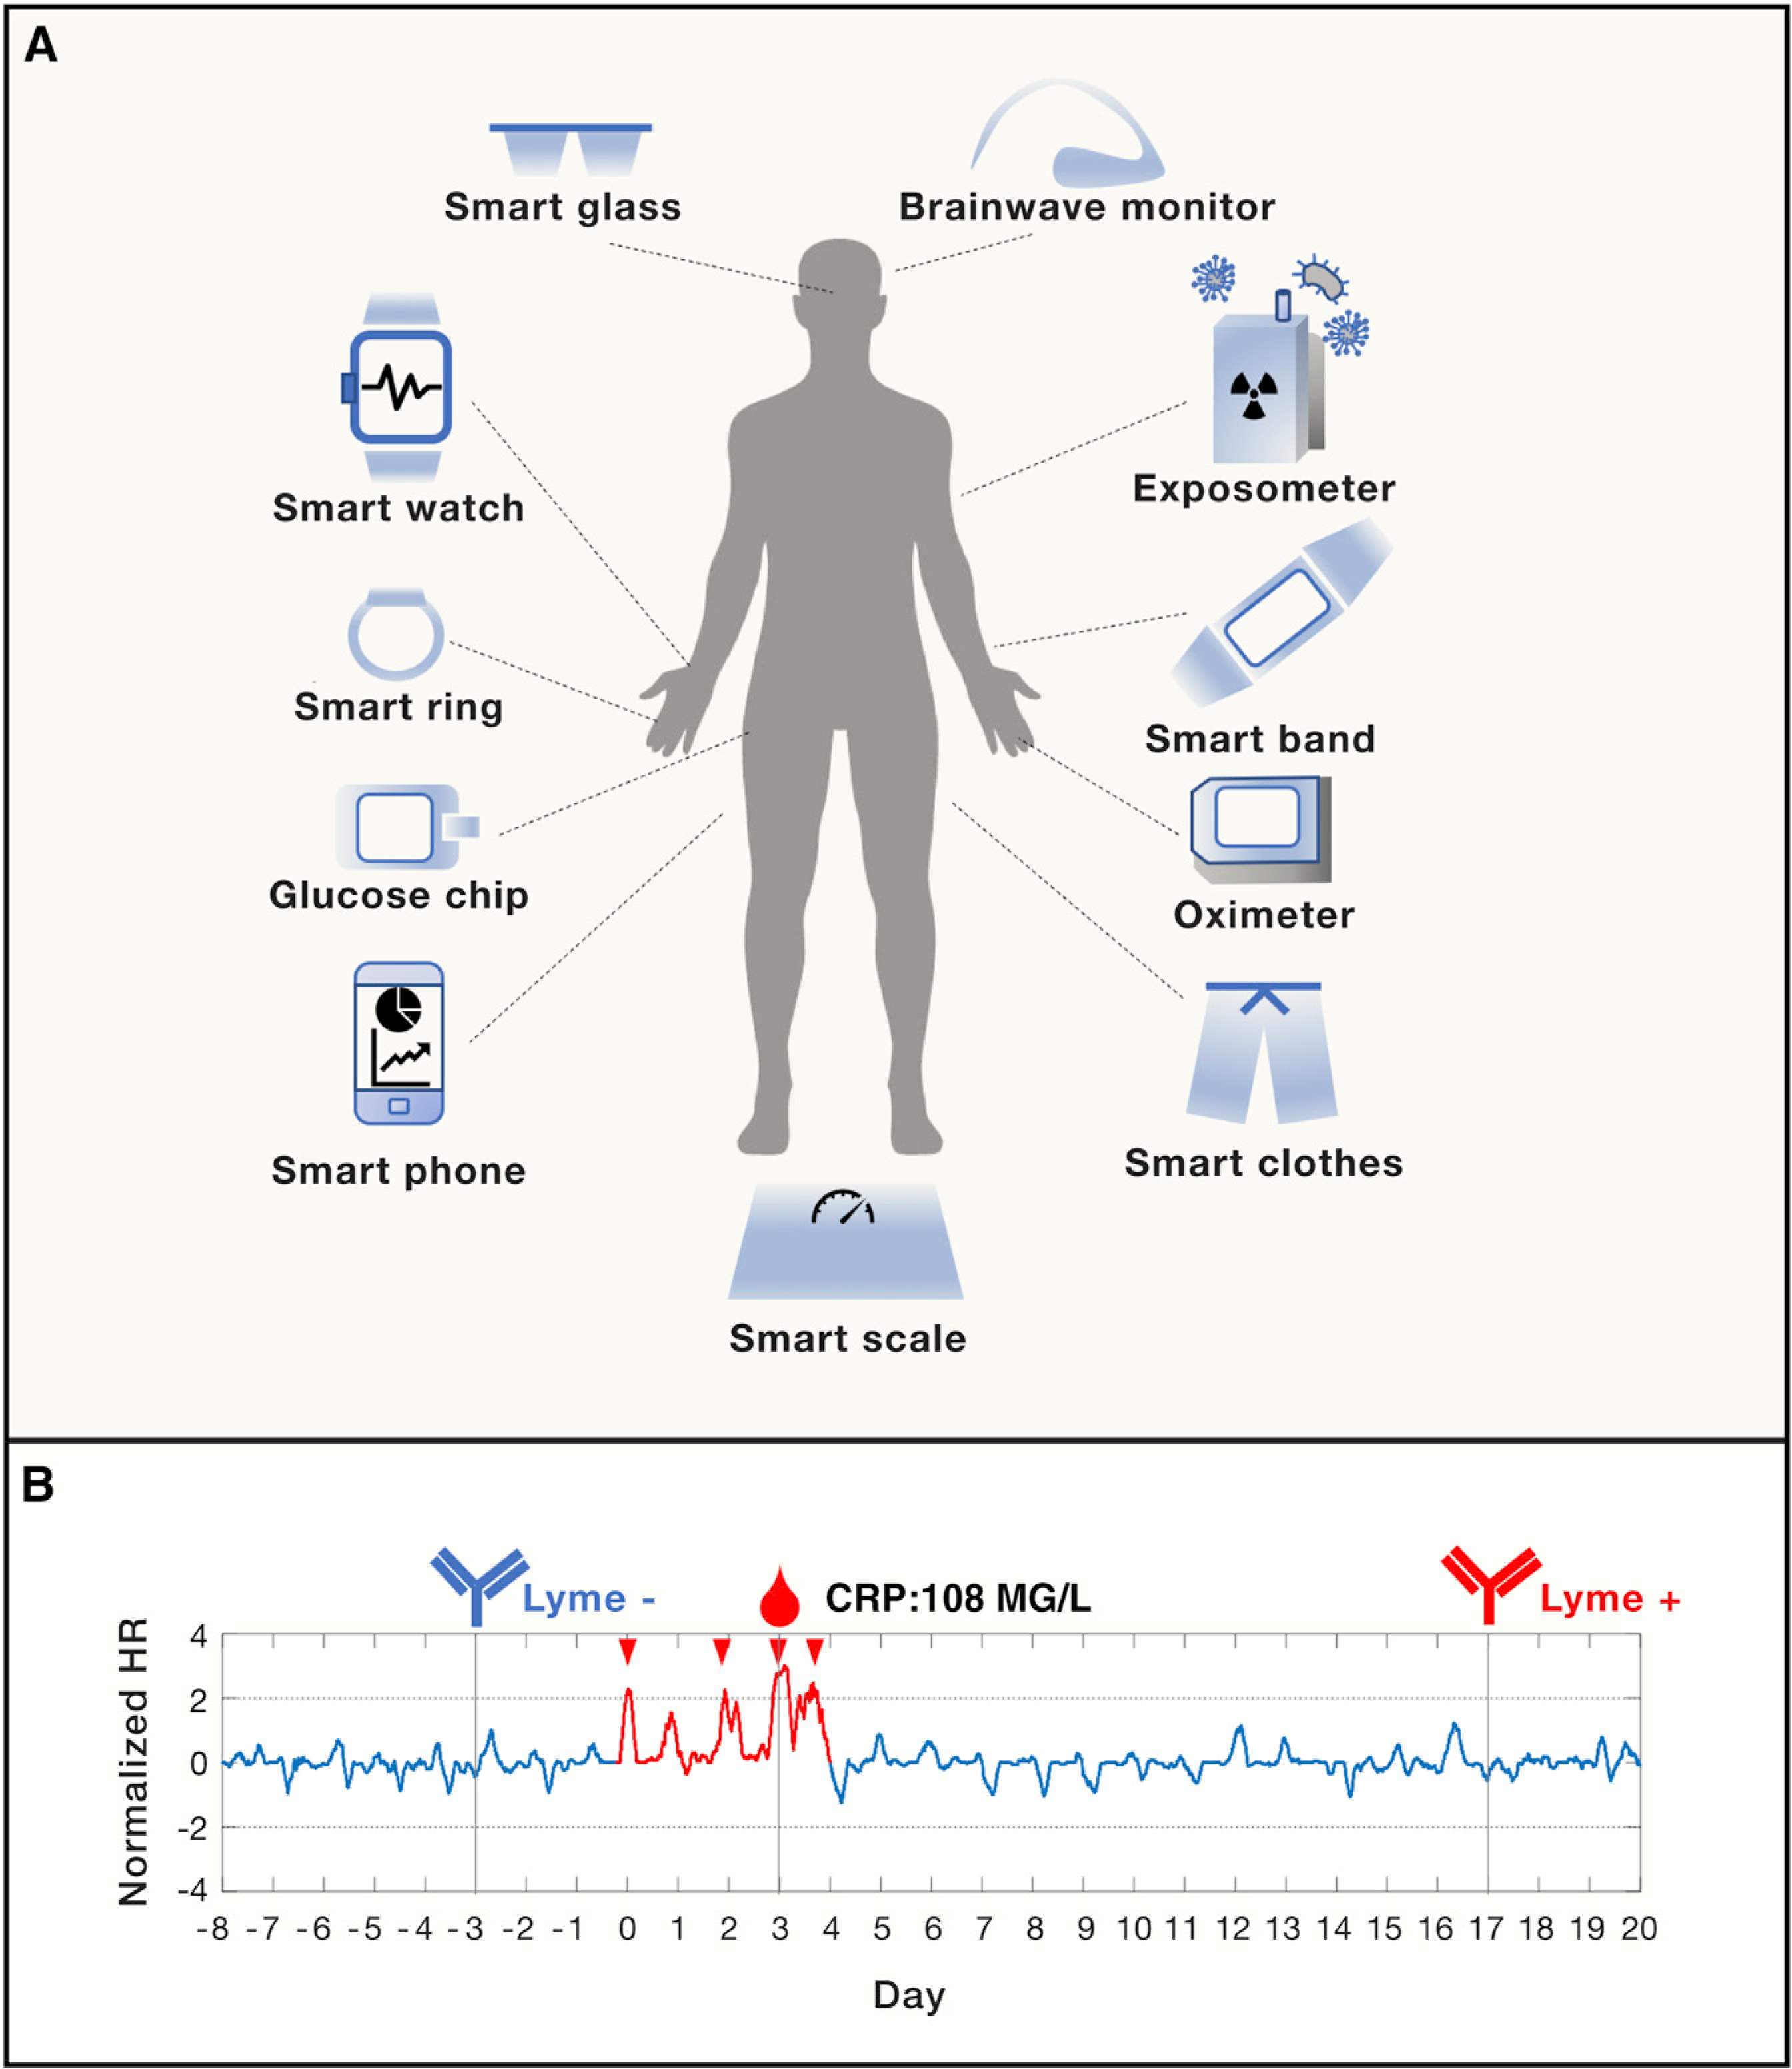
(A) An overview of existing wearable sensors acquiring human physiological and environmental data in real time.
(B) Early detection of Lyme disease using smart watch. The normalized heart rate (HR) peaked during the Lyme infection event (in red) with a CRP (c-reactive protein) value of 108 MG/L (day 0 to day 4). The infection was confirmed by negative and positive Lyme antibody testing before (day −3) and after the infection event (day 17, when the formal diagnosis was made).
A number of successful clinical applications have been reported, including wearable ECG sensors for arrhythmia detection, continuous glucose monitoring for real-time diabetes management, and blood oxygen monitoring for sleep apnea detection. In addition to extending the earlier discrete clinical measurements to continuous profiling, wearables devices also provide an alternative solution to many health parameters not easily obtained in conventional practice. For example, survey and questionnaire-based methods are commonly employed to study personal behavior and stress levels, which now can be dynamically captured by wearable accelerometers and galvanic skin response devices, respectively, at a millisecond resolution.
In addition to physiological factors, wearable sensors are revolutionizing the way we monitor our environmental exposures. The human exposome, including particulates, chemicals and microbes in the environment, is extremely important for human health. However, conventional epidemiological analyses are primarily limited to a set of known risk factors and toxicants at a population level, and researchers are not able to perform an agnostic analysis at a personal level. We recently designed a portable exposometer and longitudinally profiled the personal exposome of 15 individuals for up to 890 days (Jiang et al., 2018). Combined with deep sequencing and mass spectrometry profiling, we identified over 2,500 microbial species and 2,796 putative chemical features in the collected personal airborne exposures, and observed highly dynamic changes in human exposome composition in response to varying environment and lifestyles. This new technique has significantly broadened our view of the human exposome.
Despite the fast development of sensor technologies measuring more physiological and environmental parameters, a real challenge comes from building a data platform capable of storing, processing and analyzing large-scale data that are continuously and dynamically captured, deriving novel insights into precisely predicting, preventing and managing diseases. As a proof-of-principle, we collected longitudinal wearable sensor data from a generally healthy cohort and developed machine learning methods to detect abnormal physiological patterns associated with sickness. Of particular interest was the strong sickness signals derived from the physiological data at the onset of symptoms of Lyme disease, which were later confirmed by clinical antibody tests and C-reactive protein (CRP) readouts (Li et al., 2017) (Figure 2B).
In future practice, we envision that more efforts will be made to devise more sensor types for accurately and quantitatively measuring many more physiological, psychological and environmental parameters that cannot be easily studied in current research; develop integrative analytic frameworks to provide new biological and clinical insights; and build secure, interoperable and scalable backend platforms to provide real-time information for personal health management. It is important to note that these efforts demand extensive multidisciplinary collaboration, encompassing genetics, healthcare, engineering, human ethics and business, and these wearable-collected longitudinal personal profiles provide a new avenue to studying gene-environment interaction at a personal resolution, on an agnostic basis, and from a data-driven framework.
Gene-Environment Interaction: A Unified Framework from a Bayesian View
The complex nature of genetic components in complex diseases and the vast diversity of human physiology, behavior and lifestyles suggest that gene and environment interaction can be highly non-linear in determining complex traits. As such, our current linear additive model, P = G+E, is insufficient in capturing the intrinsic complexities, and the extensive interplay between gene and environment in a real-world scenario cannot be fully modeled by the presumed independency between the two components in the classic model.
We introduce a probabilistic model, BADGE (Bayesian Aggregation of Disease Genomics and Environment), where disease outcome (D), genetic risk (G), as well as environment contributors (E) can be modeled by a joint probability Pr(D, G, E). With this, we can immediately model a disease trait as a probabilistic outcome conditioned on one’s genome baseline as well as their non-genetic basis (environmental exposure for example) as Pr(D|G, E), which is essentially a mathematical representation of precision medicine. One illustrative hypothetical example is shown in Figure 3A, where carrying a risk allele and exposure to an environment toxicant jointly determines the disease outcome at a posterior probability of 0.9, compared with the posterior probability of 0.01 when not affected by the risk allele and the toxic exposure.
Figure 3. A Bayesian View of Gene-Environment Interaction.
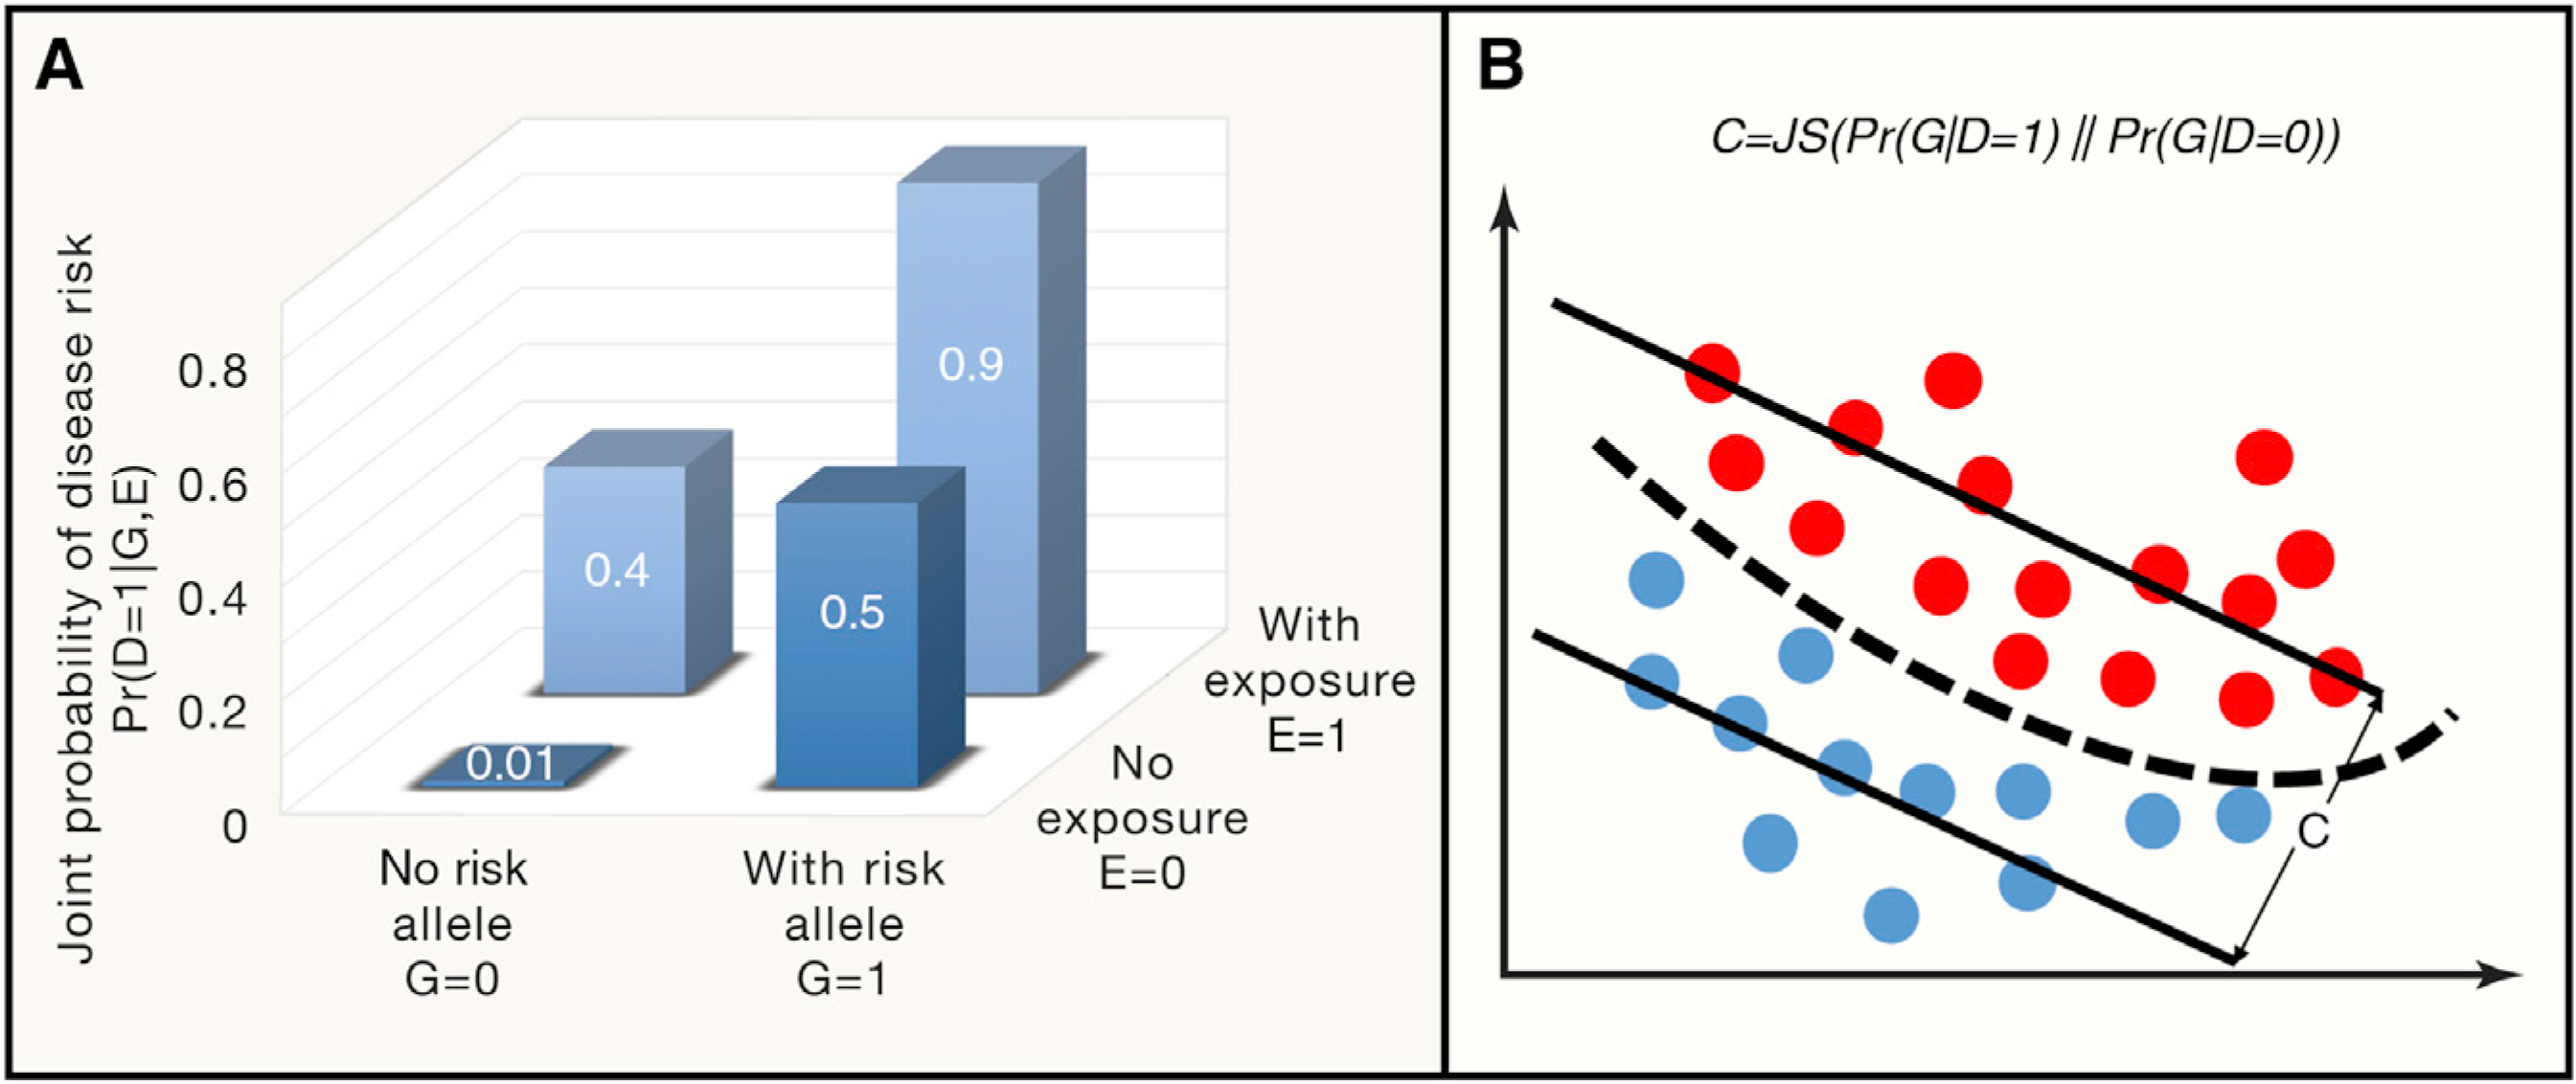
(A) A simplified example of BADGE illustrates the conditional dependency between genetic and environmental factors that determine the joint probability of disease outcome. According to Equations 1, 2, 3, 4, and 5 in the main text, assuming the risk allele frequency is Pr(G = 1) = 0.15 and the chance to be exposed to the environmental toxicant is Pr(E = 1) = 0.24, with some statistical inference procedures, one can readily determine disease prevalence Pr(D = 1) = 0.18, disease risk with and without environmental exposure at Pr(D = 1|E = 1) = 0.48 and Pr(D = 1|E = 0) = 0.08, respectively. Averaging out environmental factors, risk from personal genomes can be determined by Pr(D = 1|G = 1) = 0.60 and Pr(D = 1|G = 0) = 0.10, respectively, for individuals carrying or not carrying risk alleles. In the same vein, the genetic coefficient for this disease is 0.79 as defined in Equation 5.
(B) Graphical representation of the genetic coefficient for a given disease, which is defined by the distributional difference of between the case (red dots) and control genomes (blue dots), quantified by Jensen–Shannon (JS) divergence.
In fact, given the risk allele frequency distribution Pr(G) and the chance to be exposed to environmental toxicants Pr(E) at the population level, the proposed joint probability model Pr(D, G, E) unifies main concepts in the field, where disease prevalence could be defined by the marginal probability of having a disease by averaging over both genetic and environmental factors:
| Equation 1 |
Similarly, environmental contribution to disease outcome at a population level can be defined by Pr(D|E) by averaging over genetic contribution:
| Equation 2 |
In the same vein, personal genomic contribution to disease outcome is then defined by Pr(D|G) by averaging over the environmental contribution:
| Equation 3 |
This framework further allows us to infer one’s personal genome given the person’s clinical outcome:
| Equation 4 |
where Pr(D|G) is defined in Equation 3. Therefore, the genetic contribution to a particular disease outcome can be quantified by the distributional distance between cases Pr(G|D = 1) and controls Pr(G|D = 0), and we term this distance the genetic coefficient (C) for a disease, quantified by the Jensen–Shannon (JS) divergence between the two distributions:
| Equation 5 |
The concept is shown in Figure 3B, where a large C indicates large distinguishability of case genomes from control genomes. Taken together, different from the earlier practice on studying disease phenotypes based on independent contribution from genetics and environment, the probabilistic framework presented here provides a theoretic model for the interplay between genetic and environmental factors. This Bayesian framework can hierarchically model substantial complexities in a real-world situation.
Applying these concepts to the example in Figure 3A, with some statistical inference procedures, we can immediately derive the probability estimates for disease prevalence, disease risk with and without environmental exposure, genomic risk by averaging over the environmental contribution as well as the genetic coefficient as defined in Equation 5 (Figure 3A legend). It is important to note that in a real-world situation, the probability estimates in Figure 3A cannot be readily obtained, which requires sophisticated probabilistic learning techniques to infer the latent distributional landscape of model parameters related to disease genomes, personal lifestyles and environmental exposures. The modeling is specific for each disease type pending on experimental design (e.g., familial studies or case-control comparisons), but large-scale statistical inference tools for hierarchical Bayesian models of this type have been very well developed in recent years, including Markov chain Monte Carlo techniques and variational inference.
Looking Forward: Big Data and Better Models
The fast growing genomic, personal lifestyle, and environmental exposure data have revealed the intrinsic complexities of gene-environment interactions underlying many phenotypes. The classic linear models for gene-environment interaction demands substantial improvement to better accommodate these large amounts of heterogeneous data from efforts on genomic sequencing and deep phenotypic/environmental profiling. At the molecular level, we showed that for complex genotype-phenotype mapping, the widely used linear additive genetic model may be over-simplified. In fact, when modeling gene-gene interactions supported by biological data, epistasis has been immediately shown to dominate the genetic architecture of complex traits (Huang et al., 2012). Therefore, in parallel with collecting increasingly more patient genomic data in the hope of finding missing heritability, substantial effort must be dedicated to justifying the appropriateness of our statistical model, and an increase in sample size cannot effectively solve the underlying complexity. We suggest integrating multi-omics data with machine learning frameworks to reveal disease associated pathways. Notably, large-scale human proteomic studies and CRISPR tools have now been leveraged to identify physical and epistatic interactions between human genes, which will lead to a revelation of a compendium of molecular pathways in disease-related biological conditions as well as non-linear genetic interactions (Horlbeck et al., 2018). In this framework, complex diseases are not characterized by heterogeneous mutations, but by mutationally convergent pathways.
Technological innovation has conferred unprecedented power to analyze disease genomes and is now shifting the paradigm of studying clinical phenotypes and environmental factors with an unparalleled depth and breadth. Although recently proclaimed “dead” (https://www.businessinsider.com/wearables-are-dead-2016–12), wearable biosensors originally designed for fitness tracking and building social network apps are now beginning to be exploited for health management (Hall et al., 2018; Li et al., 2017), which has transformed the industry. Today, the clinical utility of wearable sensors is being widely deployed in multiple cohorts for longitudinal profiling of personal physiomes and activities. Future community efforts are still required to set standards to guide the best practice for data acquisition, storage, analytics and clinical interpretation.
Both genomic profiling and sensor platforms yield big data. Modeling the interplay between gene and environment thus requires a more sophisticated model to account for the intrinsic complexities and heterogeneity of each dataset. Extending our conventional P = G+E model, we herein propose a Bayesian framework (BADGE) to study gene-environment interaction, which is able to hierarchically model genetic risk, environmental factors and their mutual interactions using probabilistic learning techniques. Notably, we devised the genetic coefficient, C, to measure the genetic contribution to a given disease (Equation 5 and Figure 3B); this measure is conceptually analogous to heritability, but is formulated in a predictive framework: stronger genetic contribution implies more accurate prediction for disease outcome from personal genomes. In contrast to classical genetic and environment association studies, we are now equipped with new concepts, advanced machine learning tools, and state-of-the-art technologies to enable the era of precision health management.
Supplementary Material
ACKNOWLEDGMENTS
We thank Drs. Eric Topol, Steven Steinhubl, and Haiyuan Yu for helpful comments. J.L. thanks Dr. Gary Shaw for discussion on epidemiological studies. Due to the limit on cited references, we are grateful to all researchers in this community for advancing our understanding of complex human diseases. This work was supported by research grants from the National Institutes of Health (NIH) 3PO50HG0077350551 and U54DE023789.
Footnotes
DECLARATION OF INTERESTS
M.S. is a cofounder and on the scientific advisory board of Personalis, SensOmics, Qbio, Akna, January, Filtricine, and Oralome. J.L. is a cofounder and on the scientific advisory board of SensOmics.
SUPPLEMENTAL INFORMATION
Supplemental Information can be found with this article online at https://doi.org/10.1016/j.cell.2019.03.004.
REFERENCES
- Borrie SC, Brems H, Legius E, and Bagni C (2017). Cognitive Dysfunctions in Intellectual Disabilities: The Contributions of the Ras-MAPK and PI3K-AKT-mTOR Pathways. Annu. Rev. Genomics Hum. Genet 18, 115–142. [DOI] [PubMed] [Google Scholar]
- Boyle EA, Li YI, and Pritchard JK (2017). An Expanded View of Complex Traits: From Polygenic to Omnigenic. Cell 169, 1177–1186. [DOI] [PMC free article] [PubMed] [Google Scholar]
- Gilman SR, Iossifov I, Levy D, Ronemus M, Wigler M, and Vitkup D (2011). Rare de novo variants associated with autism implicate a large functional network of genes involved in formation and function of synapses. Neuron 70, 898–907. [DOI] [PMC free article] [PubMed] [Google Scholar]
- Hall H, Perelman D, Breschi A, Limcaoco P, Kellogg R, McLaughlin T, and Snyder M (2018). Glucotypes reveal new patterns of glucose dysregulation. PLoS Biol. 16, e2005143. [DOI] [PMC free article] [PubMed] [Google Scholar]
- Hong X, Hao K, Ji H, Peng S, Sherwood B, Di Narzo A, Tsai HJ, Liu X, Burd I, Wang G, et al. (2017). Genome-wide approach identifies a novel gene-maternal pre-pregnancy BMI interaction on preterm birth. Nat. Commun 8, 15608. [DOI] [PMC free article] [PubMed] [Google Scholar]
- Horlbeck MA, Xu A, Wang M, Bennett NK, Park CY, Bogdanoff D, Adamson B, Chow ED, Kampmann M, Peterson TR, et al. (2018). Mapping the Genetic Landscape of Human Cells. Cell 174, 953–967 e922. [DOI] [PMC free article] [PubMed] [Google Scholar]
- Hsiao TL, and Vitkup D (2008). Role of duplicate genes in robustness against deleterious human mutations. PLoS Genet. 4, e1000014. [DOI] [PMC free article] [PubMed] [Google Scholar]
- Huang W, Richards S, Carbone MA, Zhu D, Anholt RR, Ayroles JF, Duncan L, Jordan KW, Lawrence F, Magwire MM, et al. (2012). Epistasis dominates the genetic architecture of Drosophila quantitative traits. Proc. Natl. Acad. Sci. USA 109, 15553–15559. [DOI] [PMC free article] [PubMed] [Google Scholar]
- Jiang C, Wang X, Li X, Inlora J, Wang T, Liu Q, and Snyder M (2018). Dynamic Human Environmental Exposome Revealed by Longitudinal Personal Monitoring. Cell 175, 277–291 e231. [DOI] [PMC free article] [PubMed] [Google Scholar]
- Li X, Dunn J, Salins D, Zhou G, Zhou W, Schüssler-Fiorenza Rose SM, Perelman D, Colbert E, Runge R, Rego S, et al. (2017). Digital Health: Tracking Physiomes and Activity Using Wearable Biosensors Reveals Useful Health-Related Information. PLoS Biol. 15, e2001402. [DOI] [PMC free article] [PubMed] [Google Scholar]
- Li J, Pan C, Zhang S, Spin JM, Deng A, Leung LLK, Dalman RL, Tsao PS, and Snyder M (2018). Decoding the Genomics of Abdominal Aortic Aneurysm. Cell 174, 1361–1372 e1310. [DOI] [PubMed] [Google Scholar]
- Manolio TA, Collins FS, Cox NJ, Goldstein DB, Hindorff LA, Hunter DJ, McCarthy MI, Ramos EM, Cardon LR, Chakravarti A, et al. (2009). Finding the missing heritability of complex diseases. Nature 461, 747–753. [DOI] [PMC free article] [PubMed] [Google Scholar]
- Rajkomar A, Oren E, Chen K, Dai AM, Hajaj N, Hardt M, Liu PJ, Liu X, Marcus J, Sun M, et al. (2018). Scalable and accurate deep learning with electronic health records. npj Digital Medicine 1. [DOI] [PMC free article] [PubMed] [Google Scholar]
- Wray NR, Ripke S, Mattheisen M, Trzaskowski M, Byrne EM, Abdellaoui A, Adams MJ, Agerbo E, Air TM, Andlauer TMF, et al. ; eQTL-Gen; 23andMe; Major Depressive Disorder Working Group of the Psychiatric Genomics Consortium (2018). Genome-wide association analyses identify 44 risk variants and refine the genetic architecture of major depression. Nat. Genet 50, 668–681. [DOI] [PMC free article] [PubMed] [Google Scholar]
- Yeung KS, Tso WWY, Ip JJK, Mak CCY, Leung GKC, Tsang MHY, Ying D, Pei SLC, Lee SL, Yang W, and Chung BH (2017). Identification of mutations in the PI3K-AKT-mTOR signalling pathway in patients with macrocephaly and developmental delay and/or autism. Mol. Autism 8, 66. [DOI] [PMC free article] [PubMed] [Google Scholar]
Associated Data
This section collects any data citations, data availability statements, or supplementary materials included in this article.