

Abstract
J Clin Hypertens (Greenwich). 2012;14:767–772. ©2012 Wiley Periodicals, Inc.
The authors investigated the efficacy of a lifestyle educational program, organized in small group meetings, in improving the outcome of a nonpharmacologic intervention. One hundred and eighty‐eight hypertensive patients with stable blood pressure (BP) levels and drug therapy in the previous 6 months were randomly divided into educational care (EC) and usual care (UC) groups. They were followed at 3‐month intervals up to 2 years. In addition to the visits in an outpatient clinic, patients in the EC program participated in small group meetings in order to improve their knowledge of the disease and reinforce their motivation for treatment. At baseline, EC and UC groups were similar for age, sex, body mass index (BMI), blood pressure (BP) levels, and pharmacologic treatment. Patients in the EC group had significantly reduced total energy, total and saturated fats, and sodium intake. Physical activity was significantly increased in the EC group as well. At the end of the 1‐year follow‐up, BMI (P<.001), visceral fat (P<.001), and BP (P<.001) were significantly lower in the EC group compared with the UC group. Pharmacologic treatment during the study was similar for all classes of drugs apart from diuretics whose dose was higher in the UC group at the end of the study.
The association between arterial hypertension and other metabolic diseases has been frequently observed in the literature by several investigators and by ourselves in both clinical studies in the outpatient clinic and in observational studies in large population samples. 1 , 2 , 3 , 4 Overweight status particularly seems to influence the development of hypertension but impairment in blood lipids and glucose are also involved, as seen in the metabolic syndrome. 5 Accordingly, guidelines for optimal treatment of arterial hypertension indicate that nonpharmacologic intervention is the first approach in patients with low global cardiovascular risk and is associated with drug therapy in patients with moderate to high global risk. 6
Despite the interest to prevent the vascular complications of hypertension, the goal of normal blood pressure (BP) levels is achieved in only <25% patients with hypertension worldwide. Reasons for this disappointing result vary, including low dosage of antihypertensive drugs, patients not taking prescribed pills, resistant hypertension, and poor compliance to prescribed nonpharmacologic measures. We have described the difficulties found by our patients in continuing a dietary approach to improve BP over a long period of time despite achieving significant improvement in BP and body weight (BW) control, associating lifestyle changes with pharmacologic treatment. 7
The aim of the present study was to evaluate whether an educational program dedicated to nonpharmacologic measures to treat hypertension, including small group meetings with doctors and dieticians in addition to usual controls in the outpatient clinic would be useful in achieving better and long‐lasting results in the control of BP levels, BW, and serum parameters of glucose and lipid metabolism when compared with the usual approach in an outpatient clinic.
Patients and Methods
Two hundred hypertensive patients seen in the hypertension outpatient clinic of our department were enrolled in the present study. They were fully informed of the aims of the investigation and their consent was obtained before entering the study group. All participants had stable BP levels during the past 6 months when their pharmacologic and nonpharmacologic treatment had not been modified. At baseline, a full physical examination was performed, including the following clinical measurements: BW, body mass index (BMI), BP, and heart rate. At the same visit, blood samples were taken from a suitable forearm vein for the following laboratory analyses: fasting blood glucose, serum creatinine, total cholesterol, triglycerides, and high‐density lipoprotein cholesterol (HDL‐C). Low‐density lipoprotein cholesterol (LDL‐C) was calculated according to the Friedwald’s formula. 8 Data regarding dietary intake were collected using a food frequency validated questionnaire 9 and data regarding pharmacologic therapy were also collected.
At the end of the examination, all patients were prescribed a Mediterranean diet low in salt, which could also be low in daily energy if needed. Diets were explained to all patients by a well‐trained dietician (S.E.) according to a routine protocol. Thereafter, patients were randomly divided in two groups: an educational care program (EC) and the usual care program (UC). Both groups were seen in the outpatient clinic at 3‐month intervals up to 1 year by doctors and dieticians (D.F.V., S.L., S.E., G.R., F.F.) who were unaware of the group for which the patients were assigned. BW was always measured by the same dietician (SE); however, patients in the intensive care program were also supplemented with additional information regarding their disease and the importance of the prescribed nonpharmacologic treatment according to a previously scheduled protocol of small group meetings with a dietician and doctors (P.D., R.B.F., G.F.), while patients in the referred care program were seen only in the outpatient clinic context.
At 1‐year follow‐up, BP was accurately monitored and doctors could modify dosage and number of drugs according to a scheduled program. In particular, if BP was poorly controlled, the daily dosage of drugs was increased in the following order: angiotensin‐converting enzyme (ACE) inhibitors or angiotensin receptor antagonists, calcium channel blockers, β‐blockers, and diuretics. On the other hand, when BP was lower than needed, drugs were reduced in the inverse order: diuretics, β‐blockers, calcium antagonists, and ACE inhibitors/angiotensin receptor antagonists.
At the end of the 1‐year study, all patients were invited to continue the dietary project and both groups were seen by doctors and dieticians in the outpatient clinic at 3‐month intervals up to 2 years.
EC Program
Patients were seen in small group meetings by doctors and a well‐trained dietician 3 times at 1‐month intervals. Before starting the educational program, patients were invited to complete an appropriate questionnaire in order to collect information regarding the level of knowledge of their disease and the main components of a healthy diet. Thereafter, patients were trained regarding hypertension and other cardiovascular risk factors, the importance of BW and abdominal circumference control, how to avoid food rich in fat and salt and to choose fiber‐rich food, the importance of avoiding smoking, and to perform aerobic physical activity regularly (at least 3 times weekly in order to burn 1200 kcal per week).
The aims of the first meeting were: (1) to explain the meaning of global cardiovascular risk and the relevance of hypertension as a cardiovascular risk factor; (2) to explain the importance of BW and waist circumference in relationship to BP levels and cardiovascular risk; and (3) to stress the main nonpharmacologic measures to reduce BW and BP, in particular to learn how to recognize high‐energy food and how to perform mild aerobic physical exercise. The aims of the second meeting were: (1) to explain the relationship of sodium intake and hypertension and the importance of reducing high‐salt intake; (2) to recognize high‐fat food and to opt for monounsaturated or polyunsaturated fats; and (3) to explain the importance of a high‐potassium food intake by increasing consumption of fruits, legumes, and vegetables. The aims of the third meeting were: (1) to learn the importance of fiber in controlling BW and other metabolic risk factors; (2) to understand the negative effect of high alcohol intake on BW and BP and the importance of limiting daily red wine intake to no more than 125 mL; (3) to understand the negative effect of cigarette smoking on the arterial tree; and (4) to understand the positive effect on the cardiovascular system of the Mediterranean diet.
Ideal BW and 10‐year cardiovascular risk score was also calculated according to the Framingham equation. 10 At the end of the course, patients received a questionnaire similar to that filled out at the first meeting in order to evaluate the degree of education in healthy lifestyle they had achieved.
Statistical Analysis
Data were analyzed using the SPSS statistical package (SPSS‐PC; SPSS Inc, Chicago, IL). Results were expressed as mean±standard deviation. Comparison of means were performed by Student t test for unpaired data and one‐way analysis of variance with Tukey’s multiple comparisons. Nonparametric variables were analyzed by χ2 test.
Results
Of the 200 patients initially enrolled, 12 dropped out before randomization into the groups because they were not able to attend the scheduled visits, leaving 188 patients for study assessment. At baseline the two groups of patients, EC and UC, were similar for sex distribution (52 men and 42 women vs 46 men and 48 women in the EC and UC groups, respectively), age, BW, BP, and serum parameters of glucose and lipid metabolism. Data regarding the characteristics of the two groups are shown in Table I. No difference was observed in the daily energy intake and consumption of dietary macronutrients and micronutrients (Table II). Smoking habit (nonsmokers 84.4% vs 88.3%, moderate smokers 5.2% vs 3.2%, and heavy smokers 10.4% vs 8.5%) was similar in the two groups as well. Regarding physical activity, the two groups were comparable (sedentary 84.4% vs 93.6%). Similarly, no difference was detected in the daily antihypertensive drug consumption.
Table I.
Characteristics of the Educational Care and Usual Care Groups at Baseline
| Educational Care (n=94) | Usual Care (n=94) | |
|---|---|---|
| Age, y | 56.2±10 | 56.6±9 |
| Body weight, kg | 79.7±15 | 79.9±12 |
| BMI, w/h2 | 28.7±5 | 29.6±4 |
| Waist circumference, cm | 102.2±12 | 104.3±10 |
| SBP, mm Hg | 135.8±17 | 132.3±15 |
| DBP, mm Hg | 85.4±12 | 83.3±9 |
| Serum cholesterol, mg/dL | 199.2±36 | 195.5±37 |
| LDL cholesterol, mg/dL | 126.2±32 | 119.5±36 |
| HDL cholesterol, mg/dL | 49.2±12 | 50.0±13 |
| Serum triglycerides, mg/dL | 127.4±98 | 140.0±80 |
| Fasting blood glucose, mg/dL | 98.8±26 | 102.7±27 |
Abbreviations: BMI, body mass index; DBP, diastolic blood pressure; HDL, high‐density lipoprotein; LDL, low‐density lipoprotein; SBP, systolic blood pressure.
Table II.
Energy, Macronutrient, and Micronutrient Composition of the Diets of the EC (Upper Line) and UC (Lower Line) Groups at Baseline and During 1‐y Follow‐Up
| Baseline | 6 Mo | 12 Mo | P Value | |
|---|---|---|---|---|
| Kcal (EC) | 2467±618 | 2115±549 | 2019±436 | <.001 |
| Kcal (UC) | 2429±573 | 2366±579 | 2407±576 | |
| .03 | <.001 | |||
| Proteins, g | 96±19 | 84±19 | 82±15 | <.001 |
| 93±22 | 90±19 | 91±19 | ||
| .001 | ||||
| Total lipids, g | 83±24 | 64±20 | 61±13 | <.001 |
| 81±21 | 77±18 | 79±20 | ||
| <.001 | <.001 | |||
| SFAs, g | 29±10 | 20±7 | 19±5 | <.001 |
| 29±10 | 25±8 | 27±9 | ||
| <.001 | <.001 | |||
| MUFAs, g | 42±11 | 35±10 | 33±7 | <.001 |
| 42±10 | 41±9 | 41±9 | ||
| .01 | <.001 | |||
| PUFAs, g | 11±3 | 9±3 | 8±2 | <.001 |
| 11±3 | 10±3 | 10±3 | ||
| <.002 | <.001 | |||
| CHOs, g | 356±108 | 321±102 | 304±78 | .002 |
| 351±98 | 350±104 | 356±100 | ||
| .001 | ||||
| Soluble CHOs, g | 104±36 | 82±29 | 84±29 | <.001 |
| 109±32 | 104±29 | 109±37 | ||
| <.001 | <.001 | |||
| Cholesterol, mg | 227±79 | 175±76 | 170±56 | <.001 |
| 227±72 | 210±64 | 218±79 | ||
| .01 | <.001 | |||
| Fiber, g | 31±8 | 29±7 | 30±7 | |
| 31±7 | 32±7 | 32±7 | ||
| <.05 | ||||
| Sodium, mg | 2825±951 | 2117±738 | 1990±689 | <.001 |
| 2587±891 | 2477±843 | 2481±799 | .03 | |
| <.03 | <.001 | |||
| Potassium, mg | 3559±877 | 3307±763 | 3420±818 | |
| 3709±856 | 3800±702 | 3817±863 | ||
| <.001 | .001 | |||
| Calcium, mg | 933±318 | 671±169 | 683±204 | <.001 |
| 915±246 | 820±224 | 875±236 | ||
| <.001 | <.001 | |||
| Alcohol, g | 9±15 | 6±13 | 5±11 | |
| 7±12 | 8±12 | 8±14 |
Abbreviations: CHOs, carbohydrates; EC, educational care; MUFA, mono‐unsaturated fatty acids PUFA, polyunsaturated fatty acids; SFA, saturated fatty acids; UC, usual care.
During the follow‐up period, patients in the EC program significantly reduced energy intake, particularly that derived from saturated fats and soluble carbohydrates, not only compared with baseline values but also compared with values of the UC group (Table II). No difference was detected in smoking habit compared with baseline and with the other group. On the other hand, the number of patients performing physical activity significantly increased in the EC group and reached statistical significance at each control (Figure 1).
Figure 1.
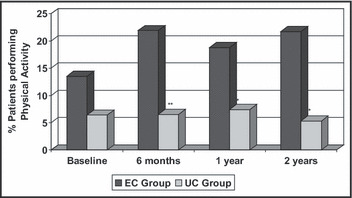
Physical activity at baseline and at 2‐year follow‐up in 188 hypertensive patients participating in the nonpharmacologic intervention program, divided in the educational care (EC; n=94) and usual care (UC; n=94) groups. Significance EC vs UC group: *P<.02 and **P<.003.
Between‐group differences were detected in BW, BMI, visceral obesity, and systolic BP at the 6‐month follow‐up, with the addition of a significant reduction in diastolic BP and triglycerides at 1‐year control (Table III). Concomitantly, no significant changes were performed in the antihypertensive therapy in either group (Table IV).
Table III.
Changes in Body Weight, Blood Pressure, Serum Cholesterol, Triglycerides, and Blood Glucose During the 1‐y Follow‐Up in the EC (Upper Lines) and UC (Lower Lines) Groups
| Baseline | 6 Mo | 2 Mo | P Value | |
|---|---|---|---|---|
| Body weight, kg | ||||
| EC | 79.5±15 | 77.1±14 | 76.5±14 | ns |
| UC | 80.0±12 | 80.7±12 | 80.9±13 | ns |
| ns | .05 | .02 | ||
| BMI, w/h2 | 28.7±5 | 27.9±4 | 27.6±4 | ns |
| 29.6±4 | 29.9±4 | 30.0±4 | ns | |
| ns | .001 | .001 | ||
| Waist circumference, cm | 102.2±12 | 98.2±11 | 98.6±11 | .04 |
| 104.3±10 | 103.7±10 | 104.9±10 | ns | |
| ns | .005 | .001 | ||
| SBP, mm Hg | 136.0±17 | 127.3±12 | 124.5±10 | .001 |
| 132.3±15 | 133.1±16 | 133.5±15 | ns | |
| ns | .05 | .001 | ||
| DBP, mm Hg | 85.4±12 | 80.3±8 | 77.9±9 | .001 |
| 83.3±9 | 81.9±10 | 81.3±9 | ns | |
| ns | ns | .01 | ||
| Cholesterol, mg/dL | 199.7±36 | 200.4±39 | 183.8±32 | .01 |
| 195.6±37 | 194.5±33 | 192.1±33 | ns | |
| ns | ns | ns | ||
| LDL‐C mg/dL | 126.8±32 | 126.0±38 | 110.8±33 | .02 |
| 119.5±36 | 113.3±37 | 113.3±35 | ns | |
| .05 | ns | |||
| HDL‐C mg/dL | 49.1±12 | 49.3±13 | 49.7±12 | ns |
| 49.8±13 | 51.6±12 | 52.0±14 | ns | |
| ns | ns | ns | ||
| Triglycerides, mg/dL | 127.1±97 | 142.0±95 | 115.2±48 | ns |
| 142.0±82 | 133.5±60 | 134.9±54 | ns | |
| ns | ns | .01 | ||
| Fasting blood glucose, mg/dL | 98.6±26 | 103.2±36 | 99.2±22 | ns |
| 102.7±27 | 99.9±20 | 104.9±33 | ns | |
| ns | ns | ns | ||
Abbreviations: BMI, body mass index; DBP, diastolic blood pressure; EC, educational care; HDL‐C, high‐density lipoprotein cholesterol; LDL‐C, low‐density lipoprotein cholesterol; ns, not significant; SBP, systolic blood pressure; UC, usual care.
Table IV.
Changes in Mean Daily Drug Dosage During the 1‐y Follow‐Up in the EC (Upper Lines) and UC (Lower Lines) Groups During the 1‐y Dietary Intervention
| Baseline, Mean±SD (No.) | 6 Mo, Mean±SD (No.) | 12 Mo, Mean±SD (No.) | P Value | |
|---|---|---|---|---|
| Irbesartan, mg | ||||
| EC | 258±60 (42) | 255±60 (45) | 264±90 (49) | ns |
| UC | 273±120 (43) | 285±150 (45) | 288±150 (49) | ns |
| ns | ns | ns | ||
| Atenolol, mg | 37.5±25 (22) | 37±25 (27) | 36±25 (31) | ns |
| 43.0±20 (27) | 41±20 (29) | 48±35 (33) | ns | |
| ns | ns | ns | ||
| Lisinopril, mg | 15.6±6 (37) | 14.6±8 (36) | 15.1±6 (36) | ns |
| 15.2±6 (40) | 16.2±6 (43) | 16.6±4 (42) | ns | |
| ns | ns | ns | ||
| Chlorthalidone, mg | 14.5±5 (38) | 14.7±5 (42) | 14.2±5 (44) | ns |
| 18.2±7. (45) | 17.5±7 (47) | 18.2±7 (51) | ns | |
| 0.03 | 0.05 | 0.01 | ||
| Rosuvastatin, mg | 8.9±4 (22) | 9.3±4 (30) | 8.9±4 (35) | ns |
| 9.3±4 (38) | 10.4±6 (44) | 9.9±6 (47) | ns | |
| ns | ns | ns | ||
| Amlodipine, mg | 8.1±3 (40) | 8.1±4 (45) | 7.5±4 (41) | ns |
| 7.8±4 (35) | 8.1±4 (37) | 8.1±4 (38) | ns | |
| ns | ns | ns | ||
Abbreviations: EC, educational care; ns, not significant; SD, standard deviation; UC, usual care.
Systolic BP at baseline was related only to daily dietary intake of total and saturated lipids. Diastolic BP, on the other hand, was significantly related to BW, LDL‐C, daily energy intake, proteins, total lipids, saturated fatty acids, poly‐unsaturated fatty acids, and salt.
In the linear regression analysis with diastolic BP as the independent variable, the best regression equation was obtained, including BW, LDL‐C, total energy intake, SFA, and sodium (R 2=0.099, F=3.907, P<.002). Of the previously indicated variables, only BW (P<.005) and LDL‐C (0.04) were still independently associated with baseline diastolic BP.
Changes in systolic BP during 1‐year follow‐up were significantly related to changes in BW, BMI, energy intake, lipids (particularly saturated fatty acids), cholesterol, and sodium (Table V). In the linear regression analysis, the best regression equation was obtained including changes in BW, total daily energy, total lipids, and sodium (R 2 0.122, F=4.992, P<.001), and changes in sodium intake (t=2.584, P<.01) and total lipids (t=1.939, P=.05) were independently associated with changes in systolic BP. Changes in diastolic BP were significantly related to changes in BW, BMI, total energy, total fats (particularly saturated fatty acids), cholesterol, proteins, and sodium (Table V). The best linear regression equation included changes in BMI, saturated lipids, proteins, cholesterol, and sodium (R 2 0.082, F=2.573, P=.03).
Table V.
Correlation Coefficients Between 1‐y Changes in SBP and DBP and Corresponding Changes in Body Weight, Energy Intake, and Macronutrients of the Diet
| Δ SBP, r | Δ DBP, r | |
|---|---|---|
| Δ BMI | 0.273a | 0.321a |
| Δ Body weight | 0.258a | 0.253a |
| Δ Dietary energy | 0.284a | 0.258a |
| Δ Lipids | 0.324a | 0.286a |
| Δ SFAs | 0.322a | 0.250a |
| Δ MUFAs | 0.278b | 0.204b |
| Δ PUFAs | 0.210b | 0.196b |
| Δ CHOs | 0.188b | 0.256a |
| Δ Proteins | 0.178b | 0.261a |
| Δ Sodium | 0.300a | 0.208b |
Abbreviations: Δ change; BMI, body mass index; CHO, carbohydrates; DBP, diastolic blood pressure; MUFAs, mono‐unsaturated fatty acids; PUFAs, polyunsaturated fats; SBP, systolic blood pressure; SFAs, saturated fatty acids. a P<.001; b P<.01.
At the end of the 1‐year study, patients were invited to continue their diet and both groups of patients were seen in the outpatient clinic only without further reinforcement of the information given to the EC group in the small group meetings. Fifty‐nine patients from the EC group and 56 from the the UC group continued to the end of the 2‐year follow‐up. At that time, patients in the EC group still had lower BW (75.7±14 kg vs 80.7±12 kg, P<.05), BMI (27.3±4 kg/m2 vs 29.9±4 kg/m2, P<.01), waist circumference (97.7±9 cm vs 106.2±11 cm, P<.001), systolic BP (123.2±13 mm Hg vs 130.0±14 mm Hg, P<.01), and diastolic BP (78.6±7 mm Hg vs 81.7±8 mm Hg, P<.03) (Figure 2). Food frequency questionnaires showed that patients in the EC group were still much more compliant to the dietary prescription since their diet was lower in total calories (1919±429 kcal/d vs 2427±560 kcal/d, P<.001), total (58±12 g vs 78±18 g, P<.001) and saturated (17±5 vs 26±8 g, P<.001) fats, cholesterol (288±78 vs 364±95 mg, P<.001), and sodium (1849±548 mg vs 2396±850 mg, P<.001). Moderate physical activity was still increased in the EC group. Moreover, no difference in daily dosage of drugs was detected.
Figure 2.
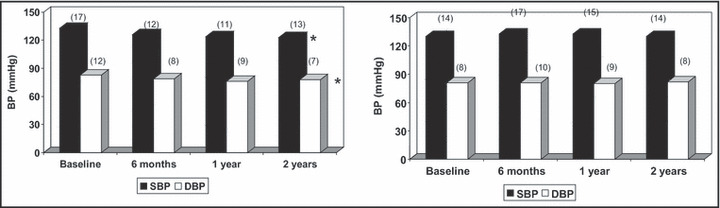
Systolic and diastolic blood pressure in 59 patients in the educational care (EC) group (on the left) and 56 in the usual care (UC) group (on the right) who completed the 2‐year follow‐up, at baseline and during the observation period. Significance vs baseline: *P<.001.
Discussion
The topic of reducing BP levels and improving cardiovascular risk by nonpharmacologic intervention has been widely investigated in the literature. There are many studies dealing with changes in cardiovascular risk factors after a nonpharmacologic program of BW reduction. Most of these studies were performed in hospitalized patients or in highly selected participants while the effects in clinical practice were rarely examined. 11 , 12 , 13 , 14
In a previous study, the initial BW reduction observed at 6‐month control was progressively reduced over time and the authors stated that patients who had been able to reduce their BW by 4.5 kg and maintain this decrease during the following 30 months achieved the greatest reduction in BP levels and risk of hypertension. 15 Our study showed that the initial effects of the nonpharmacologic intervention in hypertensive patients was lost over time when the intensive care approach in the outpatient clinic with the simultaneous involvement of doctors and dieticians had been replaced by the habitual follow‐up without reinforcement of the nonpharmacologic message, so that the majority of patients had returned to their habitual diet in a few month time. 7 On the other hand, Appel and colleagues 16 recently showed a sustained clinically significant weight loss when primary care providers reinforced participation at the scheduled program even by remote support without face‐to‐face contact.
In order to avoid the return to their lifestyle habits, we decided to randomly include a group of hypertensive patients in a program that allowed patients to learn many aspects of their disease, the increased cardiovascular risk to which they were exposed, and how to calculate it by using one of the most common algorithms, the risk of eating food that negatively influences their BP and/or main metabolic parameters and the usefulness of eating according to the guidelines of healthy nutrition and of regularly performing aerobic physical activity. Patients in the experimental group were, therefore, additionally seen outside the outpatient clinic in small groups when the educational program was carried out by doctors and dieticians whose role of caregiver was expanded according to a recent report. 17
We observed that these patients obtained a significantly marked reduction in BP, BW, central adiposity, total cholesterol, and LDL‐C in 6 months compared with the control group, which had similar counselling but was followed‐up only according to the habitual visits in the outpatient clinic. Surprisingly, the observed effects lasted for a long time as demonstrated by the analyses performed after the first and second year of follow‐up; thus, indicating that full information regarding the disease and the tools to fight it results in the desired change in the patients’ behavior.
This observation is in agreement with previous findings regarding the effectiveness of discussing coronary risk in order to improve pharmacologic BP control 18 or drug treatment of dyslipidemia. 19 In our experience, however, it is much more difficult to maintain adherence to the nonpharmacologic treatment than to drug therapy since lifestyle changes are frequently considered stressful conditions in daily life, particularly in the case of maintaining BW control in obese patients. A paper has been recently published regarding a new motivation‐focused weight loss maintenance program for patients with urinary incontinence 20 and we look forward to the results in order to improve the response of our patients to the lifestyle changes requested to reduce cardiovascular risk.
The dropout rate of almost one third of patients after the 1‐year follow‐up obviously compromises the importance of the 2‐year follow‐up. Nevertheless, it seems worthy to note that about two thirds of the patients included in the study were still regularly seen in the outpatient clinic. Those who were in the educational program showed significantly better control of BW and BP, were much more compliant to the dietary program, and were more frequently engaged in moderate physical activity than the control group. This observation pushes us to consider that the initial larger investment of human resources might be limited to a small period while the results might be seen even after years.
To date, we think that in terms of cost‐effectiveness the small‐group approach to an educational program to improve lifestyle habits may be considered effective and less expensive, particularly considering the expected reduction of cardiovascular events over time.
Conclusions
An educational program to improve adherence to nonpharmacologic treatment of obesity and hypertension is frequently neglected in the clinical practice because patients and doctors often prefer to increase the number and/or dosage of medications. The present investigation shows that involving patients in a face‐to‐face program with doctors and dieticians is a low‐cost/benefit procedure able to improve the outcome of the disease and reduce the risk of cardiovascular events, possibly preventing increasing costs for drug therapy.
References
- 1. Lind L, Lithell H, Pollare T. Is it hyperinsulinemia or insulin resistance that is related to hypertension and other metabolic cardiovascular risk factors? J Hypertens Suppl. 1993;11:S11–S116. [PubMed] [Google Scholar]
- 2. Genest J Jr, Cohn JS. Clustering of cardiovascular risk factors: targeting high‐risk individuals. Am J Cardiol. 1995;76:8A–20A. [DOI] [PubMed] [Google Scholar]
- 3. Mancini M, Ferrara LA, Strazzullo P, Marotta T. Metabolic disturbances and antihypertensive therapy. J Hypertens. 1991;9(suppl 3):47–50. [PubMed] [Google Scholar]
- 4. Ferrara LA, Cardoni O, Mancini M, Zanchetti A. Metabolic syndrome and left ventricular hypertrophy in a general population. Results from the Gubbio study. J Hum Hypertens. 2007;21:795–801. [DOI] [PubMed] [Google Scholar]
- 5. Alberti KG, Eckel RH, Grundy SM, et al. International Diabetes Federation Task Force on Epidemiology and Prevention; Hational Heart, Lung, and Blood Institute; American Heart Association; World Heart Federation; International Atherosclerosis Society; International Association for the Study of Obesity Harmonizing the metabolic syndrome: a joint interim statement of the International Diabetes Federation Task Force on Epidemiology and Prevention; National Heart, Lung, and Blood Institute; American Heart Association; World Heart Federation; International Atherosclerosis Society; and International Association for the Study of Obesity. Circulation. 2009;120:1640–1645. [DOI] [PubMed] [Google Scholar]
- 6. Mancia G, De Backer G, Dominiczak A, et al. The Task Force for the Management of Arterial Hypertension of the European Society of Hypertension; The Task Force for the Management of Arterial Hypertension of the European Society of Cardiology 2007 guidelines for the management of arterial hypertension: the task force for the management of arterial hypertension of the European Society of Hypertension (ESH) and of the European Society of Cardiology (ESC). Eur Heart J. 2007;28:1462–1536. [DOI] [PubMed] [Google Scholar]
- 7. Ferrara LA, Ricci F, Viola S, et al. Dietary pattern and blood pressure control in the hypertension outpatient clinic. Hypertens Res. 2007;30:1043–1050. [DOI] [PubMed] [Google Scholar]
- 8. Friedewald WT, Lery RI, Fredrickson DS. Estimation of plasma low density lipoprotein cholesterol concentration without use of the preparative ultracentrifuge. Clin Chem. 1972;18:499–502. [PubMed] [Google Scholar]
- 9. Ciccarone E, Di Castelnuovo A, Salcuni M, et al; Gendiabe Investigators . A high‐score Mediterranean dietary pattern is associated with a reduced risk of peripheral arterial disease in Italian patients with type 2 diabetes. J Thromb Haemost. 2003;1:1744–1752. [DOI] [PubMed] [Google Scholar]
- 10. Anderson KM, Odell PM, Wilson PWF, Kannel WB. Cardiovascular disease risk profiles. Am Heart J. 1990;121:293–298. [DOI] [PubMed] [Google Scholar]
- 11. Neter JE, Stam BE, Kok FJ, et al. Influence of weight reduction on blood pressure: a meta‐analysis of randomized controlled trials. Hypertension. 2003;42:878–884. [DOI] [PubMed] [Google Scholar]
- 12. The Look AHEAD Research Group . Long‐term effects of a lifestyle intervention on weight and cardiovascular risk factors in individuals with type 2 diabetes mellitus: four‐year results of the look AHEAD trial. Arch Intern Med. 2010;170:1566–75. [DOI] [PMC free article] [PubMed] [Google Scholar]
- 13. Wood PD, Stefanick ML, Dreon DM, et al. Changes in plasma lipids and lipoproteins in overweight men during weight loss through dieting as compared with exercise. N Engl J Med. 1988;319:1173–1179. [DOI] [PubMed] [Google Scholar]
- 14. Tsai AG, Wadden TA. Treatment of obesity in primary care practice in the United States: a systematic review. J Gen Intern Med. 2009;24:1073–9. [DOI] [PMC free article] [PubMed] [Google Scholar]
- 15. Stevens VJ, Obarzanek E, Cook NR, et al. Long‐term weight loss and changes in blood pressure: results of the trials of hypertension prevention, phase II. Ann Intern Med. 2001;134:1–11. [DOI] [PubMed] [Google Scholar]
- 16. Appel LJ, Clark JM, Yeh HC, et al; Comparative effectiveness of weight‐loss interventions in clinical practice. N Engl J Med. 2011;365:1959–1968. [DOI] [PMC free article] [PubMed] [Google Scholar]
- 17. Delahanty LM. An expanded role for dietitians in maximising retention in nutrition and lifestyle intervention trials: implications for clinical practice. J Hum Nutr Diet.. 2010;23:336–343. [DOI] [PubMed] [Google Scholar]
- 18. Grover AS, Lowensteyn I, Joseph L, et al. Discussing coronary risk with patients to improve blood pressure treatment: secondary results from the CHECK‐UP study. J Gen Intern Med. 2009;24:33–9. [DOI] [PMC free article] [PubMed] [Google Scholar]
- 19. Grover AS, Lowensteyn I, Joseph L, et al, for the Cardiovascular Health Evaluation to Improve Compliance and Knowledge Among Uninformed Patients (CHECK‐UP) Study Group . Patient knowledge of coronary risk profile improves the effectiveness of dyslipidemia therapy. The CHECK‐UP study: a randomized controlled trial. Arch Intern Med. 2007;167:2296–2303. [DOI] [PubMed] [Google Scholar]
- 20. Smith West D, Gorin AA, Subak LL, et al, for the Program to Reduce Incontinence by Diet and Exercise (PRIDE) Research Group . A motivation‐focused weight loss maintenance program is an effective alternative to a skill‐based approach. Int J Obes. 2011;35:259–269. [DOI] [PMC free article] [PubMed] [Google Scholar]