Hypertension affects approximately 65 million individuals in the United States. 1 Despite the development of increasingly effective antihypertensive treatments over the past 4 decades, the incidence of hypertensive emergencies has not decreased, but rather may have increased. 2 Although there is some seasonal variation in blood pressure (BP), 3 , 4 there are no data on seasonal variation in hospitalizations for hypertensive emergencies. This variation in BP may affect hospitalizations rates and increased health care burden. 5 The increase in BP in winter might be related to increased sympathetic tone due to increased plasma and urinary norepinephrine concentrations. 6 This chronobiological predisposition to increased BP in colder months may be the basis for increased risk of stroke and acute myocardial infarction in the winter season. 7 , 8 We assessed seasonal variation in admissions for hypertensive emergency from a large national hospitalization database.
We examined the Nationwide Inpatient Sample (NIS) from 2000 to 2007. We used this dataset to gather information on the number of hospitalizations with a primary diagnosis of a hypertensive emergency using the International Classification of Disease—9th Revision codes. NIS is a nationally representative survey of hospitalizations conducted by the Healthcare Cost and Utilization Project in collaboration with participating states. It is the largest all‐payer inpatient dataset in the United States and includes a 20% sample of US community hospitals that approximates 20% of all US community hospitals. 9 Each entry also contains information on demographic details, including age, sex, race; insurance status; primary and secondary procedures; hospitalization outcome; total cost; and length of hospital stay. The NIS database also contains clinical and resource use information, with safeguards to protect the privacy of patients, physicians, and hospitals. The NIS database results have been shown to correlate well with other hospitalization discharge databases in the United States. 10 The frequency of hospitalization for each month cumulative over 8 years was calculated and divided by number of days in that month to obtain the mean hospitalizations per day for each month. All calculations were carried out using the weighted estimates approximating nationwide population estimates.
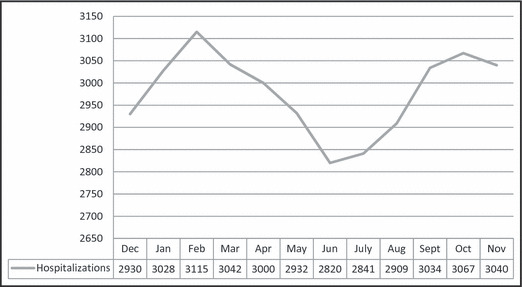
An estimated 456,259±12,386 (mean±standard error) hospitalizations for a hypertensive emergency occurred in the United States from the beginning of the calendar year 2000 to the end of the calendar year 2007. These comprised 0.16% of all admissions in 2000 and 0.19% of all admissions in 2007. 2 The number of hospitalizations per day in each month is shown in the Figure. In general, the number of hospitalization was maximum in the winter months and minimum in summer months. More specifically, the mean number of hospitalization each day (averaged over 8 years) was least in June (2820). There was a rising trend from June to February. The average number of hospitalization was highest in February (3115); thereafter, the hospitalization rate dropped to a nadir in June.
Figure FIGURE.

Mean number of hypertensive emergency hospitalizations per day in each month.
Using the NIS database, we identified an impressive pattern of seasonal variation in hospitalizations for hypertensive emergency, with a significant increased frequency during colder months and lower frequency in warmer months. Previous studies have indeed documented a significant negative correlation between ambient temperature and BP. 5 The present observation suggests a need for aggressive follow‐up of patients for increase in BP in colder months. The seasonal variation in BP may also impact the frequency of cardiovascular event risk in winter months. The winter peak in hypertensive emergency hospitalizations is a remarkable translation of hypothesis‐generating studies into health care delivery outcomes.
Funding
None.
Conflict of interest
None of the authors have any conflict of interest and have participated, written, and agreed to this manuscript content.
References
- 1. Ostchega Y, Yoon SS, Hughes J, Louis T Hypertension awareness, treatment, and control—continued disparities in adults: United States, 2005–2006. http://www.cdc.gov/nchs/data/databriefs/db03.pdf. Accessed September 1, 2011. [PubMed]
- 2. Deshmukh A, Kumar G, Kumar N, et al. Effect of joint national committee VII report on hospitalizations for hypertensive emergencies in the United States. Am J Cardiol. Nov 2011;108:1277–1282. [DOI] [PubMed] [Google Scholar]
- 3. Brown GE. Daily and monthly rhythm in blood pressure of man with hypertension. Ann Intern Med. 1930;3:1177–1189. [Google Scholar]
- 4. Rose G. Seasonal variation in blood pressure in man. Nature. Jan 1961;189:235. [DOI] [PubMed] [Google Scholar]
- 5. Alperovitch A, Lacombe JM, Hanon O, et al. Relationship between blood pressure and outdoor temperature in a large sample of elderly individuals: the three‐city study. Arch Intern Med. Jan 2009;169:75–80. [DOI] [PubMed] [Google Scholar]
- 6. Hanna JM. Climate, altitude, and blood pressure. Hum Biol. Aug 1999;71:553–582. [PubMed] [Google Scholar]
- 7. Wang Y, Levi CR, Attia JR, et al. Seasonal variation in stroke in the Hunter region, Australia: a 5‐year hospital‐based study, 1995–2000. Stroke. May 2003;34:1144–1150. [DOI] [PubMed] [Google Scholar]
- 8. Spencer FA, Goldberg RJ, Becker RC, Gore JM. Seasonal distribution of acute myocardial infarction in the second national registry of myocardial infarction. J Am Coll Cardiol. May 1998;31:1226–1233. [DOI] [PubMed] [Google Scholar]
- 9. Steiner C, Elixhauser A, Schnaier J. The healthcare cost and utilization project: an overview. Eff Clin Pract. 2002;5:143–151. [PubMed] [Google Scholar]
- 10. Whalen D, Houchens R, Elixhauser A. 2004. HCUP Nationwide Inpatient Sample (NIS) Comparison Report. HCUP Methods Series Report # 2007‐03 Online February 2, 2007. US Agency for Healthcare Research and Quality.


