

Abstract
J Clin Hypertens (Greenwich). 2012; 14:580–587. © 2012 Wiley Periodicals, Inc.
Blockade of the renin‐angiotensin‐aldosterone system (RAAS) is an established method to lower blood pressure in patients with hypertension. Aldosterone, the end product of the RAAS cascade, acts by increasing salt reabsorption in the kidney and catecholamine release from the adrenal medulla. Currently available aldosterone inhibitors have the disadvantage of increasing circulating aldosterone and thus may lead to aldosterone breakthrough. Aldosterone synthase inhibition (ASI) is a novel approach to suppressing the RAAS. Due to homology between the enzymes responsible for aldosterone synthesis (CYP11B2) and cortisol synthesis (CYP11B1), the blockade of aldosterone synthesis may also suppress cortisol release. The authors evaluated the effect of the novel ASI LCI699 on the cortisol response to adrenocorticotropic hormone (ACTH) stimulation in patients with hypertension in order to find the maximally tolerated dose (MTD) in this patient population. Among the 63 patients evaluated, there was a dose‐ and time‐dependent effect of LCI699 on both aldosterone and ACTH‐stimulated cortisol. Based on exposure‐response analysis, the MTD was estimated to be 1.30 mg once daily with a 90% prediction interval of 0.88 mg once daily to 1.81 mg once daily. No patients required intervention for adrenal insufficiency. LCI699 was well tolerated with no serious adverse events.
Suppression of the renin‐angiotensin‐aldosterone system (RAAS) is an important therapeutic strategy in the treatment of chronic heart and kidney disease. However, the phenomenon known as “aldosterone breakthrough,” where plasma aldosterone levels become elevated despite RAAS‐based therapy, has been observed following prolonged treatment with angiotensin‐converting enzyme (ACE) inhibitors or angiotensin receptor blockers (ARBs). Such aldosterone breakthrough may contribute to treatment‐resistant hypertension or the progression of chronic heart failure. 1
Aldosterone receptor blockade is a proven therapeutic option for lowering blood pressure (BP) in patients with resistant hypertension 2 , 3 and reducing morbidity and mortality in patients with heart failure. 4 , 5 , 6 , 7 , 8 The mineralocorticoid receptor antagonists (MRAs) eplerenone and spironolactone effectively block the action of aldosterone by preventing aldosterone binding to its receptor. However, aldosterone receptor blockade can lead to a compensatory increase in aldosterone secretion that may: (1) enhance nongenomic effects on the heart and coronary arteries; (2) affect tissues not protected by the receptor blocker, such as the brain; and (3) require still higher doses of the blocker. 9
Inhibition of aldosterone synthesis has the potential to reduce circulating aldosterone levels. Therefore, aldosterone synthase inhibitors (ASIs) might be expected to exert beneficial effects beyond those observed with mineralocorticoid receptor blockade and could represent an alternative and viable approach to these agents for the treatment of resistant hypertension and heart failure. 9
LCI699, a potent, orally administered ASI was previously tested in patients with primary aldosteronism. This study showed that LCI699, at doses up to 1.0 mg twice daily, effectively inhibited aldosterone synthase in these patients. 10
Homology exists between aldosterone synthase and the enzyme responsible for cortisol synthesis, 11 and therefore it was important to assess and characterize the selectivity of LCI699 inhibition, particularly with respect to suppression of cortisol levels.
The current exploratory study was intended to further characterize the relationship between LCI699 exposure and cortisol function in patients with hypertension in order to determine the maximally tolerated dose (MTD) of LCI699 based on suppression of the cortisol response to adrenocorticotropic hormone (ACTH) stimulation.
Methods
Study Design
This was a 6‐week, prospective, randomized, double‐blind, placebo‐controlled study of LCI699 (4‐[(5R)‐6,7‐Dihydro‐5H‐pyrrolo[1,2‐c]imidazol‐5‐yl]‐3‐fluorobenzonitrile phosphate; Figure S1) in patients with hypertension conducted at 9 centers in the United States and 1 center in Iceland. The study protocol was approved by the independent ethics committee or institutional review board of each center, and the study was conducted in accordance with Good Clinical Practice guidelines and the ethical principles of the Declaration of Helsinki. All patients provided written informed consent before being enrolled. The trial is registered with ClinicalTrials.gov, identifier NCT00817414.
Figure 1.
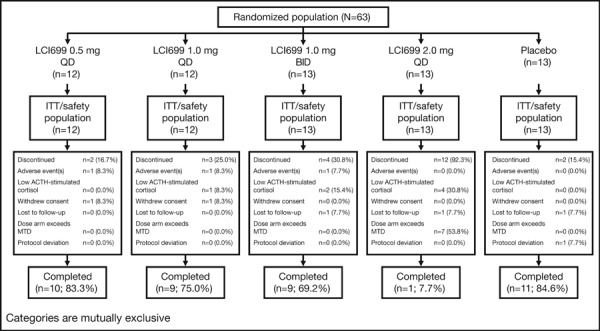
Patient disposition. QD indicates once daily; BID, twice daily; ITT, intention to treat; ACTH, adrenocorticotropic hormone; MTD, maximally tolerated dose.
The study was double‐blind in that the patient, investigator, and contract research organization (CRO) for site monitoring and data management were not aware of the treatment. However, the medical monitor and the trial statistician were unblinded so that the cortisol response to ACTH stimulation could be monitored in order to protect patient safety. Blinding was maintained throughout the study by use of active and placebo capsules of similar appearance.
This study used a sequential cohort, escalating dose design with up to 3 potential cohorts, each with approximately 30 patients (Figure S2).
Figure 2.
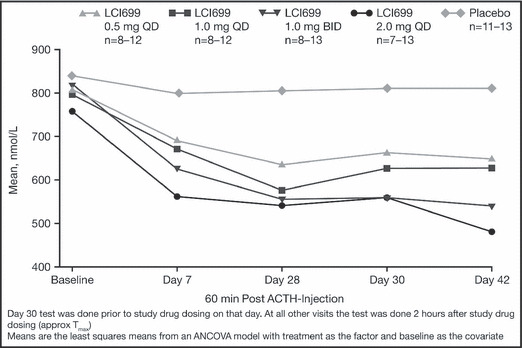
Mean adrenocorticotropic hormone (ACTH)–stimulated cortisol values at 1 hour after ACTH injection by visit and treatment group. QD indicates once daily; BID, twice daily.
Within each cohort, patients were randomized (1:2:2) to either placebo or 1 of 2 different LCI699 dose levels to identify the MTD based on the cortisol response to ACTH stimulation.
In the first cohort, eligible patients were randomized to placebo, LCI699 0.5 mg once daily or 1.0 mg once daily. If the LCI699 MTD was not observed at total daily doses up to 1.0 mg, then enrolment would proceed into the second cohort, where patients were to be randomized to placebo, LCI699 1.0 mg twice daily or 2.0 mg once daily. If the LCI699 MTD was not observed at total daily doses up to 2.0 mg, then enrolment would proceed to the third cohort (highest‐dose cohort), where patients were to be randomized to placebo, LCI699 1.5 mg twice daily or 3.0 mg once daily. Note that the third cohort was not initiated, as the 2.0 mg once‐daily dose in the second cohort met the protocol‐defined criteria for declaring the MTD.
In order to limit exposure to doses above the MTD and, at the same time, limit the likelihood of falsely dropping a dose arm, a simple stopping rule was applied. A dose at which 4 of 12 patients met the ACTH‐stimulated cortisol stopping criteria (<400 nmol/L at 30 and 60 minutes for an ACTH test at a single visit or at either time point on 2 consecutive visits) was discontinued and was considered to be at or above the MTD. The number 4 was chosen because it provides at least 79% probability that a whole dose arm will not be inadvertently dropped when the true probability of an individual patient discontinuing from the study due to cortisol suppression is ≤20% (ie, the dose is less than the MTD). Upon reaching the MTD, higher dose cohorts were not initiated. A dose was also discontinued for a given patient if they met the ACTH‐stimulated cortisol stopping criteria.
Patients
Men and women aged 18 to 75 years, weighing a minimum of 50 kg (110 lb), with an established diagnosis of essential hypertension currently taking at least 1 antihypertensive treatment and demonstrating elevated BP despite therapy were randomized into this trial. Hypertension was defined as mean sitting systolic BP (MSSBP) or mean sitting diastolic BP (MSDBP) ≥140/90 mm Hg and <180/110 mm Hg. Presence of antihypertensive treatment was assessed at screening (between days −28 and −14) and confirmed within 2 weeks of randomization during the run‐in period (between days −14 and −2).
Patients were required to have a basal morning plasma cortisol (sampled between 8 am and 9 am) >250 nmol/L and 30 or 60 minutes post‐ACTH plasma cortisol >500 nmol/L during the run‐in period (between days −14 and −2).
Patients taking a stable regimen of antihypertensive medications (limited to ACE inhibitors, ARBs, thiazide diuretics, loop diuretics, β‐blockers, and/or calcium channel blockers (CCBs) during the 4 weeks before screening were considered for participation.
Patients taking aldosterone receptor antagonists, direct renin inhibitors, or potassium‐sparing diuretics within 4 weeks of screening were excluded from the study.
The main exclusion criteria included:
-
•
Recent history (within past 6 months) of myocardial infarction, heart failure, unstable angina, coronary artery bypass graft, percutaneous coronary intervention, hypertensive encephalopathy, cerebrovascular accident, or transient ischemic attack;
-
•
Clinically significant cardiac conduction defects, eg, third‐degree atrioventricular block, left bundle branch block, sick sinus syndrome, atrial fibrillation, or flutter); familial long QT syndrome; or torsades de pointe;
-
•
Renal impairment (estimated creatinine clearance <50 mL/min by the Modification of Diet in Renal Disease formula);
-
•
Use of oral, parenteral, topical, inhaled, or ophthalmic corticosteroids within 4 weeks of randomization.
-
•
Pregnancy or currently nursing;
-
•
Type 1 diabetes or type 2 diabetes mellitus with poor glucose control as defined by hemoglobin A1c >9%;
-
•
History of heart failure (New York Heart Association class II through IV) or clinically significant valvular heart disease; and
-
•
History or evidence of a secondary form of hypertension.
Assessments
After a 2‐week run‐in period, patients were randomized either to placebo or 1 of 2 dosing regimens in each cohort and treated for 6 weeks with the study drug followed by a 2‐week follow‐up visit (day 56).
The following criteria were evaluated throughout the duration of the study.
ACTH‐stimulated cortisol Cortisol level in response to ACTH stimulation was measured during the run‐in period (between days −14 and −2) and at day 7, day 28, day 30, and day 42. Cortisol level was measured following ACTH stimulation where an intravenous injection of 250 μg of synthetic ACTH was administered. Blood samples for measurement of cortisol were obtained immediately prior to injection and at 30 and 60 minutes post‐injection. All cortisol levels were measured at the central laboratory. MTD was defined by the protocol as the dose at which 4 patients exhibited ACTH‐stimulated cortisol results <400 nmol/L at 30 and 60 minutes for a single visit or at either time point for consecutive visits following ACTH administration.
BP assessments Office BP (OBP) was measured throughout the study at all 12 scheduled office visits. Arterial BP determinations were made using an automated device in accordance with the guidelines for management of hypertension: Report of the Fourth Working Party of the British Hypertension Society. 12 Both sitting and standing BP measurements were performed at trough (23–26 hours post‐morning dose). The arm with the higher systolic BP was determined at visit 2 and used at all subsequent visits. Measurements were made after the patient had been sitting for 5 minutes and were repeated 4 times with 2‐minute intervals between measurements using the automatic BP monitor and an appropriate sized cuff. The mean of the last 3 measurements were recorded.
Pharmacokinetic and pharmacodynamic assessments LCI699 plasma concentrations were measured at the day 42 visit. All patients with sufficient LCI699 plasma concentration values for estimation of pharmacokinetic (PK) parameters (above the lower limit of quantification) at the day 42 visit were included in the PK data analysis. Samples were analyzed for LCI699 concentration using a validated liquid chromatography‐tandem mass spectrometry assay.
Blood samples were collected and processed for measurement of plasma aldosterone concentrations at run‐in (between days −14 and −2), day 28, day 42, and at follow‐up (day 56).
Safety assessments Safety assessments consisted of monitoring and recording all adverse events (AEs) and serious adverse events (SAEs) for severity and relationship to study drug. Safety monitoring also included laboratory evaluations of hematology, clinical blood chemistry, urinalysis, hormonal profile, regular assessments of vital signs, physical condition (including 12‐lead electrocardiography), and body weight.
Objectives/ End Points
The primary objective was to determine the MTD of LCI699 with respect to cortisol suppression following ACTH stimulation in patients with hypertension. Secondary objectives were to characterize the LCI699 exposure‐response relationship on cortisol levels following ACTH stimulation in patients with hypertension and the pharmacokinetics of LCI699 in patients with hypertension, to assess the safety and tolerability of LCI699 in patients with hypertension, and to explore the proportion of patients achieving successful BP control in all treatment groups for 23 to 26 hours post‐dose (11–14 hours post‐dose for the twice‐daily regimen) MSSBP and MSDBP after 6 weeks of treatment.
Statistical Analysis
Trial performance was assessed (prior to the start of the study) using classical statistical approaches and simulation techniques. Specifically, based on clinical trial simulations, it was determined that the proposed design was well suited to define the LCI699 MTD.
Demographic and other relevant baseline characteristics are presented descriptively using summary statistics as appropriate. Summary statistics pooled across all treatments are included. An assessment of differences in the distribution of baseline characteristics across treatments was performed using chi‐square test for categorical variables (excluding medical histories of low prevalence) and one‐way analysis of variance (F test) for continuous variables.
Pharmacokinetic parameters were calculated using noncompartmental methods as implemented in WinNonlin (Pharsight Inc, London, England) for each patient based on LCI699 plasma concentrations measured at the day 42 visit using actual sampling times.
A mixed effects regression model was used to characterize the relationship between the plasma concentration of LCI699 and cortisol concentrations following ACTH stimulation. The model included terms for basal cortisol levels, basal cortisol response to ACTH stimulation, time relative to ACTH stimulation, LCI699 plasma concentration, and duration of LCI699 treatment. This exposure‐response model was used to determine the dose(s) at which no more than 20% of patients were expected to experience cortisol suppression <400 nmol/L. Based on the estimated relationship between the LCI699 dose and cortisol response, the probability of failing the ACTH stimulation test at the time of peak study drug concentration was calculated (both point estimates and 90% prediction intervals) for the LCI699 doses and regimens of interest.
For analysis of covariance (ANCOVA) analyses, all P values and confidence intervals were two‐sided and determined at the 5% level of significance. No multiplicity adjustments were made.
The change from baseline to each visit and the change from baseline to the final visit on drug treatment (day 43, last observation carried forward) in MSSBP and MSDBP were analyzed using one‐way ANCOVA model with baseline BP as the continuous covariate and treatment as the class effect.
Results
A total of 63 patients with an established diagnosis of essential hypertension currently taking at least one antihypertensive treatment and demonstrating elevated BP were randomized and all received treatment with study medication.
Twenty‐three patients (36.5%) were prematurely discontinued from the study. Seven (11.1%) of the 23 discontinued as a result of low ACTH‐stimulated cortisol response. All of these patients received LCI699: 1 patient in the 1.0 mg once‐daily group, 2 in the 1.0 mg twice‐daily group, and 4 in the 2.0 mg once‐daily group. ACTH‐stimulated cortisol returned to >500 nmol/L in all 7 cases, typically within 1 to 2 weeks of stopping the study drug. Seven additional patients were discontinued early because the LCI699 2.0 mg once‐daily dose exceeded the protocol‐specified stopping criteria for MTD. Nine other patients (14.3%) withdrew for other reasons (Figure 1).
Only the first two cohorts were studied, as the protocol‐specified criteria for an MTD was met at the 2.0 mg once‐daily dose in cohort 3.
Baseline Characteristics
Patient demographics and baseline disease characteristics were similar across the five treatment groups (Table I). All patients were taking antihypertensive drugs. Diuretics were the most frequently used antihypertensive agents (39.7%), followed by ACE inhibitors (33.3%), β‐blockers (30.2%), CCBs (28.6%), and ARBs (25.4%).
Table I.
Patient Demographics and Baseline Disease Characteristics by Treatment Group
| Demographic Variable | LCI699 0.5 mg QD (n=12) | LCI699 1.0 mg QD (n=12) | LCI699 1.0 mg BID (n=13) | LCI699 2.0 mg QD (n=13) | Placebo (n=13) | Overall Total (N=63) |
|---|---|---|---|---|---|---|
| Age, mean (SD), y | 56.1 (6.37) | 54.2 (16.01) | 57.9 (9.09) | 56.2 (10.37) | 56.8 (10.08) | 56.3 (10.52) |
| Age group, No. (%) | ||||||
| <65 y | 11 (91.7) | 7 (58.3) | 10 (76.9) | 9 (69.2) | 8 (61.5) | 45 (71.4) |
| ≥65 y | 1 (8.3) | 5 (41.7) | 3 (23.1) | 4 (30.8) | 5 (38.5) | 18 (28.6) |
| Sex, No. (%) | ||||||
| Male | 8 (66.7) | 7 (58.3) | 10 (76.9) | 8 (61.5) | 9 (69.2) | 42 (66.7) |
| Female | 4 (33.3) | 5 (41.7) | 3 (23.1) | 5 (38.5) | 4 (30.8) | 21 (33.3) |
| Baseline BMI, mean (SD), kg/m2 | 31.19 (6.563) | 33.63 (4.853) | 32.73 (5.399) | 30.70 (4.158) | 34.45 (6.196) | 32.54 (5.505) |
| Duration of hypertension, mean (SD), y | 10.9 (8.45) | 11.7 (12.46) | 7.8 (9.25) | 10.2 (8.15) | 11.4 (7.63) | 10.4 (9.10) |
| Antihypertensive medications, No. | ||||||
| 1 | 5 (41.7) | 7 (58.3) | 6 (46.2) | 6 (46.2) | 6 (46.2) | 30 (47.6) |
| 2 | 5 (41.7) | 2 (16.7) | 4 (30.8) | 5 (38.5) | 6 (46.2) | 22 (34.9) |
| 3 | 1 (8.3) | 3 (25.0) | 3 (23.1) | 1 (7.7) | 1 (7.7) | 9 (14.3) |
| 4 | 1 (8.3) | 0 | 0 | 1 (7.7) | 0 | 2 (3.2) |
| Baseline GFR, mean (SD), mL/min | 89.5 (18.90) | 89.1 (18.46) | 81.8 (17.08) | 78.4 (18.03) | 85.8 (28.15) | 84.8 (20.38) |
| Type 2 diabetes, No. (%) | 2 (16.7) | 4 (33.3) | 4 (30.8) | 1 (7.7) | 3 (23.1) | 14 (22.2) |
| MSSBP, mean (SD), mm Hg | 151.1 (12.23) | 149.4 (13.22) | 145.2 (12.15) | 146.2 (11.02) | 140.2 (10.57) | 146.3 (12.07) |
| MSDBP, mean (SD), mm Hg | 87.8 (12.68) | 90.4 (10.60) | 88.9 (8.75) | 85.6 (10.56) | 86.8 (8.17) | 87.8 (10.03) |
| Mean sitting pulse, mean (SD), beats per min | 64.9 (12.98) | 76.4 (12.30) | 76.7 (10.95) | 62.5 (4.94) | 69.8 (11.08) | 70.1 (11.95) |
Abbreviations: BID, twice daily; BMI, body mass index; GFR, glomerular filtration rate; MSDBP, mean sitting diastolic blood pressure; MSSBP, mean sitting systolic blood pressure; QD, once daily; SD, standard deviation.
ACTH‐Stimulated Cortisol
LCI699 suppressed the ACTH‐stimulated cortisol response in a dose‐ and time‐dependent manner, with the majority of the effect apparent by day 7 of treatment. Among the 4 LCI699 treatment groups, between 56% and 89% of the suppression observed at day 28 was apparent at day 7, with little additional effect observed at subsequent visits (Figure 2).
Given the protocol‐defined MTD of 20% of patients experiencing ACTH‐stimulated cortisol <400 nmol/L, the MTD, based on exposure‐response analysis, was estimated to be 1.30 mg once daily with a 90% prediction interval of 0.88 mg once daily to 1.81 mg once daily. No patients exhibited the signs or symptoms of adrenal insufficiency.
There was no marked difference in the ACTH‐stimulated cortisol response when evaluated at peak and trough concentrations (measured at day 28 vs day 30) of LCI699, suggesting that reversal of the cortisol suppression was not acute.
There were no marked differences between LCI699 1.0 mg twice daily and 2.0 mg once daily in the mean ACTH‐stimulated cortisol response.
Plasma Aldosterone
Suppression of plasma aldosterone was measured at all visits during LCI699 treatment and in all dose groups, with placebo‐adjusted geometric mean reductions ranging from approximately 50% to 80% at all LCI699 doses studied. All reductions achieved statistical significance (P<.05), except for the LCI699 2.0 mg once‐daily dose group at day 42, which had a small sample size.
Pharmacokinetics
Following oral administration, LCI699 appeared to be rapidly absorbed, with peak plasma concentrations (Cmax) occurring approximately 1 hour post‐dose. After reaching Cmax, LCI699 plasma concentrations declined with an apparent half life of 3.8 to 5.5 hours across the dose range studied. LCI699 exposure increased with dosage (Figure 3; Table II), although dose proportionality was not assessed due to the small sample size and the potential for nonrandom censoring as a result of the study design.
Figure 3.
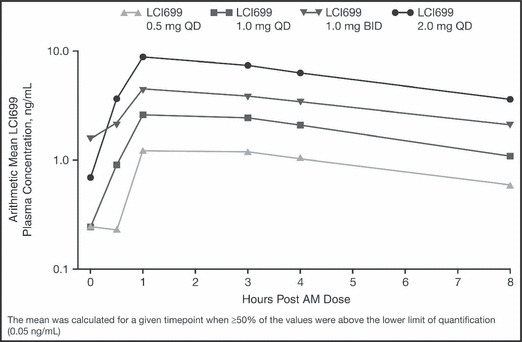
Arithmetic means of LCI699 plasma concentrations on day 42. AM indicates morning. QD indicates once daily; BID, twice daily.
Table II.
LCI699 Plasma Pharmacokinetic Parameter Summary Statistics Following the Last Dose of Study Medication (Day 42)
| Treatment group | No. | Cmax, ng/mL | Tmax a, h | AUC0–8, ngah/mL | AUC0–τ, ngah/mL | t1/2, h |
|---|---|---|---|---|---|---|
| LCI699 0.5 mg QD | 10b | 1.42 (36%) | 2.21 (1.0–4.0) | 6.60 (42%) | 9.23 (50%) | 4.67 (37%) |
| LCI699 1.0 mg QD | 7b | 2.94 (35%) | 1.00 (1.0–4.0) | 14.1 (30%) | 18.8 (51%) | 3.79 (43%) |
| LCI699 1.0 mg BID | 12b | 4.62 (35%) | 1.00 (0.5–4.0) | 24.1 (39%) | 30.6 (41%) | 5.52 (33%) |
| LCI699 2.0 mg QD | 4 | 8.86 (21%) | 1.00 (1.0–3.0) | 46.4 (13%) | 68.9 (19%) | 4.90 (17%) |
Abbreviations: BID, twice daily; QD, once daily. aMedian (range). bNumber is reduced by one for the area under curve (AUC) and half‐life (t1/2) parameters. Values are expressed as geometric mean (coefficient of variation percent).
Efficacy
All 4 LCI699 dose groups showed mean reductions in MSSBP from baseline to day 43, but only the 2 highest LCI699 dose groups (1.0 mg twice daily and 2.0 mg once daily) had statistically significant reductions compared with placebo (−12.5 mm Hg, P=.022 and −10.9 mm Hg, P=.046, respectively). Mean placebo‐adjusted reductions from baseline in MSSBP of 10 mm Hg to 15 mm Hg were observed at day 7 and continued through day 42 in these groups. The lower‐dose groups (0.5 mg once daily and 1.0 mg once daily) generally showed smaller placebo‐adjusted reductions from baseline (5–9 mm Hg).
All 4 LCI699 dose groups showed mean reductions in MSDBP from baseline to day 43, but only 2 of the LCI699 dose groups (1.0 mg once daily and 1.0 mg twice daily) had statistically significant reductions compared with placebo (−9.1 mm Hg, P=.009 and −9.2 mm Hg, P=.007, respectively) (Figure 4).
Figure 4.
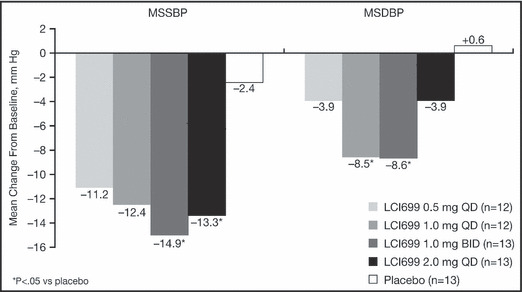
Change from baseline in mean seated systolic blood pressure (MSSBP) and mean seated diastolic blood pressure (MSDBP) at day 43 last observation carried forward.
Safety and Tolerability
No deaths or SAEs occurred during the study. The majority of AEs were mild and considered unrelated to the study drug. Headache, abnormally low ACTH‐stimulated cortisol response, and dizziness were the most frequently reported AEs among patients treated with LCI699. Low ACTH‐stimulated cortisol response occurred in an LCI699 dose‐dependent manner. Otherwise, there were no notable differences between rates of AEs in the LCI699 treatment and placebo groups (Table SI).
Three patients were discontinued from the study because of hyponatremia (125–131 mmol/L; LCI699 0.5 mg once daily, n=1; 1.0 mg once daily, n=1; 1.0 mg twice daily, n=1). The patient in the 0.5 mg once‐daily group also experienced hyperkalemia (5.7 mmol/L) and the patient in the 1.0 mg twice daily group experienced generalized tremors. All cases of hyponatremia and hyperkalemia were considered mild and resolved on discontinuation of the study drug.
There were no clearly discernible trends in mean change from baseline in serum potassium across the 5 treatment groups studied. Mean change from baseline in serum sodium decreased slightly during treatment with LCI699 at doses ≥1.0 mg daily compared with placebo.
There were no discernible trends in mean change from baseline in serum creatinine across the 5 treatment groups studied. Mean changes from baseline in serum urea nitrogen (BUN) suggested a dose‐ and time‐dependent relationship of increasing BUN in the LCI699 groups. The magnitude of mean increases was small, ranging from 0.2 mmol/L to 1.6 mmol/L.
Mean increases from baseline in uric acid were observed in all LCI699 dose groups, compared with a mean reduction among patients receiving placebo. There did not appear to be a dose or time dependency to these changes and they were present at the follow‐up visit in 2 of the LCI699 groups. No patient experienced clinical symptoms of gout.
No patient experienced a total bilirubin outside the normal range during the study and no patient experienced an aspartate aminotransferase or alanine aminotransferase greater than three times the upper limit of normal.
Discussion
Results from this phase II, randomized, double‐blind, placebo‐controlled, multicenter study showed a dose‐ and time‐dependent effect of LCI699 on both aldosterone and ACTH‐stimulated cortisol in patients with hypertension.
Consistent with its intended mechanism of action (inhibition of aldosterone synthase), LCI699 demonstrated clinically meaningful reductions in both MSSBP and MSDBP compared with placebo. LCI699 has also been reported to reduce ambulatory BP in patients with primary aldosteronism. 10 However, the magnitude of the response in the present study should be interpreted with caution because of the limited sample size and discontinuation of the LCI699 2.0 mg once‐daily treatment group.
LCI699 demonstrated significant reductions in plasma aldosterone at all doses studied, ranging from approximately 50% to 80%. These results are consistent with previous findings in patients with primary aldosteronism and support the mechanism of action of ASI. 10
The MTD was estimated to be 1.30 mg once daily (0.88–1.81 mg once daily, 90% prediction interval) based on no more than 20% of patients achieving an ACTH‐stimulated cortisol response of <400 nmol/L. Despite this impairment of the ACTH‐cortisol axis, no patients exhibited the signs or symptoms of adrenal insufficiency.
These results support previous findings in patients with primary aldosteronism, where plasma ACTH concentrations increased by 35% after 0.5 mg of LCI699 (P=.08) and by 113% after 1.0 mg of LCI699 (P<.0001), and the cortisol response to an ACTH challenge was blunted. 10 Results of this study help to further characterize the relationship between LCI699 exposure and cortisol suppression.
Conclusions
This study confirmed dose dependence for inhibition of the ACTH stress test by LCI699 and demonstrated time dependence for its maximal development and reversal. In the study, LCI699 exhibited limited target selectivity, with evidence of ASI as well as off‐target impairment of cortisol synthesis. Although LCI699 did not provide selective ASI, BP was reduced, supporting the concept that this mechanism still holds promise as a novel antihypertensive class of drugs. LCI699 may be useful for other cardiovascular indications where lower doses may be effective or where both aldosterone inhibition and suppression of cortisol activity may be of benefit.
Acknowledgments and disclosures: The results presented in this paper have not been published previously in whole or in part. The authors report no specific funding in relation to this manuscript and no conflicts of interest to disclose. The study was funded by Novartis, and authors at the Great Lakes Drug Development had a consultancy agreement with Novartis for the duration of the study. We would like to thank Jennifer Pollard, BSc, MSc, of CircleScience, UK, for providing writing assistance and Integrium, LCC, for providing the site monitoring and data management support for the trial. This support was also funded by Novartis.
Supporting information
Figure S1. LCI699 (4‐[(5R)‐6,7‐Dihydro‐5H‐pyrrolo [1,2‐c]imidazol‐5‐yl]‐3‐fluorobenzonitrile phosphate).
Figure S2. Study design.
Table SI. Overall and most frequently occurring AEs – n (percent) of patients (≥2 across the LCI699 treatment groups).
Supporting info item
Supporting info item
Supporting info item
References
- 1. Bomback AS, Klemmer PJ. The incidence and implications of aldosterone breakthrough. Nat Clin Pract Nephrol. 2007;3:486–492. [DOI] [PubMed] [Google Scholar]
- 2. Chobanian AV, Bakris GL, Black HR, et al. Seventh report of the joint national committee on prevention, detection, evaluation, and treatment of high blood pressure. Hypertension. 2003;42:1206–1252. [DOI] [PubMed] [Google Scholar]
- 3. Mancia G, De Backer G, Dominiczak A et al. 2007 Guidelines for the management of arterial hypertension. J Hypertens. 2007;25:1105–1187. [DOI] [PubMed] [Google Scholar]
- 4. Pitt B, Zannad F, Remme WJ, et al. The effect of spironolactone on morbidity and mortality in patients with severe heart failure. Randomized Aldactone Evaluation Study Investigators. N Engl J Med. 1999;341:709–717. [DOI] [PubMed] [Google Scholar]
- 5. Pitt B, Remme W, Zannad F, et al. Eplerenone, a selective aldosterone blocker, in patients with left ventricular dysfunction after myocardial infarction. N Engl J Med. 2003;348:1309–1321. [DOI] [PubMed] [Google Scholar]
- 6. Hunt SA, Abraham WT, Chin MH et al. Focused update incorporated into the ACC/AHA 2005 guidelines for the diagnosis and management of heart failure in adults 2009. J Am Coll Cardiol. 2009;53:e1–e90. [DOI] [PubMed] [Google Scholar]
- 7. Dickstein K, Cohen‐Solal A, Filippatos G, et al. ESC guidelines for the diagnosis and treatment of acute and chronic heart failure 2008. Eur Heart J. 2008;29:2388–2442. [DOI] [PubMed] [Google Scholar]
- 8. Zannad F, McMurray JJ, Krum H, et al. for the EMPHASIS‐HF group. Eplerenone in patients with systolic heart failure and mild symptoms. N Engl J Med. 2011;364:11–21. [DOI] [PubMed] [Google Scholar]
- 9. Chai W, Danser JAH. Why are mineralocorticoid receptor antagonists cardioprotective? Naunyn-Schmiedeberg’s Arch Pharmacol. 2006;374:153–162. [DOI] [PMC free article] [PubMed] [Google Scholar]
- 10. Amar L, Azizi M, Menard J, et al. Aldosterone synthase inhibition with LCI699: a proof‐of‐concept study in patients with primary aldosteronism. Hypertension. 2010;56:831–838. [DOI] [PubMed] [Google Scholar]
- 11. Orth DN, Kovacs WJ. The adrenal cortex. In: Wilson JD, Foster DW, Kronenberg HM, Larsen PR, eds. Williams Textbook of Endocrinology, 9th edn. Philadelphia, PA: W.B. Saunders Co; 1988:517. [Google Scholar]
- 12. Williams B, Poulter NR, Brown MF et al. (2004) British Hypertension Society guidelines for hypertension management 2004 (BHS‐IV): summary. BMJ. 2004;328:634–640. [DOI] [PMC free article] [PubMed] [Google Scholar]
Associated Data
This section collects any data citations, data availability statements, or supplementary materials included in this article.
Supplementary Materials
Figure S1. LCI699 (4‐[(5R)‐6,7‐Dihydro‐5H‐pyrrolo [1,2‐c]imidazol‐5‐yl]‐3‐fluorobenzonitrile phosphate).
Figure S2. Study design.
Table SI. Overall and most frequently occurring AEs – n (percent) of patients (≥2 across the LCI699 treatment groups).
Supporting info item
Supporting info item
Supporting info item