

Abstract
J Clin Hypertens (Greenwich). 2012; 14:422–428. ©2012 Wiley Periodicals, Inc.
The authors tested the hypothesis that an aggressive antihypertensive treatment is beneficial in protecting against target organ damage (TOD) in patients with type 2 diabetes/prediabetes. The authors enrolled 60 patients with uncontrolled hypertension and diabetes/prediabetes and performed clinic, home, and ambulatory blood pressure (BP) monitoring. Irbesartan, amlodipine, and indapamide were used according to a titration schedule from step 1 to 5 for target home BP level ≤125/75 mm Hg. The flow‐mediated vasodilation (FMD), radial augmentation index (AI), pulse wave velocity (PWV), and urinary albumin excretion ratio (UACR), as a surrogate marker of TOD, were measured at baseline and 6 months. Compared with baseline, clinic, home, and ambulatory BP measures were significantly lower in the sixth month. FMD was increased significantly and AI, PWV, and UACR were reduced by the treatment. The extent of the changes in PWV and UACR were associated with the changes in all BP measures, but only the change in home morning BP was associated with the change in FMD. The change in AI was not associated with the change in BP levels, but was associated with the change in PWV. A very aggressive antihypertensive therapy guided by home morning BP was effective for surrogate end points in patients with diabetes/prediabetes.
To what extent blood pressure (BP) should be lowered in patients with type 2 diabetes is controversial. Most of the outcome trials of type 2 diabetes have shown that active treatment reduces cardiovascular outcomes. 1 , 2 , 3 However, the achieved BP was not very low and higher than the level described in the hypertension 4 , 5 , 6 and diabetes guidelines. 7 Some studies have tested the effects of very low target levels of BP, such as 120/70 mm Hg in the Action to Control Cardiovascular Risk in Diabetes (ACCORD) study, 8 128/75 mm Hg in the intensive group of the Appropriate Blood Pressure Control in Diabetes (ABCD) trial, 9 and 133/73 mm Hg for the valsartan group in the Nateglinide and Valsartan in Impaired Glucose Tolerance Outcomes Research (NAVIGATOR) trial. 10 However, these studies did not provide any evidence of a reduction of cardiovascular events. In the post hoc analyses of the Irbesartan Diabetic Nephropathy Trial (IDNT) 11 and the Perindopril Protection Against Recurrent Stroke Study (PROGRESS), 12 the lower BP levels were associated with better cardiovascular outcomes, but the Valsartan Antihypertensive Long‐Term Use Evaluation (VALUE) trial, 13 the Ongoing Telmisartan Alone and in Combination With Ramipril Global Endpoint Trial (ONTARGET), 14 and the International Verapamil SR‐Trandolapril Study (INVEST) trials 15 showed no such benefits. With regard to target organ protection, tight control of BP <130 mm Hg was shown to be associated with better renal outcomes. 16 Therefore, the effects of very aggressive antihypertensive treatments in type 2 diabetes are inconsistent and still uncertain for definitive recommendations on cardiovascular prognosis and target organ damage (TOD).
Out‐of‐office BP measures, such as home BP monitoring 17 , 18 , 19 and ambulatory BP monitoring (ABPM), 20 , 21 , 22 , 23 , 24 have been shown to be useful for the assessment of BP in type 2 diabetes. Because a substantial proportion of patients with diabetes show white‐coat hypertension 25 or masked hypertension, 26 , 27 , 28 clinic BP‐guided BP management may not always be sufficient for the management of hypertension in diabetic patients. In the Japanese hypertension guidelines, the BP goal at home was set to be <125/75 mm Hg. However, there have been few studies that investigated target home BP level <125/75 mm Hg as a guide of treatment in patients with diabetes. In the present study, we tested the hypothesis that a very aggressive antihypertensive treatment guided by home morning BP monitoring in patients with type 2 diabetes/prediabetes is effective in improving the measures of TOD.
Patients and Methods
The study protocol of this study was registered on a clinical trial registration site (University Hospital Medical Information Network Clinical Trials Registry No. UMIN000005541) as the APPROACH (Aggressive antihypertensive treatment for protecting cardiovascular complications in pre‐diabetic hypertensive patients) trial.
Study Patients
The participants consisted of Japanese hypertensive patients with type 2 diabetes or prediabetes. A total of 60 patients (mean age, 62.6±9.4 years; 51.7% men) were examined in this study, and the inclusion criteria were as follows: age 30 years and older; diagnosis of essential hypertension; and no known history of other significant medical factors or disorders, including congestive heart failure, acute myocardial infarction of <6 months, acute stroke of <6 months, atrial fibrillation, atrioventricular block, significant arrhythmia, hepatic damage (aspartate aminotransferase or alanine aminotransferase greater than twice the upper limit), renal failure (serum creatinine ≥2.0 mg/dL), allergy, allergic reaction, dementia preventing the provision of informed consent, pregnancy, and malignant disease. The patients were untreated or taking ≤2 antihypertensive medications, but their morning systolic BP at home was >135 mm Hg at baseline. Diabetes was defined as the presence of at least one of the following criteria: fasting plasma glucose >126 mg/dL, 2‐hour glucose in a 75‐g oral glucose tolerance test >200 mg/dL, hemoglobin A1c (HbA1c) >6.1%, or treatment with antidiabetic medications. Prediabetes was defined as HbA1c >5.7%. 29 Because hemoglobin A1c (Japan Diabetes Society) is approximately 0.4% lower than the international standard (National Glycohemoglobin Standardization Program), corresponding hemoglobin A1c levels are >6.5% for diabetes and >6.1% for prediabetes. 30 The ethics committees of the internal review board at Jichi Medical University School of Medicine, Tochigi, Japan, approved the protocol. Adverse events were evaluated by the adverse event committee in our institution. Written informed consent was obtained from each participant examined in this study.
Study Design
This study was a prospective, multicenter, single‐armed, and interventional study performed at two hospital clinics. The patients were observed for more than 2 weeks, then followed‐up monthly, and treated with antihypertensive drug therapy for up to 6 months. Baseline examinations were performed without medications (n=6) or with prior medications (n=53). At baseline, 3 consecutive BP measurements at two different visits were obtained. In treated patients, we did not set a washout period, and the antihypertensive medications were changed directly to those of step 1 or 2 (eg, step 1 for those who were treated with one medication, and step 2 with two medications). Patients were then treated according to the titration schedule. The titration of drug was scheduled to achieve a target home morning systolic BP (SBP) <125/75 mm Hg at the monthly visits. The steps were as follows: step 1: irbesartan 100 mg (begin treatment or switch from the others); step 2: irbesartan 100 mg+amlodipine 2.5 to 5 mg; step 3: irbesartan 100 mg+amlodipine 10 mg; step 4: irbesartan 200 mg+amlodipine 10 mg; and step 5: irbesartan 200 mg+amlodipine 10 mg+indapamide 1 mg.
When the patient did not reach the target BP level during the study period, no more antihypertensive medication were added and 6 months of follow‐up examinations were scheduled. Antidiabetic medications had been used in 14 patients (23.3%), and these drugs were not changed throughout the study periods.
Home BP Monitoring
Home BP was measured with a validated cuff oscillometric device (HEM‐5001; Omron Healthcare, Kyoto, Japan) according to the Japanese Society of Hypertension Guidelines for the Management of Hypertension. 6 This self‐measured home BP monitoring device automatically takes 3 measurements at 15‐second intervals on each occasion. We asked study patients to measure their morning home BP (measured after waking and before breakfast and taking antihypertensive medications) and evening home BP (measured before going to bed) in a sitting position. The first readings were discarded and the second and the third readings were used in this study, and morning and evening home BP values were calculated as the average for 7 days, thus the morning and evening home BP data consisted of 14 readings in total.
Each patient was asked to bring their home BP monitoring device to their clinic to show the home BP data to their physician. Each physician then checked on whether the average home morning SBP for the 1‐week period before visiting the clinic was ≥125/75 mm Hg in order to determine the proper titration of the drugs.
Clinic BP Measurement
Clinic BP was measured at baseline and at the monthly visits until the sixth month. Patients sat quietly with their backs supported, without crossing their legs, and with both arms supported at heart level for 5 minutes before the measurements were made. Clinic BP was measured at the clinics using the same device (HEM‐5001; Omron Healthcare) with 3 readings at 15‐second intervals, giving a total of 3 clinic readings at each visit. The second and the third measurement of BP readings were averaged and used for the analyses.
Ambulatory BP Monitoring
Noninvasive ABPM was carried out twice on a weekday with an automatic ABPM device (TM‐2431; A&D Co Inc, Tokyo, Japan), which recorded the BP and pulse rate by the oscillometric method every 30 minutes for 24 hours. The first ABPM was performed at baseline and the second ABPM was performed at the end of the sixth month of the treatment period. The average awake and sleep BP were calculated according to an individual’s diaries in‐bed and out‐of‐bed periods. Morning BP was defined as the average of 4 points (2 hours) after waking. These methods are described in detail in our previous publication. 31
Measures of TOD
Blood and urine samples were collected in the morning in a fasting state at baseline and at the sixth month of the study. Plasma/serum samples after separation and urine samples were stored at 4°C in refrigerated containers and sent to a commercial laboratory (SRL Inc, Tokyo, Japan) within 24 hours. The urinary albumin level was measured using a turbidimetric immunoassay (SRL Inc) and expressed as the urinary albumin excretion ratio (UACR, mg/g Cr). The estimated glomerular filtration rate (eGFR) was calculated using a validated equation based on the Modification of Diet in Renal Disease (MDRD) study with a Japanese coefficient of 0.881: eGFR (mL/min/1.73 m2) = 0.881 × 186.3 × age − 0.203 × S‐Cr − 1.154 (if female × 0.742). 32
Arterial stiffness was assessed by brachial‐ankle pulse wave velocity (baPWV), and arterial wave reflection was assessed by radial augmentation index (AI). The baPWV was measured using a volume‐plethysmographic device with 4 cuffs fitted with oscillometric sensors (form/BP‐203RPE II; Omron Healthcare). The reproducibility 33 and the validity 34 , 35 have been confirmed previously.
The radial AI was measured with a semiautomatic tonometry device (Omron 9000AI; Omron Healthcare). The detailed method is described in previous publication. 36 The Omron 9000AI was used to calculate the peripheral AI as (P2‐DBP)/(P1‐DBP), taking P1 and P2 as the first and second inflection points on the radial pulse waveform. 36 In this study, AI was expressed as AI adjusted for heart rate 75 beats per minute. Central SBP (late SBP in the radial artery) was calculated by the equation described previously. 36
Flow‐Mediated Dilatation
Flow‐mediated dilatation (FMD) was measured with the standard technique according to the guidelines for ultrasound assessment of the FMD of the brachial artery. 37 Using a 10‐MHz linear array transducer probe, the longitudinal image of the right brachial artery was recorded at baseline and then continuously from 30 seconds before to at least 2 minutes after the cuff deflation that followed suprasystolic compression (50 mm Hg above SBP) of the right forearm for 5 minutes. The diastolic diameter of the brachial artery was determined semiautomatically using an instrument equipped with software for monitoring the brachial artery diameter (UNEX Co, Ltd, Nagoya, Japan).
FMD was estimated as the percent change in the diameter over the baseline value at maximal dilatation during reactive hyperemia. Detailed descriptions of this method using the same system have been reported previously. 38 , 39 All FMD measurements were obtained by an experienced technician (M.S.) The reproducibility study of FMD measurement (on visits 1 and 2) was performed in 32 patients who did not change the medication between the visits. Pearson’s correlation coefficient of the FMD between visits 1 and 2 was 0.91 (P<.001), and the coefficient of variation was 11.2%.
Statistical Analysis
All statistical analyses were carried out with SPSS Statistics software, version 19 (IBM Inc, Armonk, NY). As the UACR distributions were highly positively skewed, these parameters were log‐transformed before statistical analyses. A two‐tailed paired t test was used to compare the mean values before and after each drug therapy. Data are expressed as mean±standard deviation or percentage. Pearson’s correlation coefficients were used to calculate the correlation between the changes in BP parameters and the changes in the measures of TOD. P values <.05 were considered statistically significant.
Results
One patient withdrew from the study at the second month, therefore a total of 59 patients completed the study. The baseline characteristics of patients are shown in Table I. The antihypertensive and antidiabetic drugs at baseline are shown in Table II. At the sixth month, the number of patients in each step were as follows: 2 in step 1, 8 in step 2, 18 in step 3, 13 in step 4, and 18 in step 5. With regard to home morning BP, 40.0% of patients achieved target SBP, 61.7% achieved target diastolic BP (DBP), and 30.0% achieved both the target SBP and DBP of <125/75 mm Hg. With regard to clinic BP, 61.7% achieved the target SBP, 78.3% the target DBP, and 53.3% both the target SBP and DBP of <130/80 mm Hg.
Table I.
Baseline Characteristics of Patients
| Variables | Mean±SD or % |
|---|---|
| Patients, No. | 59 |
| Age, y | 62.6±9.4 |
| Male sex, No. (%) | 31 (51.7) |
| Body mass index, kg/m2 | 26.2±4.3 |
| History of angina, No. (%) | 9 (15.0) |
| History of myocardial infarction, No. (%) | 1 (1.7) |
| Stroke, No. (%) | 0 (0) |
| History of peripheral artery disease, No. (%) | 1.7 |
| History of hypertension, y | 7.5±7.8 |
| Treatment of hypertension, y | 5.0±6.0 |
| Hyperlipidemia, No. (%) | 32 (53.3) |
| Diabetes mellitus, No. (%) | 45 (75.0) |
| History of diabetes mellitus, y | 4.7±4.6 |
| Treatment of diabetes, No. (%) | 23 (38.3) |
| Glycated hemoglobin, % | 6.4±0.6 |
| Total cholesterol, mg/dL | 200±30 |
| Triglycerides, mg/dL | 158±96 |
| HDL cholesterol, mg/dL | 49±14 |
| Serum creatinine, mg/dL | 0.75±0.22 |
| Estimated GFR, mL/min | 89.2±28.3 |
Abbreviations: GFR, estimated glomerular filtration rate; HDL, high‐density lipoprotein; SD, standard deviation.
Table II.
Drugs Used at Baseline
| Drugs at Baseline | No. (%) |
|---|---|
| Angiotensin receptor blockers | 34 (56.7) |
| Calcium channel blockers | 29 (48.3) |
| Angiotensin‐converting enzyme inhibitors | 4 (6.7) |
| Diuretics | 2 (3.3) |
| α‐Blockers | 1 (1.7) |
| β‐Blockers | 2 (3.3) |
| Statins | 20 (33.3) |
| Antiplatelet drugs | 10 (16.7) |
| Antidiabetic medications | 14 (23.3) |
| Biguanides | 4 (6.7) |
| Sulfonylureas or meglitinides | 12 (20.0) |
| Thiazolidinediones | 2 (3.3) |
| Insulin | 1 (1.7) |
The average BP levels at baseline and at 6 months are shown in Figure 1. Home morning SBP was lowered from 145±17 mm Hg to 128±11 mm Hg, and home morning DBP was lowered from 81±11 mm Hg to 73±9 mm Hg (both P<.001); home evening SBP was reduced from 133±17 mm Hg to 119±10 mm Hg, and home evening DBP was reduced from 73±10 mm Hg to 66±8 mm Hg (both P<.001). Clinic SBP was lowered from 147±18 mm Hg to 125±15 mm Hg (P<.001), but the clinic DBP was changed from 83±12 mm Hg to 80±54 mm Hg, which was not significant (P=.68). Average 24‐hour SBP was lowered from 138±13 mm Hg to 125±11 mm Hg and average 24‐hour DBP from 81±8 mm Hg to 73±6 mm Hg. Awake SBP changed from 142±13/83±10 mm Hg to 128±19/77±7 mm Hg (both P<.001); sleep SBP changed from 128±18/74±9 mm Hg to 113±13/66±7 mm Hg (both P<.001).
Figure 1.

Differences in blood pressure from the baseline to 6 months. Clinic and home morning systolic blood pressure (SBP) (a). Clinic and home morning diastolic blood pressure (DBP) (a and b). Ambulatory SBP (c) and ambulatory DBP (d).
As shown in Figure 2, by the aggressive lowering of home BP, FMD changed from 5.3%±2.1% to 5.9%±1.6% (P<.001) and AI (adjusted by heart rate 75 beats per minute) changed from 84%±10% to 78%±11% (P<.001). Similarly, PWV changed from 1635±252 cm/s to 1472±184 cm/s (P<.001) and log‐UACR changed significantly by the treatment (P=.03).
Figure 2.
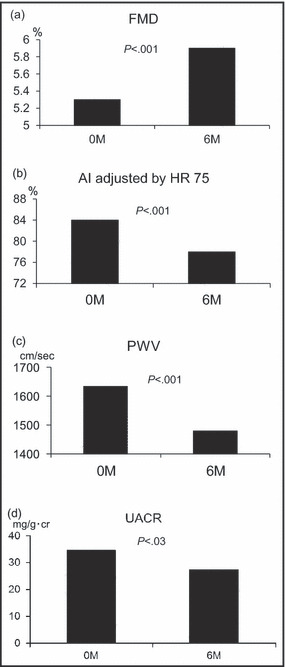
Measures of target organ damage at baseline and 6 months. Changes in flow‐mediated vasodilation (FMD) (a), changes in radial augmentation index (AI) adjusted by heart rate (HR) of 75 beats per minute (b), changes in pulse wave velocity (PWV) (c), and changes in urinary albumin excretion ratio (UACR) as the geometric mean (d).
To look at the relationship between the BP‐lowering effect of home SBP and the change in the measures of TOD, we ran Pearson’s correlation analyses as shown in Table III. The change in home morning SBP was inversely associated with the change in FMD; while the changes in clinic BP and ambulatory awake, sleep, and morning BP were not associated with the change in FMD. On the other hand, the change in home morning SBP was positively associated with the changes in PWV and log‐UACR, and clinic and ambulatory BP measures showed similar correlations with the changes in PWV and log‐UACR. The change in DBP showed similar but somewhat weaker correlations with the measures of TOD. However, none of the SBP measures were correlated with the changes in radial AI, but only clinic DBP was significantly correlated with AI. The change in central SBP was not correlated with the change in FMD, but was correlated with the change in PWV. Because central SBP is calculated from AI, the good correlation with AI should not be taken into account.
Table III.
Correlations Between the Change in Blood Pressure and the Change in the Measures of Target Organ Damage
| FMD | P Value | Al | P Value | Log UACR | P Value | Rt baPWV | P Value | Lt baPWV | P Value | |
|---|---|---|---|---|---|---|---|---|---|---|
| Clinic SBP | −0.03 | .83 | −0.03 | .85 | 0.29 | .03 | 0.07 | .62 | 0.19 | .16 |
| Home morning SBP | −0.32 | .015 | −0.09 | .52 | 0.41 | .001 | 0.29 | .03 | 0.35 | .007 |
| Home evening SBP | −0.24 | .07 | −0.10 | .48 | 0.29 | .03 | 0.27 | .04 | 0.36 | .006 |
| Awake SBP | −0.06 | .64 | 0.18 | .19 | 0.45 | .00 | 0.23 | .09 | 0.28 | .035 |
| Sleep SBP | −0.11 | .41 | 0.01 | .92 | 0.23 | .09 | 0.22 | .10 | 0.33 | .014 |
| Morning SBP | −0.07 | .60 | 0.01 | .96 | 0.22 | .10 | 0.17 | .20 | 0.23 | .09 |
| 24‐h SBP | −0.09 | .50 | 0.11 | .43 | 0.41 | .002 | 0.22 | .10 | 0.30 | .03 |
| Central SBP | −0.06 | .66 | 0.52 | <.001 | 0.33 | .014 | 0.47 | <.001 | 0.51 | <.001 |
| Clinic DBP | 0.07 | .59 | 0.33 | .01 | 0.28 | .037 | 0.23 | .09 | 0.38 | .003 |
| Home morning DBP | −0.12 | .39 | 0.04 | .79 | 0.36 | .006 | 0.26 | .054 | 0.28 | .04 |
| Home evening DBP | −0.17 | .20 | 0.003 | .98 | 0.14 | .30 | 0.28 | .03 | 0.35 | .007 |
| Awake DBP | 0.04 | .75 | 0.11 | .44 | 0.24 | .08 | 0.21 | .12 | 0.26 | .050 |
| Sleep DBP | −0.06 | .64 | 0.07 | .59 | 0.17 | .20 | 0.18 | .20 | 0.26 | .051 |
| Morning DBP | −0.15 | .27 | −0.04 | .75 | 0.07 | .58 | 0.13 | .34 | 0.13 | .34 |
| 24‐h DBP | 0.00 | .99 | 0.09 | .53 | 0.24 | .08 | 0.20 | .13 | 0.27 | .047 |
Abbreviations: Al, radial augmentation index; baPWV, brachial‐ankle pulse wave velocity; DBP, diastolic blood pressure; FMD, flow‐mediated vasodilation; SBP, systolic blood pressure; UACR, urinary albumin excretion ratio.
Compared with baseline, laboratory data at the sixth month, such as serum creatinine, eGFR, potassium, HbA1c, and uric acid did not change significantly (data not shown).
There were 27 patients who reported adverse effects during the study period. In all of these cases, we made a careful assessment of whether the adverse effects were related to the study treatment, and concluded that 13 of 27 adverse effects could have been associated with this study. The details of these cases were as follows: 7 patients had dizziness/vertigo, 4 had peripheral edema, 1 had impotence, and 1 had erythema. Because these effects were transient and mild, all of these patients agreed to continue the study. Of note, the average BP values in the 7 patients during the period of dizziness/vertigo were 131±13 mm Hg/74±8 mm Hg for home morning BP, 122±9 mm Hg/65±8 mm Hg for evening BP, and 135±12 mm Hg/74±10 mm Hg for clinic BP, and these values were somewhat higher than those achieved for the overall patient group in this study.
Discussion
In the present study, a very aggressive lowering of BP guided by home BP monitoring was effective in lowering BP level and improving the measures of TOD in patients with type 2 diabetes/prediabetes. There have been few studies to examine the use of a very aggressive antihypertensive treatment guided by home BP.
Target Home BP Level
In this study, the target home BP level was set as <125/75 mm Hg based on the Japanese Society of Hypertension guidelines. 6 As a result, the rate of the successful control for home morning SBP was 40.0%, that for home DBP was 61.7%, and that for both SBP and DBP was 30.0%. Although the control rate was not very high, the primary purpose of this study was to improve the surrogate measures of TOD by aggressive BP lowering, and, as a result, the home BP levels were sharply lowered. On average, the achieved BP level was 128/73 mm Hg, which was close to the target BP. The clinic BP and ambulatory BP were also lowered significantly and in an almost parallel fashion by the treatment, except for the clinic DBP. The extent of the reduction was almost identical between the measures of home BP and ambulatory BP, which means that ABPM is not always necessary in this setting. Most patients required more than step‐3 treatment, and this means that at least 2 antihypertensive drug classes, angiotensin receptor blockers and calcium channel blockers, were necessary for the aggressive lowering of home BP. 40 , 41 Recently, Kojima and colleagues 42 performed a similar study in patients with diabetes. They targeted a home BP level of <130/80 mm Hg and achieved a final home BP of 121.6/71.0 mm Hg, which represented an excellent level of control. The titration schedule in their study was partly similar to that in steps 1 to 5 in the present study. However, there were several differences between their study and ours. Namely, in their study, the end point was the number of drugs; several kinds of antihypertensive drugs, even in the same drug classes, were used, including α‐ and β‐blockers in steps 6 to 8 and the adverse effects were not described. The main purpose of this study was to improve the measures of TOD by antihypertensive treatment, but not for testing target home BP level ≤125/75 mm Hg. Even when the home BP level did not achieve target BP level, home BP ≤125/75 mm Hg as a guide of antihypertensive treatment would be effective in clinical practice.
Effects on FMD, AI, and PWV
In this study, the measures of hypertensive TOD, such as FMD, AI, PWV, and urinary microalbumin, were improved by the treatment. Among them, the extent of home morning BP reduction was associated with the changes in FMD, PWV, and UACR. As is well known, PWV and UACR are BP‐dependent, and the BP‐lowering therapy itself could be the major mechanism of the improvement of these measures. Because the reduction of urinary albumin is regarded as an indicator of good prognosis in diabetic patients, 43 reducing urinary albumin is important in preventing cardiovascular events. Therefore, not only the change in home BP level, but also the change in clinic BP and ambulatory BP levels, were associated with the improvement of PWV and UACR. On the other hand, the change in FMD was determined only by the change in home morning BP. The improvement was also independent of treatment steps or the other measures, such as morning BP level by ABPM. The mechanisms of this result is not clear, but a reproducibility issue 31 could have been partly responsible, since the home morning BP was based on the average BP value over 1 week, while ABPM‐based morning BP was the average for only 1 day. Another potential mechanism would be the target issue. Because the dose of the drugs was titrated based on home morning the change in morning BP would be the highest and the correlation with the outcomes would be the largest statistically.
With regard to radial AI, the change in AI was weak, but was significantly correlated with the change in PWV. However, the changes in BP measures were not correlated with the AI. This means that the reduction in AI observed in this study was due in part to the improvement in arterial stiffness.
Adverse Effects
In this study, almost half of all participants experienced some adverse effect, and study‐related adverse effects were seen in 13 patients (22%). The most common adverse effect was dizziness/vertigo (n=7), followed by peripheral edema (n=4), impotence (n=1), and erythema (n=1). In the ACCORD study, dizziness was frequently seen in response to aggressive BP‐lowering: 44.3% of patients in the group receiving intensive therapy and 40.3% in the group receiving standard therapy experienced dizziness when standing, 8 and both of these rates are relatively higher than those observed in the present work (13.6%). The difference would be due to the difference in the background of the patients. The patients in the ACCORD study had advanced diabetes, while our patients had early diabetes or prediabetes. The median duration of diabetes was 10 years in the ACCORD study, but 4 years in the present study, although we cannot simply compare these studies. When these adverse effects were detected, patients were asked whether they wanted to stop or continue the study, but all patients agreed to continue. Of note, dizziness could be a side effect of the excessive lowering of BP, but the clinic and home BP measures were all higher than the achieved BP of overall patients at the sixth month. Impotence and erythema could be the effects of either drug. Peripheral edema including orbital edema could be the effect of irbesartan or amlodipine, but was not a severe effect. These adverse effects were not a major problem in implementing the aggressive BP‐lowering when they were monitored carefully. However, these symptoms could have been one of the main reasons for not achieving target home BP level in this study.
Study Limitations
There are some limitations in this study. The numbers of patients were relatively small. In addition, this was a single arm study that did not have a control. Because aggressive BP‐lowering in type 2 diabetes is described in hypertension guidelines, a nonaggressive BP target (eg, a home BP target of 135/85 mm Hg) would not be a treatment of choice, but a far more aggressive target (eg, a home BP target of 120/70 mm Hg) would not be appropriate in the “post‐ACCORD era” except for patients with a high risk for cerebrovascular events. 44 , 45 Finally, this study did not look at cardiovascular events, and it is not clear how FMD and AI are related to cardiovascular events in prediabetic/diabetic patients.
Conclusions
In patients with type 2 diabetes/prediabetes, an angiotensin receptor blocker–based aggressive antihypertensive therapy was effective in improving the surrogate measures of TOD. A quarter of patients presented with study‐related adverse effects, such as dizziness and peripheral edema, but they were minimal and tolerable.
Disclosures: There are no conflicts of interest to disclose in this study.
References
- 1. Hansson L, Zanchetti A, Carruthers SG, et al. Effects of intensive blood‐pressure lowering and low‐dose aspirin in patients with hypertension: principal results of the Hypertension Optimal Treatment (HOT) randomised trial. Lancet. 1998;351:1755–1762. [DOI] [PubMed] [Google Scholar]
- 2. U. K. Prospective Diabetes Study Group . Tight blood pressure control and risk of macrovascular and microvascular complications in type 2 diabetes: UKPDS 38. BMJ. 1998;317:703–713. [PMC free article] [PubMed] [Google Scholar]
- 3. Patel A. Effects of a fixed combination of perindopril and indapamide on macrovascular and microvascular outcomes in patients with type 2 diabetes mellitus (the ADVANCE trial): a randomised controlled trial. Lancet. 2007;370:829–840. [DOI] [PubMed] [Google Scholar]
- 4. Chobanian AV, Bakris GL, Black HR, et al. Seventh report of the Joint National Committee on Prevention, Detection, Evaluation, and Treatment of High Blood Pressure. Hypertension. 2003;42:1206–1252. [DOI] [PubMed] [Google Scholar]
- 5. The Task Force , Mancia G, De Backer G, et al. 2007 Guidelines for the management of arterial hypertension: the Task Force for the Management of Arterial Hypertension of the European Society of Hypertension (ESH) and of the European Society of Cardiology (ESC). Eur Heart J. 2007;28:1462–1536. [DOI] [PubMed] [Google Scholar]
- 6. Ogihara T, Kikuchi K, Matsuoka H, et al. The Japanese Society of Hypertension Guidelines for the Management of Hypertension (JSH 2009). Hypertens Res. 2009;32:3–107. [PubMed] [Google Scholar]
- 7. Association AD . Standards of medical care in diabetes 2010. Diabetes Care. 2010;33:S11–S61. [DOI] [PMC free article] [PubMed] [Google Scholar]
- 8. ACCORD Study Group , Cushman WC, Evans GW, et al. Effects of intensive blood‐pressure control in type 2 diabetes mellitus. N Engl J Med. 2010;362:1575–1585. [DOI] [PMC free article] [PubMed] [Google Scholar]
- 9. Schrier RW, Estacio RO, Esler A, Mehler P. Effects of aggressive blood pressure control in normotensive type 2 diabetic patients on albuminuria, retinopathy and strokes. Kidney Int. 2002;61:1086–1097. [DOI] [PubMed] [Google Scholar]
- 10. NAVIGATOR Study Group , McMurray JJ, Holman RR, et al. Effect of valsartan on the incidence of diabetes and cardiovascular events. N Engl J Med. 2010;362:1477–1490. [DOI] [PubMed] [Google Scholar]
- 11. Lewis EJ, Hunsicker LG, Clarke WR, et al. Renoprotective effect of the angiotensin‐receptor antagonist irbesartan in patients with nephropathy due to type 2 diabetes. N Engl J Med. 2001;345:851–860. [DOI] [PubMed] [Google Scholar]
- 12. Arima H, Chalmers J, Woodward M, et al. Lower target blood pressures are safe and effective for the prevention of recurrent stroke: the PROGRESS trial. J Hypertens. 2006;24:1201–1208. [DOI] [PubMed] [Google Scholar]
- 13. Julius S, Kjeldsen SE, Weber M, et al. Outcomes in hypertensive patients at high cardiovascular risk treated with regimens based on valsartan or amlodipine: the VALUE randomised trial. Lancet. 2004;363:2022–2031. [DOI] [PubMed] [Google Scholar]
- 14. ONTARGET Investigators , Yusuf S, Teo KK, et al. Telmisartan, ramipril, or both in patients at high risk for vascular events. N Engl J Med. 2008;358:1547–1559. [DOI] [PubMed] [Google Scholar]
- 15. Cooper‐DeHoff RM, Gong Y, Handberg EM, et al. Tight blood pressure control and cardiovascular outcomes among hypertensive patients with diabetes and coronary artery disease. JAMA. 2010;304:61–68. [DOI] [PMC free article] [PubMed] [Google Scholar]
- 16. de Galan BE, Perkovic V, Ninomiya T, et al. Lowering blood pressure reduces renal events in type 2 diabetes. J Am Soc Nephrol. 2009;20:883–892. [DOI] [PMC free article] [PubMed] [Google Scholar]
- 17. Kamoi K, Miyakoshi M, Soda S, et al. Usefulness of home blood pressure measurement in the morning in type 2 diabetic patients. Diabetes Care. 2002;25:2218–2223. [DOI] [PubMed] [Google Scholar]
- 18. Palmas W, Pickering TG, Teresi J, et al. Telemedicine home blood pressure measurements and progression of albuminuria in elderly people with diabetes. Hypertension. 2008;51:1282–1288. [DOI] [PMC free article] [PubMed] [Google Scholar]
- 19. Ushigome E, Fukui M, Hamaguchi M, et al. The coefficient variation of home blood pressure is a novel factor associated with macroalbuminuria in type 2 diabetes mellitus. Hypertens Res. 2011;34:1271 1275.. [DOI] [PubMed] [Google Scholar]
- 20. Eguchi K, Pickering TG, Hoshide S, et al. Ambulatory blood pressure is a better marker than clinic blood pressure in predicting cardiovascular events in patients with/without type 2 diabetes. Am J Hypertens. 2008;21:443–450. [DOI] [PMC free article] [PubMed] [Google Scholar]
- 21. Palmas W, Pickering T, Teresi J, et al. Nocturnal blood pressure elevation predicts progression of albuminuria in elderly people with type 2 diabetes. J Clin Hypertens (Greenwich). 2008;10:12–20. [DOI] [PMC free article] [PubMed] [Google Scholar]
- 22. Parati G, Bilo G. Should 24‐h ambulatory blood pressure monitoring be done in every patient with diabetes? Diabetes Care. 2009;32:S298–S304. [DOI] [PMC free article] [PubMed] [Google Scholar]
- 23. Pierdomenico SD, Cuccurullo F. Ambulatory blood pressure monitoring in type 2 diabetes and metabolic syndrome: a review. Blood Press Monit. 2010;15:1–7. [DOI] [PubMed] [Google Scholar]
- 24. Burnier M, Grassi G. Ambulatory blood pressure monitoring in diabetic patients: new data, new questions. J Hypertens. 2011;29:198–200. [DOI] [PubMed] [Google Scholar]
- 25. Eguchi K, Hoshide S, Ishikawa J, et al. Cardiovascular prognosis of sustained and white‐coat hypertension in patients with type 2 diabetes mellitus. Blood Press Monit. 2008;13:15–20. [DOI] [PubMed] [Google Scholar]
- 26. Leitão CB, Canani LH, Kramer CK, et al. Masked hypertension, urinary albumin excretion rate, and echocardiographic parameters in putatively normotensive type 2 diabetic patients. Diabetes Care. 2007;30:1255–1260. [DOI] [PubMed] [Google Scholar]
- 27. Eguchi K, Ishikawa J, Hoshide S, et al. Masked hypertension in diabetes mellitus: a potential risk. J Clin Hypertens (Greenwich). 2007;9:601–607. [DOI] [PMC free article] [PubMed] [Google Scholar]
- 28. Wijkman M, Länne T, Engvall J, et al. Masked nocturnal hypertension‐‐a novel marker of risk in type 2 diabetes. Diabetologia. 2009;52:1258–1264. [DOI] [PubMed] [Google Scholar]
- 29. Association AD . Diagnosis and classification of diabetes mellitus. Diabetes Care. 2010;33:S62–S69. [DOI] [PMC free article] [PubMed] [Google Scholar]
- 30. Seino Y, Nanjo K, Tajima N, et al. Report of the committee on the classification and diagnostic criteria of diabetes mellitus. Diabetol Int. 2010;1:2–20. [DOI] [PMC free article] [PubMed] [Google Scholar]
- 31. Eguchi K, Hoshide S, Hoshide Y, et al. Reproducibility of ambulatory blood pressure in treated and untreated hypertensive patients. J Hypertens. 2010;28:918–924. [DOI] [PubMed] [Google Scholar]
- 32. Imai E, Horio M, Nitta K, et al. Estimation of glomerular filtration rate by the MDRD study equation modified for Japanese patients with chronic kidney disease. Clin Exp Nephrol. 2007;11:41–50. [DOI] [PubMed] [Google Scholar]
- 33. Matsui Y, Kario K, Ishikawa J, et al. Reproducibility of arterial stiffness indices (pulse wave velocity and augmentation index) simultaneously assessed by automated pulse wave analysis and their associated risk factors in essential hypertensive patients. Hypertens Res. 2004;27:851–857. [DOI] [PubMed] [Google Scholar]
- 34. Yamashina A, Tomiyama H, Takeda K, et al. Validity, reproducibility, and clinical significance of noninvasive brachial‐ankle pulse wave velocity measurement. Hypertens Res. 2002;25:359–364. [DOI] [PubMed] [Google Scholar]
- 35. Tanaka H, Munakata M, Kawano Y, et al. Comparison between carotid‐femoral and brachial‐ankle pulse wave velocity as measures of arterial stiffness. J Hypertens. 2009;27:2022–2027. [DOI] [PubMed] [Google Scholar]
- 36. Takazawa K, Kobayashi H, Shindo N, et al. Relationship between radial and central arterial pulse wave and evaluation of central aortic pressure using the radial arterial pulse wave. Hypertens Res. 2007;30:219–228. [DOI] [PubMed] [Google Scholar]
- 37. Corretti MC, Anderson TJ, Benjamin EJ, et al. Guidelines for the ultrasound assessment of endothelial‐dependent flow‐mediated vasodilation of the brachial artery: a report of the International Brachial Artery Reactivity Task Force. J Am Coll Cardiol. 2002;39:257–265. [DOI] [PubMed] [Google Scholar]
- 38. Tomiyama H, Matsumoto C, Yamada J, et al. The relationships of cardiovascular disease risk factors to flow‐mediated dilatation in japanese subjects free of cardiovascular disease. Hypertens Res. 2008;31:2019–2025. [DOI] [PubMed] [Google Scholar]
- 39. Kabutoya T, Hoshide S, Ogata Y, et al. The time course of flow‐mediated vasodilation and endothelial dysfunction in patients with a cardiovascular risk factor. J Am Soc Hypertens. 2012;6:109116. [DOI] [PubMed] [Google Scholar]
- 40. Giunti S, Cooper M. Management strategies for patients with hypertension and diabetes: why combination therapy is critical. J Clin Hypertens (Greenwich). 2006;8:108–113. [DOI] [PMC free article] [PubMed] [Google Scholar]
- 41. Eguchi K, Pickering TG, Kario K. Why is blood pressure so hard to control in patients with type 2 diabetes? J Cardiometab Syndr. 2007;2:114–118. [DOI] [PubMed] [Google Scholar]
- 42. Kojima M, Dohi Y, Ohashi M, et al. Crucial role of kidney function in resistance to antihypertensive therapy in patients with diabetes mellitus. J Hypertens. 2010;28:2323–2328. [DOI] [PubMed] [Google Scholar]
- 43. de Zeeuw D, Remuzzi G, Parving H‐H, et al. Albuminuria, a therapeutic target for cardiovascular protection in type 2 diabetic patients with nephropathy. Circulation. 2004;110:921–927. [DOI] [PubMed] [Google Scholar]
- 44. Mancia G, Laurent S, Agabiti‐Rosei E, et al. Reappraisal of European guidelines on hypertension management: a European Society of Hypertension Task Force document. J Hypertens. 2009;27:2121–2158. [DOI] [PubMed] [Google Scholar]
- 45. Mancia G, Grassi G, Zanchetti A. Antihypertensive treatment and blood pressure in diabetic and nondiabetic patients. Diabetes Care. 2011;34:S304–S307. [DOI] [PMC free article] [PubMed] [Google Scholar]