Abstract
Objective:
To compare the accuracy and computational efficiency of two of the latest deep-learning algorithms for automatic identification of cephalometric landmarks.
Materials and Methods:
A total of 1028 cephalometric radiographic images were selected as learning data that trained You-Only-Look-Once version 3 (YOLOv3) and Single Shot Multibox Detector (SSD) methods. The number of target labeling was 80 landmarks. After the deep-learning process, the algorithms were tested using a new test data set composed of 283 images. Accuracy was determined by measuring the point-to-point error and success detection rate and was visualized by drawing scattergrams. The computational time of both algorithms was also recorded.
Results:
The YOLOv3 algorithm outperformed SSD in accuracy for 38 of 80 landmarks. The other 42 of 80 landmarks did not show a statistically significant difference between YOLOv3 and SSD. Error plots of YOLOv3 showed not only a smaller error range but also a more isotropic tendency. The mean computational time spent per image was 0.05 seconds and 2.89 seconds for YOLOv3 and SSD, respectively. YOLOv3 showed approximately 5% higher accuracy compared with the top benchmarks in the literature.
Conclusions:
Between the two latest deep-learning methods applied, YOLOv3 seemed to be more promising as a fully automated cephalometric landmark identification system for use in clinical practice.
Keywords: Automated identification, Cephalometric landmarks, Artificial intelligence, Machine learning, Deep learning
INTRODUCTION
The use of machine-learning techniques in the field of medical imaging is rapidly evolving.1,2 Attempts to apply machine-learning algorithms in orthodontics are also increasing. Some of the major applications currently used are automated diagnostics,1 data mining,3 and landmark detection.4,5 Inconsistency in landmark identification has been known to be a major source of error in cephalometric analyses. The diagnostic value of the analysis depends on the accuracy and the reproducibility of landmark identification.6,7 The most recent studies in orthodontics, however, still rely on conventional cephalometric analysis depending on human tasks.4,8–11 A completely automated approach has thus gained attention with the aim of alleviating human error due to the analyst's subjectivity and reducing the tediousness of the task.12–19
Since the first introduction of an automated landmark identification method in the mid-1980s,20 numerous methods of artificial intelligence techniques have been suggested. However, in the past, the various approaches did not seem to be accurate enough for use in clinical practice.15 Rapidly evolving newer algorithms and increasing computational power provide improved accuracy, reliability, and efficiency. Recent approaches for fully automated cephalometric landmark identification have shown significant improvement in accuracy and are raising expectations for daily use of these automatic techniques.12,16,18 Recently, an advanced machine-learning method called “deep learning” has been receiving the spotlight.14 However, the first step toward applying this latest method to the automated cephalometric analysis system is just recently being taken.12
Currently available automated landmark detection solutions previously focused on a limited set of skeletal landmarks (less than 20), limiting their application either in determining precise anatomical structures or in providing soft tissue information.12,16–18 Cephalometric landmarks are not solely used for cephalometric analysis for skeletal characteristics. A much greater number of both skeletal and soft tissue landmarks are necessary for evaluation, treatment planning, and predicting treatment outcomes. It has repeatedly been emphasized that, when a greater number of anatomic landmark locations are used, a more accurate prediction of treatment outcome will result.8,9,21–24 To apply automatic cephalometrics in clinical practice effectively, computational performance would also be an important factor, especially when the system has to deal with a large number of landmarks to be identified. Previous research revealed that the systems based on the random forest method detected 19 landmarks in several seconds.18 Recently, one of the deep-learning methods, You-Only-Look-Once (YOLO), was shown to require a shorter time for detecting objects.25 A comparison among the latest machine-learning algorithms in terms of computational efficiency might be of interest to clinical orthodontists.
The purpose of this study was to compare the accuracy and computational performance of two of the latest machine-learning methods for automatic identification of cephalometric landmarks. This study applied two different algorithms in identifying 80 landmarks: (1) the YOLO version 3 (YOLOv3)–based method with modification25,26 and (2) the Single Shot Multibox Detector (SSD)–based method.27 The null hypothesis was that there would be no difference in accuracy and computational performance between the two automated landmark identification systems.
MATERIALS AND METHODS
Subjects
A total of 1311 lateral cephalometric radiograph images were selected and downloaded from the Picture Aided Communication System server (INFINITT Healthcare Co Ltd, Seoul, Korea) at Seoul National University Dental Hospital, Seoul, Korea. In later stages, 1028 images were randomly selected as learning data, and the remaining 283 images played a role as new test data. Images of patients with growth capacity, fixed orthodontic appliances, large dental prostheses, and/or surgical bone plates were all included. The exclusion criteria were limited to only extremely poor-quality images, which made landmark identification practically impossible. The institutional review board for the protection of human subjects at Seoul National University School of Dentistry and Seoul National University Dental Hospital reviewed and approved the research protocol (institutional review board Nos. S-D 2018010 and ERI 19007).
Manual Identification of Cephalometric Landmarks
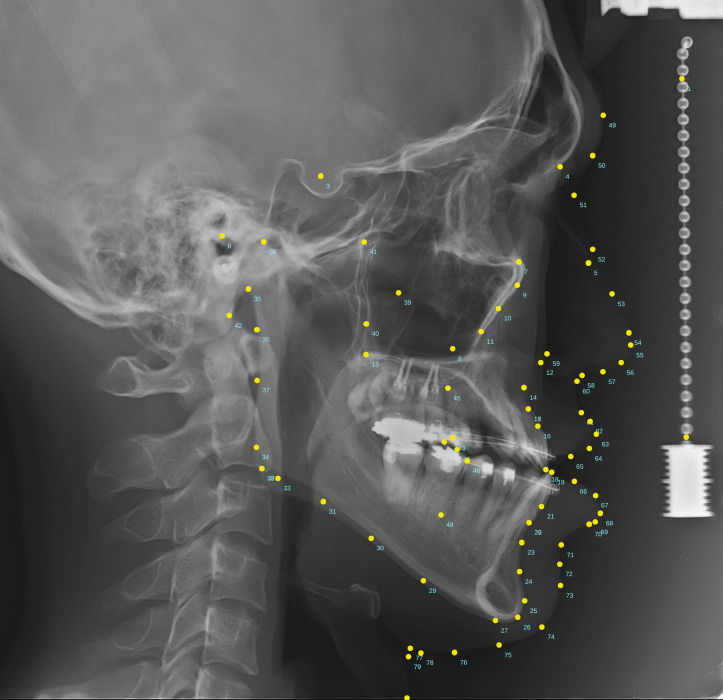
Of 1311 lateral cephalometric images, a total of 80 landmarks, including two vertical reference points that were located on the free-hanging metal chain on the right side, 46 skeletal landmarks, and 32 soft tissue landmarks (Figure 1), were manually identified by a single examiner with more than 28 years of clinical orthodontic experience. A modification of a commercial cephalometric analysis software (V-Ceph version 8, Osstem Implant Co Ltd, Seoul, Korea) was used to digitize the records for the 80 landmarks. Among them, 27 were arbitrary landmarks to render smooth line drawings of anatomic structures, and 53 were conventional landmarks that have been well-accepted in clinical orthodontic practice (Table 1).
Figure 1.
An image indicating the 80 cephalometric landmarks detected in the present study. Detailed landmark information is provided in Table 1.
Table 1.
List of Anatomical Landmarks Shown in Figure 1
| Landmark No. |
Name |
| 1 | Vertical reference point 1 |
| 2 | Vertical reference point 2 |
| 3 | Sella |
| 4 | Nasion |
| 5 | Nasal tip |
| 6 | Porion |
| 7 | Orbitale |
| 8 | Key ridgea |
| 9 | Key ridge contour smoothing point 1a |
| 10 | Key ridge contour smoothing point 2a |
| 11 | Key ridge contour smoothing point 3a |
| 12 | Anterior nasal spine |
| 13 | Posterior nasal spine |
| 14 | Point A |
| 15 | Point A contour smoothing pointa |
| 16 | Supradentale |
| 17 | U1 root tip |
| 18 | U1 incisal edge |
| 19 | L1 incisal edge |
| 20 | L1 root tip |
| 21 | Infradentale |
| 22 | Point B contour smoothing pointa |
| 23 | Point B |
| 24 | Protuberance menti |
| 25 | Pogonion |
| 26 | Gnathion |
| 27 | Menton |
| 28 | Gonion, constructed |
| 29 | Mandibular body contour smoothing point 1a |
| 30 | Mandibular body contour smoothing point 2a |
| 31 | Mandibular body contour smoothing point 3a |
| 32 | Gonion, anatomic |
| 33 | Gonion contour smoothing point 1a |
| 34 | Gonion contour smoothing point 2a |
| 35 | Articulare |
| 36 | Ramus contour smoothing point 1a |
| 37 | Ramus contour smoothing point 2a |
| 38 | Condylion |
| 39 | Ramus tip |
| 40 | Pterygomaxillary fissure |
| 41 | Pterygoid |
| 42 | Basion |
| 43 | U6 crown mesial edge |
| 44 | U6 mesiobuccal cusp |
| 45 | U6 root tip |
| 46 | L6 crown mesial edge |
| 47 | L6 mesiobuccal cusp |
| 48 | L6 root tip |
| 49 | Glabella |
| 50 | Glabella contour smoothing pointa |
| 51 | Nasion |
| 52 | Nasion contour smoothing point 1a |
| 53 | Nasion contour smoothing point 2a |
| 54 | Supranasal tip |
| 55 | Pronasale |
| 56 | Columella |
| 57 | Columella contour smoothing pointa |
| 58 | Subnasale |
| 59 | Cheek point |
| 60 | Point A |
| 61 | Superior labial sulcus |
| 62 | Labiale superius |
| 63 | Upper lip |
| 64 | Upper lip contour smoothing pointa |
| 65 | Stomion superius |
| 66 | Stomion inferius |
| 67 | Lower lip contour smoothing pointa |
| 68 | Lower lip |
| 69 | Labiale inferius |
| 70 | Inferior labial sulcus |
| 71 | Point B |
| 72 | Protuberance menti |
| 73 | Pogonion |
| 74 | Gnathion |
| 75 | Menton |
| 76 | Menton contour smoothing pointa |
| 77 | Cervical point |
| 78 | Cervical point contour smoothing point 1a |
| 79 | Cervical point contour smoothing point 2a |
| 80 | Terminal point |
Arbitrary landmarks to render a smooth line drawing of anatomic structures. Landmarks 3 to 48 are skeletal landmarks and 49 to 80 are soft tissue landmarks.
Two Deep-Learning Systems
Two systems were built on a server running Ubuntu 18.04.1 LTS OS with a Tesla V100 GPU acceleration card (NVIDIA Corp, Santa Clara, Calif). One system was based on YOLOv3,26 the other was based on SSD.27 Learning data (N = 1028) trained the two machines' learning algorithms. Manually recorded location data of 80 landmarks served as standardized inputs in this learning process.
The target image was resized to 608 × 608 pixels from the original size of 1670 × 2010 pixels for optimal deep learning. One millimeter was equal to 6.7 pixels. While learning, each image along with its corresponding landmark labels was then passed through convolutional neural network (CNN) architecture for both YOLOv3 and SSD.
Test Procedures and Comparisons Between the Two Systems
To test the accuracy and computational efficiency between the two systems, 283 test data that were not included in the learning data were used. The accuracy of the two systems are reported as point-to-point errors that were calculated as the absolute distance value between the ground truth position and the corresponding automatically identified landmarks. To visualize and evaluate errors, two-dimensional scattergrams and 95% confidence ellipses based on chi-square distribution28–30 for each landmark were depicted. To follow the format of previous accuracy reports, thereby making analogous comparisons with previous results possible, the successful detection rates (SDRs) for 2-, 2.5-, 3-, and 4-mm ranges were calculated for 19 landmarks that were previously used in the literature.12 Computational performances were reported as the mean running time required to identify 80 landmarks of an image under this study's laboratory conditions. The differences in the test errors between YOLOv3 and SSD were compared with the t-test at the probability of .05 with the Bonferroni correction of alpha errors. All statistical analyses were performed by Language R (Vienna, Austria).31
RESULTS
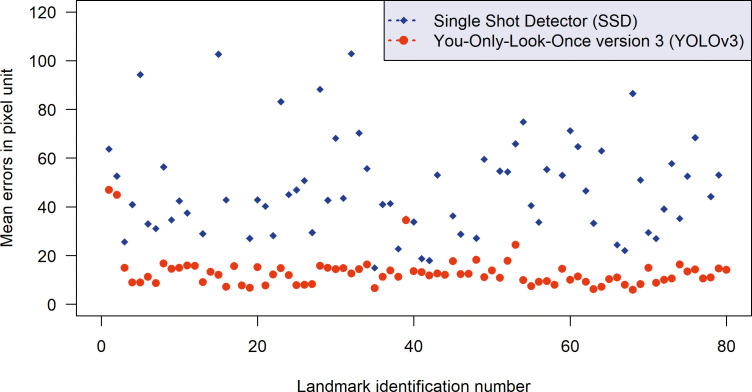
YOLOv3 outperformed SSD in accuracy for 38 of 80 landmarks. The other 42 of 80 landmarks did not show statistically significant differences between the two methods. None of the landmarks was found to be more accurately identified by the SSD method (Figure 2).
Figure 2.
Comparison of the mean point-to-point errors between the You-Only-Look-Once version 3 (YOLOv3, red) and Single Shot Detector (SSD, blue) methods. The plot indicates that YOLOv3 was more accurate than SSD in general.
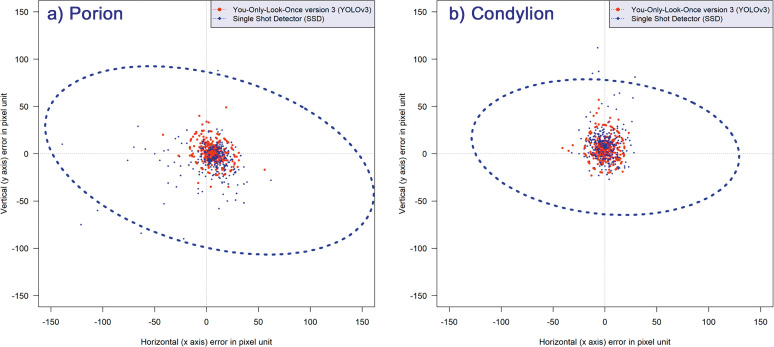
Among the scattergrams, the porion and condylion points are provided as representative plots in Figure 3. The figure shows that YOLOv3 has not only smaller ellipses in size but also a more homogenous distribution of detecting errors irrespective of the direction. The latter can be seen by a more circular shape of the ellipses of YOLOv3, while SSD has crushed-shaped ellipses (Figure 3).
Figure 3.
Error scattergrams and 95% confidence ellipses from the YOLOv3 (red) and SSD (blue) methods. YOLOv3 resulted in a more uniformly distributed pattern of detection errors (more circular isotropic shaped ellipse) as well as higher accuracy (smaller sized ellipse) than SSD. (a) Errors after detecting porion. (b) Errors after detecting condylion.
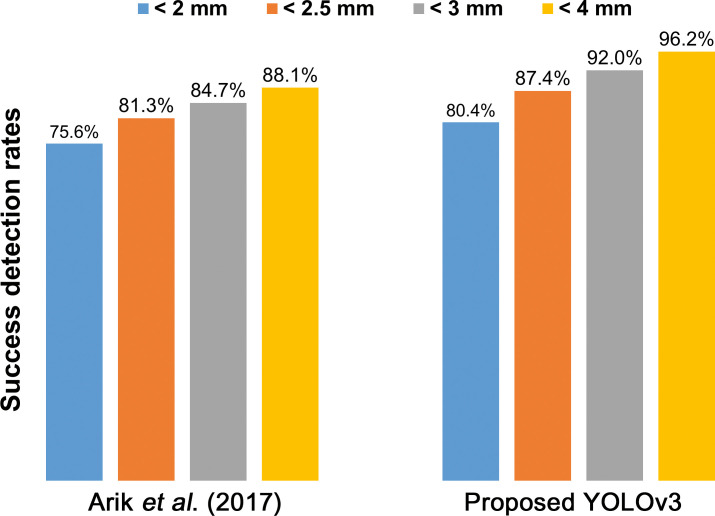
The mean time spent in identification and visualization of the 80 landmarks per image was recorded as 0.05 and 2.89 seconds for YOLOv3 and SSD, respectively. When compared with the top benchmark in the literature to date so far,12 YOLOv3 showed approximately 5% higher SDR in all ranges (Figure 4).
Figure 4.
Compared with the top accuracy results in the previous literature,12 the proposed YOLOv3 shows approximately 5% higher success detection rates for all ranges.
DISCUSSION
The present study was performed to investigate which kind of latest deep-learning method would produce the most accurate results in automatically identifying cephalometric landmarks. Although automatic cephalometric landmark identification has been a topic of interest, until the mid-2000s the developed algorithms did not seem accurate enough for clinical purposes.15 More recently, annual global competitions revealed impressive improvements in the accuracy of automated cephalometric landmark identification.12,17,18 In fact, recent approaches based on deep learning algorithms showed accuracy comparable with an experienced orthodontist.16,18 The result of the present study demonstrated that YOLOv3 was better than SSD. Furthermore, the accuracy results of the present study showed that YOLOv3 was better than other top benchmarks to date so far.12,17,18 Among the previous literature, the most accurate result was produced after applying CNNs, which identified 19 landmarks.12 The present study identified significantly more: 80 landmarks that could readily be extrapolated for clinical use in predicting treatment outcomes.8,21–24 For clinical purposes, data from cephalometric landmark identification could readily be extended even to predict and visualize soft tissue changes after treatment. For the aforementioned purposes, the previous international competitions dealing with 19 landmarks17,18 might not meet the clinical needs in orthodontic practice.
Applications of deep learning models to overall technology are becoming reality.14 Papers focusing on one of them, CNN, have been rapidly accumulating.1,2,12 Regarding automated cephalometric landmark identification, efforts to apply CNN have begun relatively recently. In 2016, with the aim of real-time object detection in testing images, two novel algorithms came out, namely, YOLO and SSD.25,27 YOLO uses CNN to reduce the spatial dimension detection box. It performs a linear regression to make boundary box predictions. The purported advantage of YOLO is fast computation and generalization. In the case of SSD, the size of the detecting box is usually fixed and used for simultaneous size detection. Therefore, the purported advantage of SSD is known to be the simultaneous detection of objects with various sizes. However, in landmark identification of cephalometric radiographs, the size of the detecting box is generally fixed. This was conjectured to be one reason for the poorer detection performance of SSD. A well-known limitation of both YOLO and SSD was that their accuracy was inferior to other methods when the size of objects is small. However, the latest version of YOLO (YOLOv3) claimed to improve its accuracy to the level of other preexisting methods while keeping the aforementioned advantages.26
Some of the landmarks are prone to error in the vertical direction, while others show greater errors in the horizontal direction.15,28 Hence, evaluating the accuracy based only on the linear distance might not be informative enough. Therefore, two-dimensional scattergrams and 95% confidence ellipses of 80 landmarks were depicted. As shown in Figure 3, YOLOv3 was revealed to have ellipses with smaller sizes and more circular shapes. In other words, YOLOv3 was not just more accurate but also resulted in a more isotropic shape of error patterns than did SSD. This feature might be another advantage of YOLOv3.
The computational time of an automated cephalometric landmark identification system might be a concern to clinicians. The mean time spent per image was 0.05 seconds for YOLOv3 and 2.89 seconds for SSD under this study's laboratory conditions. Even with an extensive number of landmarks to be identified, both algorithms showed excellent speed. The application of artificial intelligence in automated cephalometric landmark identification may lessen the burden and alleviate human errors. By gathering radiographic data automatically, the YOLOv3 method may also help reduce human tasks and the time required for both research and clinical purposes.
One strength of the present study was that the data included comprised the largest number of learning (n = 1028) and test data (n = 283) ever investigated. Limitations of the present study were that intra/interexaminer reliability statistics and reproducibility comparisons are necessary. To determine whether the automated cephalometric landmark identification may perform better than orthodontic clinicians, a future study is envisioned.
CONCLUSION
YOLOv3 outperformed SSD in accuracy and computational time. YOLOv3 also demonstrated a more isotropic form of detection errors than SSD did. YOLOv3 seems to be a promising method for use as an automated cephalometric landmark identification system.
ACKNOWLEDGMENTS
This study was partly supported by grant 05-2018-0018 from the Seoul National University Dental Hospital Research Fund and the Technology Development Program (grant S2538233) funded by the Ministry of Small and Medium Enterprises and Startups, the Korean Government.
DISCLOSURE
Some among the coauthors have a conflict of interest. The final form of the machine-learning system was developed by computer engineers of DDH incorporation (Seoul, Korea), which is expected to own the patent in the future. Among the coauthors, Hansuk Kim and Soo-Bok Her are shareholders of DDH Inc. Youngsung Yu and Girish Srinivasan are employees at DDH Inc. Other authors do not have a conflict of interest.
REFERENCES
- 1.Lee JH, Kim DH, Jeong SN, Choi SH. Detection and diagnosis of dental caries using a deep learning-based convolutional neural network algorithm. J Dent. 2018;77:106–111. doi: 10.1016/j.jdent.2018.07.015. [DOI] [PubMed] [Google Scholar]
- 2.Litjens G, Kooi T, Bejnordi BE, et al. A survey on deep learning in medical image analysis. Med Image Anal. 2017;42:60–88. doi: 10.1016/j.media.2017.07.005. [DOI] [PubMed] [Google Scholar]
- 3.Sam A, Currie K, Oh H, Flores-Mir C, Lagravere-Vich M. Reliability of different three-dimensional cephalometric landmarks in cone-beam computed tomography: a systematic review. Angle Orthod. 2019;89:317–332. doi: 10.2319/042018-302.1. [DOI] [PMC free article] [PubMed] [Google Scholar]
- 4.Rossato PH, Fernandes TMF, Urnau FDA, et al. Dentoalveolar effects produced by different appliances on early treatment of anterior open bite: a randomized clinical trial. Angle Orthod. 2018;88:684–691. doi: 10.2319/101317-691.1. [DOI] [PMC free article] [PubMed] [Google Scholar]
- 5.Montúfar J, Romero M, Scougall-Vilchis R. Automatic 3-dimensional cephalometric landmarking based on active shape models in related projections. Am J Orthod Dentofacial Orthop. 2018;153:449–458. doi: 10.1016/j.ajodo.2017.06.028. [DOI] [PubMed] [Google Scholar]
- 6.Kazandjian S, Kiliaridis S, Mavropoulos A. Validity and reliability of a new edge-based computerized method for identification of cephalometric landmarks. Angle Orthod. 2006;76:619–624. doi: 10.1043/0003-3219(2006)076[0619:VAROAN]2.0.CO;2. [DOI] [PubMed] [Google Scholar]
- 7.Rudolph D, Sinclair P, Coggins J. Automatic computerized radiographic identification of cephalometric landmarks. Am J Orthod Dentofacial Orthop. 1998;113:173–179. doi: 10.1016/s0889-5406(98)70289-6. [DOI] [PubMed] [Google Scholar]
- 8.Suh HY, Lee HJ, Lee YS, Eo SH, Donatelli RE, Lee SJ. Predicting soft tissue changes after orthognathic surgery: the sparse partial least squares method. Angle Orthod. In press. [DOI] [PMC free article] [PubMed]
- 9.Kang TJ, Eo SH, Cho HJ, Donatelli RE, Lee SJ. A sparse principal component analysis of Class III malocclusions. Angle Orthod. In press. [DOI] [PMC free article] [PubMed]
- 10.Myrlund R, Keski-Nisula K, Kerosuo H. Stability of orthodontic treatment outcomes after 1-year treatment with the eruption guidance appliance in the early mixed dentition: a follow-up study. Angle Orthod. 2019;89:206–213. doi: 10.2319/041018-269.1. [DOI] [PMC free article] [PubMed] [Google Scholar]
- 11.Garnett BS, Mahood K, Nguyen M, et al. Cephalometric comparison of adult anterior open bite treatment using clear aligners and fixed appliances. Angle Orthod. 2018;89:3–9. doi: 10.2319/010418-4.1. [DOI] [PMC free article] [PubMed] [Google Scholar]
- 12.Arik SÖ, Ibragimov B, Xing L. Fully automated quantitative cephalometry using convolutional neural networks. J Med Imag. 2017;4:014501. doi: 10.1117/1.JMI.4.1.014501. [DOI] [PMC free article] [PubMed] [Google Scholar]
- 13.Hutton TJ, Cunningham S, Hammond P. An evaluation of active shape models for the automatic identification of cephalometric landmarks. Eur J Orthod. 2000;22:499–508. doi: 10.1093/ejo/22.5.499. [DOI] [PubMed] [Google Scholar]
- 14.LeCun Y, Bengio Y, Hinton G. Deep learning. Nature. 2015;521:436. doi: 10.1038/nature14539. [DOI] [PubMed] [Google Scholar]
- 15.Leonardi R, Giordano D, Maiorana F, Spampinato C. Automatic cephalometric analysis. Angle Orthod. 2008;78:145–151. doi: 10.2319/120506-491.1. [DOI] [PubMed] [Google Scholar]
- 16.Lindner C, Wang CW, Huang CT, Li CH, Chang SW, Cootes TF. Fully automatic system for accurate localisation and analysis of cephalometric landmarks in lateral cephalograms. Sci Rep. 2016;6:33581. doi: 10.1038/srep33581. [DOI] [PMC free article] [PubMed] [Google Scholar]
- 17.Wang CW, Huang CT, Hsieh MC, et al. Evaluation and comparison of anatomical landmark detection methods for cephalometric x-ray images: a grand challenge. IEEE Trans Med Imaging. 2015;34:1890–1900. doi: 10.1109/TMI.2015.2412951. [DOI] [PubMed] [Google Scholar]
- 18.Wang CW, Huang CT, Lee JH, et al. A benchmark for comparison of dental radiography analysis algorithms. Med Image Anal. 2016;31:63–76. doi: 10.1016/j.media.2016.02.004. [DOI] [PubMed] [Google Scholar]
- 19.Vandaele R, Marée R, Jodogne S, Geurts P. Automatic cephalometric x-ray landmark detection challenge 2014: a tree-based algorithm. Proceedings of the International Symposium on Biomedical Imaging (ISBI) Piscataway, New Jersey: IEEE; 2014. pp. 37–44. [Google Scholar]
- 20.Cohen A, Ip H-S, Linney A. A preliminary study of computer recognition and identification of skeletal landmarks as a new method of cephalometric analysis. Br J Orthod. 1984;11:143–154. doi: 10.1179/bjo.11.3.143. [DOI] [PubMed] [Google Scholar]
- 21.Lee H-J, Suh H-Y, Lee Y-S, et al. A better statistical method of predicting postsurgery soft tissue response in Class II patients. Angle Orthod. 2013;84:322–328. doi: 10.2319/050313-338.1. [DOI] [PMC free article] [PubMed] [Google Scholar]
- 22.Lee Y-S, Suh H-Y, Lee S-J, Donatelli RE. A more accurate soft-tissue prediction model for Class III 2-jaw surgeries. Am J Orthod Dentofacial Orthop. 2014;146:724–733. doi: 10.1016/j.ajodo.2014.08.010. [DOI] [PubMed] [Google Scholar]
- 23.Suh H-Y, Lee S-J, Lee Y-S, et al. A more accurate method of predicting soft tissue changes after mandibular setback surgery. J Oral Maxillofac Surg. 2012;70:e553–e562. doi: 10.1016/j.joms.2012.06.187. [DOI] [PubMed] [Google Scholar]
- 24.Yoon K-S, Lee H-J, Lee S-J, Donatelli RE. Testing a better method of predicting postsurgery soft tissue response in Class II patients: a prospective study and validity assessment. Angle Orthod. 2014;85:597–603. doi: 10.2319/052514-370.1. [DOI] [PMC free article] [PubMed] [Google Scholar]
- 25.Redmon J, Divvala S, Girshick R, Farhadi A. Proceedings of the IEEE Conference on Computer Vision and Pattern Recognition. Piscataway, New Jersey: IEEE; 2016. You only look once: Unified, real-time object detection; pp. 779–788. [Google Scholar]
- 26.Redmon J, Farhadi A. Yolov3: an incremental improvement. arXiv preprint arXiv:1804.02767. 2018 Available at: https://arxiv.org/pdf/1804.02767.pdf.
- 27.Liu W, Anguelov D, Erhan D, et al. Proceedings of the European Conference on Computer Vision. New York: Springer; 2016. SSD: Single shot multibox detector; pp. 21–37. [Google Scholar]
- 28.Donatelli RE, Lee SJ. How to report reliability in orthodontic research: part 1. Am J Orthod Dentofacial Orthop. 2013;144:156–161. doi: 10.1016/j.ajodo.2013.03.014. [DOI] [PubMed] [Google Scholar]
- 29.Donatelli RE, Lee SJ. How to report reliability in orthodontic research: part 2. Am J Orthod Dentofacial Orthop. 2013;144:315–318. doi: 10.1016/j.ajodo.2013.03.023. [DOI] [PubMed] [Google Scholar]
- 30.Donatelli RE, Lee SJ. How to test validity in orthodontic research: a mixed dentition analysis example. Am J Orthod Dentofacial Orthop. 2015;147:272–279. doi: 10.1016/j.ajodo.2014.09.021. [DOI] [PubMed] [Google Scholar]
- 31.R Development Core Team. R: A Language and Environment for Statistical Computing. Vienna, Austria: R Foundation for Statistical Computing; 2019. [Google Scholar]


