

Abstract
Objective:
Pediatric anxiety disorders can have a chronic course and are considered gateway disorders to adult psychopathology, but no consistent predictors of long-term outcome have been identified. A single latent symptom dimension that reflects features shared by all mental health disorders, the p factor, is thought to reflect mechanisms that cut across mental disorders. Whether p predicts outcome in youth with psychiatric disorders has not been examined. We tested whether the p factor predicted long-term psychiatric and functional outcomes in a large, naturalistically followed-up cohort of anxiety-disordered youth.
Method:
Children and adolescents enrolled in a randomized controlled treatment trial of pediatric anxiety were followed-up on average 6 years posttreatment and then annually for 4 years. Structural equation modeling was used to estimate p at baseline. Both p and previously established predictors were modeled as predictors of long-term outcome.
Results:
Higher levels of p at baseline were related to more mental health disorders, poorer functioning, and greater impairment across all measures at all follow-up time points. p Predicted outcome above and beyond previously identified predictors, including diagnostic comorbidity at baseline. Post hoc analyses showed that p predicted long-term anxiety outcome, but not acute treatment outcome, suggesting that p may be uniquely associated with long-term outcome.
Conclusion:
Children and adolescents with anxiety disorders who present with a liability toward broad mental health problems may be at a higher risk for poor long-term outcome across mental health and functional domains. Efforts to assess and to address this broad liability may enhance long-term outcome.
Keywords: anxiety disorders, outcome, p factor, children, adolescents
Pediatric anxiety disorders are prevalent and associated with substantial impairment in psychosocial functioning.1–4 Several interventions demonstrate efficacy in the treatment of youth anxiety, including cognitive—behavioral therapy (CBT), selective serotonin reuptake inhibitors, and their combination.5 Yet, children and adolescents with anxiety disorders often follow a relapsing or chronic symptom course over time and frequently develop additional psychopathology in adulthood.6–8 Factors that predict long-term outcome could be leveraged to improve clinical care and outcome durability. However, at present, no consistent predictors of long-term outcome have been identified.
The number of long-term follow-up (LTFU) studies (>1 year posttreatment) of youth anxiety are limited compared to the number of short-term efficacy trials,9 particularly for studies examining medications.10 A review of the 15 cohorts of LTFUs indicates that approximately 68% of children and adolescents with anxiety disorders no longer met criteria for their primary anxiety disorder 2 to 19 years posttreatment, although there is considerable variability in this metric across studies.11 Despite this promising situation, many youths follow a relapsing course of anxiety over time and are at increased risk for developing other mental disorders.10,12
Studies on outcome predictors have focused primarily on socio-demographic variables (age, sex, race, ethnicity, and socioeconomic status), parent variables (psychopathology, family functioning), child variables (primary anxiety diagnosis, anxiety severity, comorbidity), treatment type/response, and interim negative life events.11 Findings have been inconsistent, and only socioeconomic status has been a significant predictor in 3 or more studies. Thus, examination of novel variables grounded in theory is warranted, particularly in relation to outcome measures beyond categorical diagnoses or degree of symptom change.13
Hierarchical dimensional models of psychiatric symptoms (eg, the Hierarchical Taxonomy of Psychopathology [HiTOP] system14) are gaining ground as a complementary approach to the categorical taxonomy of DSM, and offer a new lens through which to view LTFU predictors. Using dimensional models, psychiatric symptoms have been shown to reflect 3 broad dimensions: (1) internalizing (eg, depression, fear), (2) externalizing (eg, impulsivity, antisocial behavior), and (3) thought disorder (eg, mania, psychosis) symptoms. The advantages of dimensional models over categorical models are that they better explain the shared genetic architecture of many psychiatric disorders as well as the high rates of comorbidity, within-disorder heterogeneity, and heterotypic continuity seen within psychiatry.14
A key element in dimensional approaches to psychiatric symptoms is the inclusion of a general overarching factor that reflects features shared by all psychiatric disorders: namely, the p factor. Within a clinical context, individuals high in p are prone to experience symptoms across the psychiatric spectrum, whereas individuals low on p may experience symptoms within only a single symptom dimension. It has been suggested that p is a proxy for mechanisms that cut across disorders, such as poor emotion regulation.15 p is highly heritable in children and adolescents16 and is strongly related to age of onset, duration, and disorder diversity in a recent 4-decade longitudinal cohort study.17
Although most studies examining p have been conducted with adults, there is evidence for the p factor in community populations of youth18–20 and children as young as 18 months of age21 as well as referred youth.22 However, p has not been examined as a predictor of longitudinal outcome among youth that fulfill criteria for a psychiatric disorder. Pediatric anxiety disorders may be particularly relevant, as they are the most common mental disorders in youth,1–4,23 onset early,2 and predict broad mental health problems and functional impairments into adulthood.24 In addition, emotion dysregulation (a proposed underpinning of p) has predicted rates of nontargeted disorders (posttraumatic stress disorder, agoraphobia, panic attacks, and obsessive-compulsive disorder [OCD]) for anxious youth (N = 64) at 7 to 19 years following treatment, although emotion dysregulation was not a predictor of posttreatment responder status.25 This pattern of findings further highlights the potential for p as an LTFU predictor. Functional outcomes may be particularly important to assess in addition to psychiatric/anxiety symptoms, as symptoms and functional impairments can interact with one another throughout follow-up in a series of developmental cascades.26 If consistent predictors of broad outcome can be outlined, findings could be leveraged to improve or amend care (eg, by the inclusion of treatment components directly targeting consistent predictors or sustained care over time).
The present study examined whether p predicted long-term outcome in a large naturalistically followed-up sample of clinically anxious youth. These youth participated in the Child/Adolescent Anxiety Multimodal Extended Long-term Study (CAMELS). CAMELS was conducted as an LTFU of participants enrolled in a large randomized controlled trial of pediatric anxiety, the Child and Adolescent Anxiety Multimodal Study (CAMS).27 In CAMS, youth with a principal anxiety disorder were randomized to cognitive—behavioral therapy (CBT), sertraline, CBT plus sertraline, or pill placebo.5 In CAMELS, a subset of the CAMS participants were re-assessed on average 6 years after completion of CAMS and then assessed annually for 4 consecutive years. In addition to anxiety outcomes, CAMELS assessments included broad diagnostic interviews and ratings of psychosocial functioning and impairment. An original evaluation of CAMELS predictors found that age at study entry, male sex, higher baseline functioning, positive family dynamics, and absence of social anxiety disorder were associated with a stable remission versus a chronic pattern of anxiety through follow-up.10 The current study pursued the following hypotheses: (1) baseline p will predict long-term outcome defined as number of psychiatric diagnoses, overall functioning, and degree of day-to-day impairment; and (2) p will predict these outcomes above and beyond baseline predictors that previously have been established in CAMELS.
METHOD
Procedure
English-speaking outpatient youth (N = 488) aged 7 to 17 years with a principal social anxiety, generalized anxiety, or separation anxiety disorder who were free of anti-anxiety medications prior to baseline were randomized into the CAMS treatments and assessed at baseline and at weeks 4, 8 and 12. Of note, presence of additional comorbid diagnoses (eg, depression, externalizing disorders) was not an exclusion criterion per se, although youth with disorders that required treatment not provided in CAMS (ie, major depressive disorder, bipolar disorder, psychotic disorder, pervasive developmental disorder, uncontrolled attention-deficit/hyperactivity disorder, eating disorders, and substance use disorders) were excluded. Additional exclusion criteria in CAMS included the following: school refusal behavior in the most recent term (missing >25% of school days); suicidal or homicidal ideation; 2 previous failed SSRI trials or 1 failed trial of CBT for anxiety; sertraline intolerance; presence of a confounding medical condition; pregnancy; and IQ estimate ≥80.27 After completing CAMS, interested youth/caregivers were enrolled into CAMELS and assessed yearly 4 to 12 years after CAMS10; 65.4% of the CAMS sample (n = 319) participated in the first CAMELS assessment (numbers at each of the 4 CAMELS assessments are shown in Table 1). Sociodemographic information and scores on the outcome measures across time points are also provided in Table 1.
TABLE 1.
Participant Characteristics Across Study Time Points
| Characteristic | Baseline | CAMELS year 1 | CAMELS year 2 | CAMELS year 3 | CAMELS year 4 |
|---|---|---|---|---|---|
| No. of participants | 480 | 310/309 | 235/234/233 | 216/215/214 | 205/204/203/200 |
| Female participants, n (%) | 235 (49.7%) | 172 (55.5%) | 115 (56.4%) | 121 (56.5%) | 115 (56.4%) |
| Age, y, mean (SD) | 11.24 (2.80) | 17.76 (3.37) | 18.39 (3.34) | 19.24 (3.28) | 20.18 (3.19) |
| Years since baseline, mean (SD) | — | 6.59 (1.65) | 7.31 (1.67) | 8.16 (1.44) | 9.12 (1.37) |
| CGAS/GAF, mean (SD) | 50.80 (7.16) | 62.64 (13.53) | 63.35 (14.24) | 61.10 (13.66) | 63.00 (14.57) |
| HoNOS, mean (SD) | — | 3.98 (3.24) | 3.32 (3.09) | 3.43 (3.29) | 3.36 (3.13) |
| No. of ADIS diagnoses, mean (SD) | — | 1.62 (1.66) | 1.39 (1.51) | 1.41 (1.62) | 1.41 (1.62) |
| Comorbid disorders (0,1, 2+), mean (SD) | 0.76 (0.77) | — | — | — | — |
| Comorbid externalizing disorder, n (%) | 89 (18.5%) | — | — | — | — |
| Comorbid internalizing disorder other than principal anxiety disorder, n (%) | 212 (44.2%) | — | — | — | — |
| CSR for social anxiety (ADIS), mean (SD) | 4.66 (1.90) | — | — | — | — |
| CGI-S for anxiety severity (ADIS), mean (SD) | 5.03 (0.74) | — | — | — | — |
| SCARED-R, mean (SD) | 23.49 (15.17) | — | — | — | — |
| MFQ, mean (SD) | 17.91 (11.83) | __ | __ | __ | __ |
Note: ADIS = Anxiety Disorders Interview Schedule; CAMELS = Child/Adolescent Anxiety Multimodal Extended Long-Term Study; CGAS = Children’s Global Assessment Scale; CGI-S = Clinical Global Impression Severity; CSR = Clinical Severity Ratings; GAF = Global Assessment of Functioning; HoNOS = Health of the Nation Outcome Scales; IE = independent evaluator; MFQ = Mood and Feelings Questionnaire; PARS = Pediatric Anxiety Rating Scale; SCARED-R = Screen for Child Anxiety Related Disorders—Revised.
Previous studies have compared CAMELS participants and nonparticipants along several variables (ie, percentage of responders, baseline anxiety severity, number of baseline comorbid disorders, assigned treatment conditions), with no significant differences in presentation or treatment response. There were significant demographic differences, such that participants who participated in CAMELS were more likely to be female, to be non-Hispanic, and to report a higher socioeconomic status. CAMELS participants were also more likely to be randomized to treatment 3 months later than those who did not participate in CAMELS.
p Factor Measure
To establish p, we used the 8 narrowband subscales of the parent-reported Child Behavior Checklist (CBCL)28 administered at CAMS baseline and as part of assessments at 4, 8, and 12 weeks. The CBCL provided dimensional scores for each participant across 8 dimensions of psychopathology: rule-breaking behavior, attention problems, thought problems, social problems, somatic complaints, withdrawn/depressed symptoms, and anxious/depressed symptoms. The CBCL has been used to reliably assess p in previous studies with youth22,29 and is the most frequently used scale to derive p in youth samples.
Outcome Measures
The Anxiety Disorders Interview Schedule (ADIS-IV)30 is a semi-structured diagnostic interview of DSM-IV-TR diagnoses. Reliable independent evaluators (IEs) administered the ADIS-IV separately to both parent and children/adolescents at the baseline assessment in CAMS and long-visits in CAMELS, which included Clinical Severity Ratings (CSR) for endorsed diagnoses. CSRs were provided along a scale of 0 to 8, with a CSR of 4 or higher indicating that the child/adolescent met diagnostic criteria. Intraclass correlation coefficients between CAMS IEs and quality assurance raters for 10% of ADIS assessments were excellent. Consistent with the original evaluation of CAMELS outcome, which used presence/absence of an anxiety disorder diagnosis to generate 3 responder groups,12 we used number of psychiatric diagnoses on the ADIS-IV at each time point as our primary outcome.
As secondary outcomes, we evaluated broad functional outcome using 2 additional variables: the Children’s Global Assessment Scale/Global Assessment of Functioning31 (CGAS/GAF) and Health of the Nation Outcome Scales (HoNOS; child/adolescent32 and adult33 scales). CGAS/GAF are IE-rated scales assessing overall psychosocial functioning on a scale from 1 to 100, with lower ratings indicating poorer functioning. CGAS/GAF has demonstrated adequate psychometric properties.34 The HoNOS is an IE-reported measure of functional impairment (eg, peer relationships, family life/relationships, activities of daily living, occupational functioning, and school performance) and has adequate psychometric properties.32,35
Validator Measures
Criterion validity of p was examined by outlining associations between p and other baseline variables. First, associations between p and comorbidity were examined, with comorbidity being coded in 3 ways according to ADIS-IV ratings: (1) any comorbid disorder in addition to the principal anxiety disorder (yes/no); (2) any comorbid internalizing disorder (yes/no); and (3) any comorbid externalizing disorder (yes/no). Second, associations between p and overall functioning (CGAS) and overall anxiety severity (Clinical Global Impression-Severity scale [CGI-S]) were examined. Finally, associations between p and self-reported depression and anxiety were examined using the child-reported Mood and Feelings Questionnaire36 (MFQ) and the child-reported Screen for Child Anxiety Related Disorders37 (SCARED), with both measures having sound psychometric properties.38,39
Predictor Measures
To control for possible confounding in the predictor analysis, we made an a priori decision to include all variables previously established as significant baseline predictors of long-term outcome in CAMELS: age at study entry, sex, baseline functioning (CGAS), family functioning and social anxiety. In accordance with previous CAMELS studies, the general scale of the parent-reported Brief Family Assessment Measure–III (BFAM-III)40 was used as a measure of baseline family functioning. This scale has adequate internal consistency in other samples41 and in CAMS (Cronbach α = 0.84). The CSR rating (0–8) for social anxiety disorder in ADIS was used as a measure of severity of social anxiety at baseline. Treatment condition and baseline anxiety severity were also included as predictors, with baseline anxiety severity being measured using the clinician-rated CGI-S.
Statistical Analysis
All analyses were carried out within a structural equation modeling (SEM) framework and performed in R using the library lavaan. The full statistical code is provided as an online supplement.
First, we aimed to establish a well-fitting dimensional model that included all CBCL narrowband scales. We followed a stepwise approach. First, and consistent with previous approaches,42,43 we tested (1) a single general factor model (model 1); (2) a model with 2 correlated first-order factors (internalizing and externalizing symptoms; model 2); and (3) a bifactor model (ie, the combination of models 1 and 2, but with orthogonal internalizing and externalizing factors; model 3). Raw CBCL scores were used in all analyses because of better distributional properties, and data for all participants in CAMS were used to maximize statistical power and to minimize sampling error. If a well-fitting model was not outlined using this initial approach, we decided a priori to use modification indices (MI) to improve model fit. MI is a statistical procedure that produces an estimate of how much a model’s χ2 value is reduced (ie, the model becomes more adequate in reproducing the observed sample statistics) if a specific model restriction is removed. The MI procedure in lavaan tests the removal of all model restrictions and results in suggestions of which added parameters will most increase model fit. We chose to add only those model parameters that were theoretically justified starting with the parameter that increased model fit the most. For each added parameter, we re-examined all model fit indices. Because of increased risk of overfitting using MI, we tested our final model by fitting it to separate CBCL data, reported by parents at 4, 8, and 12 weeks into CAMS.
As recommended, several fit indices were examined to evaluate model fit44: χ2 (lower value indicates better fit), confirmatory fit index (CFI; adequate fit indicated by >0.90), root mean square error of approximation (RMSEA; adequate fit indicated by <0.06), standardized mean square residual (SRMR; adequate fit indicated by <0.08), and Tucker–Lewis fit index (TLI adequate fit indicated by >0.90).45,46 Criterion validity of p was examined in relation to the validator measures described above.
Finally, p was used to predict long-term outcome in a line of structural predictor models. Specifically, the best-fitting p factor model was included in the overall SEM model, and the p dimension was modeled as a predictor of outcome alongside the other predictor variables described above. Each outcome was examined using a separate SEM model. These SEM models let us examine whether p predicted outcome above and beyond other predictor variables. Maximum likelihood (continuous data) or diagonally weighted least-squares (categorical data) estimation was used, dependent upon whether or not categorical variables were included in the specified model. Robust standard errors were estimated throughout. An α level of 0.05 was used as an indicator of statistical significance. No adjustment of α level was used because we examined prespecified hypotheses, reported results for all analyses, examined multiple dependent outcome variables (eg, functioning/impairment at 4 different time points), and did not test a universal null hypothesis.47
RESULTS
Fitting and Testing the p Factor
All steps of fitting the p factor model are presented in Table 2. Model fit was not adequate for the single general factor model (model 1) or the model with correlated internalizing and externalizing factors (model 2). The bifactor model (model 3) had better fit, but all indicators did not load significantly onto the externalizing and internalizing factors, and some indicators had factor loadings in the direction opposite to that which was expected (all models and loadings are represented in Figure S1, available online). Because the fitted bifactor model was not theoretically adequate, it was dropped from further analyses.
TABLE 2.
Fit Indices for the Different Models Tested to Find a p Factor Model With Adequate Fit (n = 480)
| Model | χ2 | df | p value | CFI | TLI | RMSEA | SRMR |
|---|---|---|---|---|---|---|---|
| Model with 1 general p factor (model 1) | 210.457 | 20 | < .001 | .841 | .777 | .141 | .067 |
| Model with correlated internalizing and externalizing factors (model 2) | 181.086 | 19 | < .001 | .864 | .800 | .133 | .065 |
| Bifactor model (model 3) | 78.275 | 12 | < .001 | .945 | .871 | .107 | .040 |
| Model 1 with correlated residuals for Aggression and Rule-Breaking (model 1b)a | 129.288 | 19 | < .001 | .908 | .864 | .110 | .054 |
| Model 1b with correlated residuals for Anxious/Depressed and Attention Problems (model 1c) | 99.532 | 18 | < .001 | .932 | .894 | .097 | .048 |
| Model 1c with correlated residuals for Withdrawn/Depressed and Social Problems (Model 1d) | 75.809 | 17 | < .001 | .951 | .919 | .085 | .043 |
| Model 1d with correlated residuals for Anxious/Depressed and Rule-Breaking (Model 1e) | 59.717 | 16 | < .001 | .963 | .936 | .075 | .036 |
| Model 1e with correlated residuals for Social Problems and Aggression (final model) | 37.909 | 15 | = .001 | .981 | .964 | .056 | .031 |
| Model 2e with identical added parameters as in model 1e | 37.171 | 14 | = .001 | .981 | .961 | .059 | .031 |
Note: Boldface type indicates the best fitting model. CFI = comparative fit index; RMSEA = root mean square error of approximation; SRMR = standardized mean square residual; TLI = Tucker–Lewis Index.
Each of the models 1b to 1e includes all parameters in the previous model, eg, model 1c includes all parameters in model 1b plus correlated residuals for Anxious/Depressed and Attention Problems
MI were used for models 1 and 2 to examine whether we could fit a theoretically justified model that adequately reproduced the observed sample statistics. For model 1, 5 theoretically justified parameters were added to achieve a well-fitting model that was also theoretically coherent (Table 2). In the final model (model 1e), all narrowband scales loaded significantly and positively onto the p factor. In addition, the scales of Aggressive Behavior and Rule-Breaking Behavior had a positive association that was not captured merely by them being indicators of p. A similar association emerged for Withdrawn/Depressed and Social Problems, in which Anxious/Depressed was negatively associated with Attention Problems and Aggressive Behavior after accounting for their shared variance through p. All parameters in the final model were statistically significant (all p values <.001) and participants in the sample varied significantly on the p factor (p < .001).
For model 2, additional parameters identical to those for model 1 were suggested and added; very similar fit indices were found across models 1 and 2 with each added parameter. Fit indices for the final model (model 2e) are presented in Table 2. Importantly, in this model, the internalizing and externalizing factors were very highly correlated (β = 0.970), indicating that a general psychopathology factor was clearly represented in the observed sample statistics. Also, model parameters were nearly identical across the 2 models (Figure 1). Because of the high correlation between the latent factors in model 2e, we proceeded with model 1e, which better accounted for the general factor suggested by the data. Both models and their parameter estimates are presented in Figure 1.
FIGURE 1.
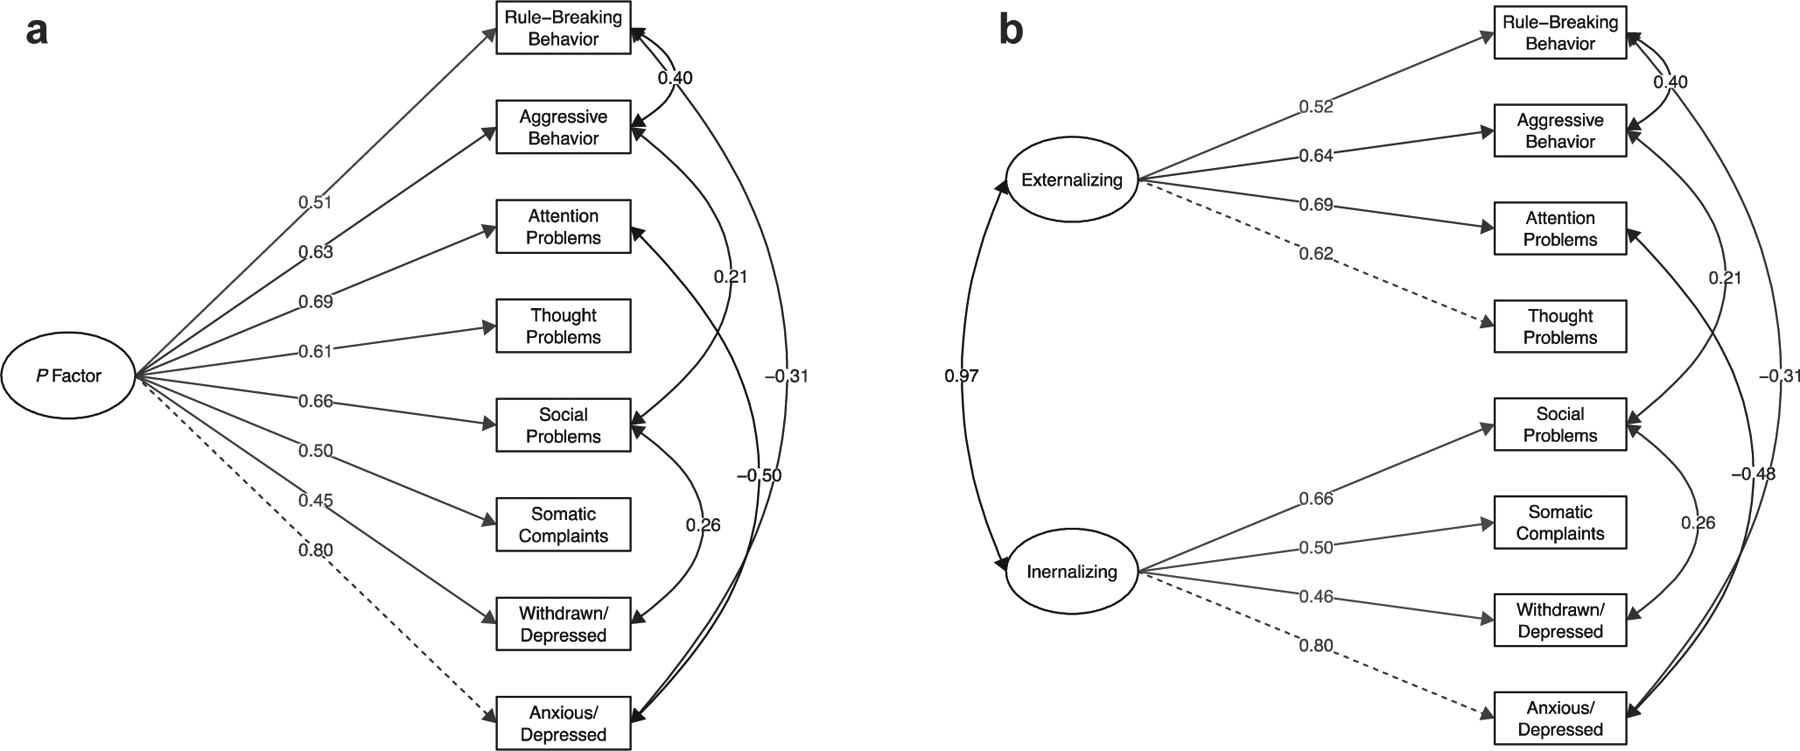
Two Separate Models That Adequately Represent the Observed Sample Statistics for Parent-Reported Child Behavior Checklist (CBCL) Narrowband Scales
Note: Model (a) includes a latent factor representing the p factor, and model (b) includes 2 highly correlated latent factors. Standardized factor loadings are presented. The added parameters, reflecting correlated residuals between indicators, are shown in the right part of the figure; covariance estimates are standardized. All parameters in the model are statistically significant (p values <.001). The model is fitted with baseline Child and Adolescent Anxiety Multimodal Study (CAMS) data (n = 480). The dotted line indicates the variable used as the reference point during model estimation.
To examine model validity and the risk of an over-fitted model due to the use modification indices, we cross-validated the final model using parent-reported CBCL data from 4, 8, and 12 weeks into CAMS. The model showed adequate fit at all time points and across fit indices with the exception of RMSEA, which is known to falsely reject models when degrees of freedom (df) and sample size are small.48 As a sensitivity analysis, we also tested model fit across time points for model 2e. Nearly identical fit indices for models 1e and 2e were found. Because we used raw CBCL scores and not sex- and age-adjusted t scores, we tested the model fit of model 1e using t-score data at baseline and at 4, 8, and 12 weeks into CAMS. Fit indices were very similar, but the model showed slightly better fit using t-score data. Finally, we tested whether model 1e had adequate fit in the 318 CAMS participants who participated in the first follow-up in CAMELS; good fit was found. Full fit indices for all models are provided in Table S1, available online.
To further validate our final model (ie, model 1e), associations between the latent p factor in the model and CAMS baseline variables were examined. p was related to the presence of a comorbid disorder in general (β = 0.223, p < .001; n = 480) and the presence of a comorbid externalizing disorder specifically (β = 0.463, p < .001; n = 480), but not to internalizing disorders beyond the presenting principal anxiety disorder (β = 0.062, p = .318; n = 480). Significant associations were also found between p and child-reported depression (MFQ; β = 0.204, p < .001; n = 480), child-reported anxiety (SCARED-R; β = 0.149, p = .006; n = 477), IE-reported overall functioning (CGAS; β = −0.116, p = .009; n = 480), and IE-reported baseline anxiety severity (CGI-S; β = 0.186, p < .001; n = 480). The p factor was not associated with age or sex.
The p Factor as a Predictor of Outcome
Table 3 presents results for p and the other predictor variables in relation to long-term outcomes. With respect to our primary outcome, higher p at baseline was associated with a larger number of diagnoses at each of the 4 follow-ups. Family functioning and severity of social anxiety at baseline were associated with number of diagnoses at select time points. In regard to our secondary outcomes, higher p at baseline was associated with lower functioning/more impairment at all follow-up assessments. Sex, severity of social anxiety, and family functioning at baseline were associated with these outcomes at select time points.
TABLE 3.
Results for the Predictors in Relation to Long-Term Outcomes for Number of Psychiatric Diagnoses (ADIS-IV), Overall Functioning (CGAS/GAF), and Overall Impairment (HoNOS)
| Baseline predictor | No. of diagnoses CAMELS year 1 n = 313 |
No. of diagnoses CAMELS year 2 n = 235 |
No. of diagnoses CAMELS year 3 n = 216 |
No. of diagnoses CAMELS year 4 n = 205 |
|---|---|---|---|---|
| p Factor | 0.193 (0.083, 0.303)** | 0.251 (0.117, 0.386)*** | 0.163 (0.018, 0.307)* | 0.219 (0.087, 0.351)** |
| Treatment condition in CAMS | 0.053 (−0.056, 0.161) | 0.007 (−0.116, 0.130) | 0.017 (−0.119, 0.153) | 0.076 (−0.056, 0.209) |
| Anxiety severity (CGI-S) | 0.051 (−0.069, 0.171) | 0.085 (−0.084, 0.253) | 0.068 (−0.086, 0.222) | 0.071 (−0.096, 0.239) |
| Family functioning (BFAM-III) | 0.133 (0.035, 0.231)** | 0.116 (−0.008, 0.240) | 0.140 (0.008, 0.272)* | 0.179 (0.050, 0.308) |
| Overall functioning (CGAS/GAF) | 0.051 (−0.072, 0.174) | 0.114 (−0.027, 0.254) | 0.116 (−0.019, 0.251) | 0.025 (−0.118, 0.169) |
| Severity of social anxiety (CSR) | 0.198 (0.092, 0.304)*** | 0.178 (0.073, 0.283) | 0.136 (−0.009, 0.280) | 0.151 (0.030, 0.273) |
| Age | 0.014 (−0.096, 0.125) | 0.029 (−0.098, 0.157) | −0.119 (−0.249, 0.010) | −0.048 (−0.186, 0.090) |
| Male sex | −0.061 (−0.169, 0.047) | 0.023 (−0.101, 0.147) | −0.056 (−0.192, 0.080) | −0.028 (−0.166, 0.110) |
| Baseline predictors | CGAS/GAF CAMELS year 1 n = 313 |
CGAS/GAF CAMELS year 2 n = 233 |
CGAS/GAF CAMELS year 3 n = 215 |
CGAS/GAF CAMELS year 4 n = 203 |
| p Factor | −0.244 (−0.348, 0.139)*** | −0.307 (−0.428, −0.186)*** | −0.180 (−0.316, −0.045)** | −0.244 (−0.377, −0.112)*** |
| Treatment condition in CAMS | −0.094 (−0.197, 0.009) | −0.038 (−0.153, 0.078) | −0.040 (−0.172, 0.093) | −0.026 (−0.153, 0.100) |
| Anxiety severity (CGI-S) | −0.077 (−0.200, 0.046) | −0.048 (−0.201, 0.106) | −0.056 (−0.206, 0.094) | −0.060 (−0.233, 0.104) |
| Family functioning (BFAM-III) | −0.057 (−0.154, 0.040) | −0.078 (−0.204, 0.048) | −0.072 (−0.208, 0.065) | −0.195 (−0.326, −0.065) |
| Overall functioning (CGAS/GAF) | −0.108 (−0.242, 0.026) | −0.028 (−0.185, 0.130) | −0.006 (−0.175, 0.163) | 0.066 (−0.076, 0.208) |
| Severity of social anxiety (CSR) | −0.228 (−0.345, −0.110)*** | −0.161 (−0.282, −0.039)* | −0.109 (−0.250, 0.033) | −0.054 (−0.192, 0.085) |
| Age | −0.058 (−0.167, 0.196) | −0.007 (−0.136, 0.122) | 0.044 (−0.100, 0.188) | −0.057 (−0.197, 0.083) |
| Male sex | 0.091 (−0.014, 0.196) | 0.164 (0.043, 0.284)** | 0.164 (0.033, 0.294)* | 0.127 (−0.004, 0.258) |
| Baseline predictor | HoNOS CAMELS year 1 n = 312 |
HoNOS CAMELS year 2 n = 233 |
HoNOS CAMELS year 3 n = 214 |
HoNOS CAMELS year 4 n = 204 |
| p Factor | 0.144 (0.031, 0.258)* | 0.209 (0.081, 0.336)** | 0.254 (0.125, 0.382)*** | 0.241 (0.108, 0.374)*** |
| Treatment condition in CAMS | 0.052 (−0.051, 0.155) | −0.004 (−0.127, 0.118) | 0.079 (−0.055, 0.214) | 0.025 (−0.111, 0.160) |
| Anxiety severity (CGI-S) | 0.036 (−0.104, 0.175) | 0.067 (−0.107, 0.241) | 0.040 (−0.125, 0.205 | 0.131 (−0.025, 0.287) |
| Family functioning (BFAM-III) | 0.126 (0.033, 0.219)** | 0.058 (−0.069, 0.184) | 0.141 (0.008, 0.274)* | 0.060 (−0.064, 0.185) |
| Overall functioning (CGAS/GAF) | −0.016 (−0.158, 0.125) | 0.011 (−0.152, 0.175) | 0.050 (−0.098, 0.197) | 0.015 (−0.141, 0.172) |
| Severity of social anxiety (CSR) | 0.182 (0.083, 0.281)*** | 0.069 (−0.054, 0.192) | 0.139 (0.007, 0.270)* | 0.022 (−0.105, 0.150) |
| Age | 0.027 (−0.089, 0.144) | 0.017 (−0.127, 0.162) | −0.110 (−0.254, 0.034) | −0.048 (−0.199, 0.103) |
| Male sex | −0.097 (−0.203, 0.010) | −0.128 (−0.247, −0.008) | −0.011 (−0.141, 0.119) | −0.052 (−0.191, 0.086) |
Note: Standardized β values and their 95% CIs (in parentheses) are presented. BFAM-III = Brief Family Assessment Measure—III; CAMELS = Child/Adolescent Anxiety Multimodal Extended Long-Term Study; CAMS = Child/Adolescent Anxiety Multimodal Study; CGAS/GAF = Children’s Global Assessment Scale/Global Assessment of Functioning; CGI-S = Clinical Global Impression-Severity; CSR = Clinical Severity Ratings.
p < .05;
p < .01;
p < .001.
Post Hoc Analyses
Because p consistently predicted our main outcomes, a post hoc analysis was carried out to examine whether p also predicted anxiety outcomes, with these outcomes defined as the IE-rated CGI-S score for anxiety at each follow-up assessment. Results are shown in Table S2, available online. Higher levels of p at baseline were significantly associated with higher levels of anxiety severity at each follow-up time point.
To examine whether the predictive influence of p simply reflected baseline diagnostic comorbidity, a post hoc decision was made to run a model that included baseline diagnostic comorbidity (defined as 0, 1, or 2+ baseline comorbid disorders according to ADIS) in the set of predictors. The p factor was significantly associated with outcome in 14 of 16 models; baseline comorbidity was associated with outcome in 4 of 16 models. Full results are provided in Table S3, available online.
To examine whether the association between higher levels of p and poor outcome could be explained by p being associated with a poor treatment response, we examined whether p predicted CAMS short-term outcome, which was defined as CGI-S and CGAS scores directly at posttreatment and at 24 and 36 weeks posttreatment. p predicted
CGI-S at 36 weeks posttreatment (β = 0.137, p = .007; n = 473), but no other significant associations emerged. Full results are provided in Table S4, available online.
The p factor model used in the present study, with the CBCL narrowband scales loading somewhat equally on p, suggests that p (as measured in the present study) may be reasonably well reflected by a single CBCL sum score. Such a measure is easily obtained in everyday clinical care and hence has clinical utility. Therefore, we examined whether a total CBCL score predicted long-term outcomes. Results indicated that a CBCL sum score predicted long-term outcome with similar but somewhat attenuated effects compared to the latent p factor in the SEM model. The CBCL total score was significantly associated with outcome in all but 1 model (where it approached significance). Full results are provided in Table S5, available online.
DISCUSSION
Does a single latent dimension that confers risk for a wide range of mental disorders (the p factor) predict long-term outcome for youth who received treatment for anxiety during childhood or adolescence? In line with hypotheses, results showed that higher levels of p at baseline predicted a larger number of psychiatric disorders, lower functioning, and more impairment at each long-term follow-up. These findings emerged above and beyond previously established baseline predictors of anxiety outcomes (eg, sex, family functioning, presence of social anxiety). Importantly, p was the only predictor consistently associated with outcomes across time and measures, also when controlling for baseline diagnostic comorbidity, indicating that p is related not only to a narrow set of outcomes but to broad outcomes, and that it is not simply a proxy for diagnostic comorbidity. Higher levels of p at baseline also predicted long-term anxiety outcomes, which adds to the extant literature on factors associated with remission versus relapse/nonresponse among anxiety-disordered youth.10–12 Furthermore, p did not predict initial treatment response, suggesting that its long-term predictive effects cannot be explained by poorer immediate outcome and that the importance of p may emerge uniquely in relation to long-term outcomes. Although results should be considered as preliminary until replicated, study findings suggest that p may reflect processes/vulnerabilities that are important for understanding the transition from pediatric anxiety to adult psychopathology and impairment.
Study results are consistent with cross-sectional studies examining p in community youth populations18–20 and in referred youth.22 These studies have found that higher levels of p are associated with a range of negative sequalae, including more severe scores on a composite measure of self-harm and suicidal ideation.22 The present findings extend previous cross-sectional work to suggest that p is associated with additional negative outcomes (ie, more psychiatric disorders, poorer functioning, and more impairment) in a longitudinal clinical sample of youth. Given that findings for clinical populations can have direct implications for clinical care, further longitudinal investigations with other youth clinical samples and additional variables (ie, age of onset, disorder duration, and diversity of different comorbid disorders over time17) are warranted. Our findings are also in line with previous findings showing that emotion dysregulation (a proposed underpinning of p) predicted long-term, but not short-term, outcomes in anxious youth.25 Taken together, these results suggest that p may be a predictor uniquely associated with long-term outcomes.
Our findings may have treatment implications. CBT, the first-line psychological therapy for youth anxiety, is disorder specific and targets primarily anxiety. Although such a focus is efficacious in changing anxiety, the present results suggest that a subset of anxious youth may need complementary or alternative approaches. Given that p did not predict acute treatment outcome, efforts to prevent relapse and the development of broad symptoms may be more efficacious for youth high in p than efforts to improve current disorder-specific treatments. It may also be that youth high on p may benefit from treatments that dually target features suggested to underlie p (eg, emotion dysregulation, emotional impulsivity) while also including core anxiety-focused CBT components (eg, exposure). To advance the field, work is needed to better elucidate the mechanisms underlying p and how to optimally assess and address these mechanisms in youth treatments. Hopefully, such work can be leveraged to identify children and adolescents who may need broader or more long-term care, via increased treatment duration, augmented treatment content, and/or medication. In the present study, we could show that a simple CBCL sum score may act as a clinically feasible proxy for p. Future work may benefit from the inclusion of similar simpler models using measures that can be obtained and used in everyday clinical care.
Study limitations warrant consideration. First, the optimal measurement of the p factor is not yet established, and in the present study we could not use the bifactor model often used in previous studies. Future studies may want to assess p using item-level and not sum score data as we used. Second, item-level data were not available for any measures, and thus we could not estimate internal reliability scores and similar estimates. Third, although CAMELS attrition was similar to that in other trials,49 retention rates were modest (65%).10 Thus, selection bias may have affected results, which is supported by the low representation of participants of ethnic minority and from a low socioeconomic status. Fourth, a naturalistic study design was implemented during follow-up for ethical reasons. As a result, firm causal conclusions cannot be drawn. Fifth, issues of external validity warrant consideration. Families who opted to participate in CAMELS did not differ from those who chose not to participate in terms of percentage of treatment responders, baseline anxiety severity, number of baseline comorbid disorders, or assigned treatment condition, but there were significant demographic differences (ie, biological sex, ethnicity, socioeconomic status).10 Although findings that CAMELS participants did not differ in clinical presentation or treatment response are encouraging for external validity, results may not generalize to the entire population of youth with anxiety disorders. Future LTFUs should emphasize recruitment and retention of more diverse populations, with a particular focus on the barriers that these populations face to participation in research more generally.50 Finally, the predictive power of p should be examined alongside predictor variables other than those used here (eg, depression51) and in relation to a broader set of outcomes, and by including variables that may mediate outcome (eg, interim negative life events). Furthermore, p may be reciprocally or causally related to some of the factors included as covariates in this study (eg, family and overall functioning). More complex models, preferably using longitudinal data, can help to identify such relations with implications for the onset and maintenance of mental disorders among youth.
Despite these limitations, the current study’s prospective design with long-term follow-up allowed for a preliminary test of the hypothesis that p is a “liability” to future disorders. This extends previous work using primarily cross-sectional or retrospective assessments of p, and findings clearly indicated that youth with anxiety disorders who present with a liability toward broad mental health problems are at increased risk for poor long-term, but not immediate, outcomes across mental health and functional domains. Efforts to assess and to address this broad liability may enhance outcomes and inform updates to treatments and clinical care. Further work is warranted examining p within other youth anxiety samples, and among youth with other mental disorders.
Supplementary Material
Disclosure:
Dr. Cervin has received research support from Region Skåne, Lions Skåne, Stiftelsen Lindhaga, and Bror Gadelius Minnesfond. Dr. Ginsburg has received funding from NIMH and the US Department of Education and has served as a paid consultant for Syneos Health. Dr. Compton has received research support from NIH and the NC GlaxoSmithKline Foundation. He has consulted for Mursion, Inc., Luminopia, Inc., and Shire. He has received honoraria from the Journal of Consulting and Clinical Psychology, the Nordic Long-Term OCD Treatment Study Research Group, and the Centre for Child and Adolescent Mental Health, Eastern and Southern Norway. He has served on the scientific advisory board of the Tourette Association of America (TAA), the Anxiety and Depression Association of America (ADAA), and Mursion, Inc. He has given expert testimony for Duke University. Dr. Piacentini has received research support from NIMH, the TLC Foundation for BFRBs, and Pfizer Pharmaceuticals; book royalties from Guilford Press and Oxford University Press; and speaking honoraria and travel expenses from the International OCD Foundation and TAA. Dr. Albano has received grant support from NIMH and Duke University; royalties from Oxford University Press and Lynn Sonberg Books; and honoraria from the American Psychological Association (APA) and Brackett Global. Dr. Sakolsky has received funding from NIMH. She has received an honorarium from Northwell Health for a child and adolescent lecture at Zucker Hillside Hospital in 2018 and has served as an editorial board member of Child and Adolescent Psychopharmacology News. Dr. Birmaher has received research funding from NIMH and royalties for publications from UpToDate, APA, and Random House. Dr. Storch has consulted for Levo Therapeutics. He has received grantfunding from the Greater Houston Community Foundation, the Red Cross, Rebuild Texas, NIH, and the Texas Higher Education Coordinating Board. He has received book royalties from Springer, Elsevier, Wiley, APA, and Lawrence Erlbaum and honorarium for training from the International OCD Foundation. Dr. Kendall has received author royalties from the sales of treatment materials (Guilford, Oxford University Press, and Workbook Publishing); his spouse has a financial interest in and is affiliated with Workbook Publishing. Drs. Gosch and Keeton and Ms. Norris have reported no biomedical financial interests or potential conflicts of interest.
The Child and Adolescent Anxiety Multimodal Study (CAMS) and the Child/Adolescent Anxiety Multimodal Extended Long-term Study (CAMELS) were supported by grants from the National Institute of Mental Health (NIMH; U01 MH064089 to Dr. Walkup; U01 MH64092 to Dr. Albano; U01 MH64003 to Dr. Birmaher; U01 MH63747 to Dr. Kendall; U01 MH64088 to Dr. Piacentini; and U01 MH064003 to Dr. Compton). Funding for this study was provided from the US National Institutes of Health (NIH) awarded to Ms. Norris [F31MH123038]. Views expressed within this article represent those of the authors and are not intended to represent the position of NIMH, NIH, or the US Department of Health and Human Services.
REFERENCES
- 1.Essau CA, Lewinsohn PM, Olaya B, Seeley JR. Anxiety disorders in adolescents and psychosocial outcomes at age 30. J Affective Disord. 2014;163:125–132. [DOI] [PMC free article] [PubMed] [Google Scholar]
- 2.Kessler RC, Berglund P, Demler O, Jin R, Merikangas KR, Walters EE. Lifetime prevalence and age-of-onset distributions of DSM-IV disorders in the National Comorbidity Survey Replication. Arch Gen Psychiatry. 2005;62:593–602. [DOI] [PubMed] [Google Scholar]
- 3.Merikangas KR, He J-p, Burstein M, et al. Lifetime prevalence of mental disorders in US adolescents: results from the National Comorbidity Survey Replication—Adolescent Supplement (NCS-A). J Am Acad Child Adolesc Psychiatry. 2010;49:980–989. [DOI] [PMC free article] [PubMed] [Google Scholar]
- 4.Polanczyk GV, Salum GA, Sugaya LS, Caye A, Rohde LA. Annual research review: a meta-analysis of the worldwide prevalence of mental disorders in children and adolescents. J Child Psychol Psychiatry. 2015;56:345–365. [DOI] [PubMed] [Google Scholar]
- 5.Walkup JT, Albano AM, Piacentini J, et al. Cognitive behavioral therapy, sertraline, or a combination in childhood anxiety. N Engl J Med. 2008;359:2753–2766. [DOI] [PMC free article] [PubMed] [Google Scholar]
- 6.Cummings CM, Caporino NE, Kendall PC. Comorbidity of anxiety and depression in children and adolescents: 20 years after. Psychol Bull. 2014;140:816. [DOI] [PMC free article] [PubMed] [Google Scholar]
- 7.Lopez B, Turner RJ, Saavedra LM. Anxiety and risk for substance dependence among late adolescents/young adults. J Anxiety Disord. 2005;19:275–294. [DOI] [PubMed] [Google Scholar]
- 8.Rudd MD, Joiner TE, Rumzek H. Childhood diagnoses and later risk for multiple suicide attempts. Suicide Life Threat Behav. 2004;34:113–125. [DOI] [PubMed] [Google Scholar]
- 9.Saavedra LM, Silverman WK, Morgan-Lopez AA, Kurtines WM. Cognitive behavioral treatment for childhood anxiety disorders: long-term effects on anxiety and secondary disorders in young adulthood. J Child Psychol Psychiatry. 2010;51:924–934. [DOI] [PubMed] [Google Scholar]
- 10.Ginsburg GS, Becker EM, Keeton CP, et al. Naturalistic follow-up of youths treated for pediatric anxiety disorders. JAMA Psychiatry. 2014;71:310–318. [DOI] [PMC free article] [PubMed] [Google Scholar]
- 11.Gibby BA, Casline EP, Ginsburg GS. Long-term outcomes of youth treated for an anxiety disorder: a critical review. Clin Child Fam Psychol Rev. 2017;20:201–225. [DOI] [PubMed] [Google Scholar]
- 12.Ginsburg GS, Becker-Haimes EM, Keeton C, et al. Results from the Child/Adolescent Anxiety Multimodal Extended Long-term Study (CAMELS): primary anxiety outcomes. J Am Acad Child Adolesc Psychiatry. 2018;57:471–480. [DOI] [PubMed] [Google Scholar]
- 13.Nevo GA, Manassis K. Outcomes for treated anxious children: a critical review of long-term-follow-up studies. Depress Anxiety. 2009;26:650–660. [DOI] [PubMed] [Google Scholar]
- 14.Kotov R, Krueger RF, Watson D. A paradigm shift in psychiatric classification: the Hierarchical Taxonomy OfPsychopathology (HiTOP). WorldPsychiatry. 2018;17:24. [DOI] [PMC free article] [PubMed] [Google Scholar]
- 15.Caspi A, Moffitt TE. All for one and one for all: mental disorders in one dimension. Am J Psychiatry. 2018;175:831–844. [DOI] [PMC free article] [PubMed] [Google Scholar]
- 16.Allegrini AG, Cheesman R, Rimfeld K, et al. The p factor: genetic analyses support a general dimension of psychopathology in childhood and adolescence. J Child Psychol Psychiatry. 2020;61:30–39. [DOI] [PMC free article] [PubMed] [Google Scholar]
- 17.Caspi A, Houts RM, Ambler A, et al. Longitudinal assessment of mental health disorders and comorbidities across 4 decades among participants in the Dunedin Birth Cohort Study. JAMA Netw Open. 2020;3. e203221–e203221. [DOI] [PMC free article] [PubMed] [Google Scholar]
- 18.Hankin BL, Davis EP, Snyder H, Young JF, Glynn LM, Sandman CA. Temperament factors and dimensional, latent bifactor models of child psychopathology: transdiagnostic and specific associations in two youth samples. Psychiatry Res. 2017;252:139–146. [DOI] [PMC free article] [PubMed] [Google Scholar]
- 19.Martel MM, Pan PM, Hoffmann MS, et al. A general psychopathology factor (p factor) in children: structural model analysis and external validation through familial risk and child global executive function. J Abnorm Psychol. 2017;126:137. [DOI] [PubMed] [Google Scholar]
- 20.Patalay P, Fonagy P, Deighton J, Belsky J, Vostanis P, Wolpert M. A general psychopathology factor in early adolescence. Br J Psychiatry. 2015;207:15–22. [DOI] [PubMed] [Google Scholar]
- 21.Miller M, Iosif AM, Young GS, et al. The dysregulation profile in preschoolers with and without a family history of autism spectrum disorder. J Child Psychol Psychiatry. 2019; 60:516–523. [DOI] [PMC free article] [PubMed] [Google Scholar]
- 22.Haltigan JD, Aitken M, Skilling T, et al. “P” and “DP:” examining symptom-level bifactor models of psychopathology and dysregulation in clinically referred children and adolescents. J Am Acad Child Adolesc Psychiatry. 2018;57:384–396. [DOI] [PubMed] [Google Scholar]
- 23.Costello EJ, Mustillo S, Erkanli A, Keeler G, Angold A. Prevalence and development of psychiatric disorders in childhood and adolescence. Arch Gen Psychiatry. 2003;60: 837–844. [DOI] [PubMed] [Google Scholar]
- 24.Swan AJ, Kendall PC. Fear and missing out: youth anxiety and functional outcomes. Clin Psychol (New York). 2016;23:417–435. [Google Scholar]
- 25.Caporino NE, Herres J, Kendall PC, Wolk CB. Dysregulation in youth with anxiety disorders: relationship to acute and 7-to 19-year follow-up outcomes of cognitive-behavioral therapy. Child Psychiatry Hum Dev. 2016;47:539–547. [DOI] [PMC free article] [PubMed] [Google Scholar]
- 26.Masten AS, Cicchetti D. Developmental cascades. Dev. Psychopathol 2010;22:491–495. [DOI] [PubMed] [Google Scholar]
- 27.Compton SN, Walkup JT, Albano AM, et al. Child/Adolescent Anxiety Multimodal Study (CAMS): rationale, design, and methods. Child Adolesc Psychiatry Ment Health. 2010;4:1. [DOI] [PMC free article] [PubMed] [Google Scholar]
- 28.Achenbach TM. Integrative guide for the 1991 CBCL/4–18, YSR, and TRF profiles. Burlington, CT: Department of Psychiatry, University of Vermont; 1991. [Google Scholar]
- 29.McElroy E, Belsky J, Carragher N, Fearon P, Patalay P. Developmental stability of general and specific factors of psychopathology from early childhood to adolescence: dynamic mutualism or p-differentiation? J Child Psychol Psychiatry. 2018;59: 667–675. [DOI] [PMC free article] [PubMed] [Google Scholar]
- 30.Silverman W, Albano A, Barlow D. Manual for the ADIS-IV-C/P. New York, NY: Psychological Corporation; 1996. [Google Scholar]
- 31.Shaffer D, Gould MS, Brasic J, et al. A Children’s Global Assessment Scale (CGAS). Arch Gen Psychiatry. 1983;40:1228–1231. [DOI] [PubMed] [Google Scholar]
- 32.Gowers SG, Harrington RC, Whitton A, et al. Brief scale for measuring the outcomes of emotional and behavioural disorders in children: Health of the Nation Outcome Scales for Children and Adolescents (HoNOSCA). Br J Psychiatry. 1999;174:413–416. [DOI] [PubMed] [Google Scholar]
- 33.Beevor A, Curtis R. HoNOS: Health of the Nation Outcome Scales Health Questionnaire. London: Royal College of Psychiatrists Research Unit; 1995. [Google Scholar]
- 34.Hanssen-Bauer K, Aalen OO, Ruud T, Heyerdahl S. Inter-rater reliability of clinician-rated outcome measures in child and adolescent mental health services. Adm Policy Ment Health. 2007;34:504–512. [DOI] [PubMed] [Google Scholar]
- 35.Pirkis JE, Burgess PM, Kirk PK, Dodson S, Coombs TJ, Williamson MK. A review of the psychometric properties of the Health of the Nation Outcome Scales (HoNOS) family of measures. Health Qual Life Outcomes. 2005;3:76. [DOI] [PMC free article] [PubMed] [Google Scholar]
- 36.Angold A, Costello E, Pickles A, Winder F, Silver D. The development of a questionnaire for use in epidemiological studies of depression in children and adolescents. London: Medical Research Council Child Psychiatry Unit; 1987. [Google Scholar]
- 37.Birmaher B, Khetarpal S, Brent D, et al. The Screen for Child Anxiety Related Emotional Disorders (SCARED): scale construction and psychometric characteristics. J Am Acad Child Adolesc Psychiatry. 1997;36:545–553. [DOI] [PubMed] [Google Scholar]
- 38.Birmaher B, Brent DA, Chiappetta L, Bridge J, Monga S, Baugher M. Psychometric properties of the Screen for Child Anxiety Related Emotional Disorders (SCARED): a replication study. J Am Acad Child Adolesc Psychiatry. 1999;38: 1230–1236. [DOI] [PubMed] [Google Scholar]
- 39.Messer SC, Angold A, Costello EJ, Loeber R. Development of a short questionnaire for use in epidemiological studies of depression in children and adolescents: Factor composition and structure across development. Int J Meth Psych Res. 1995. [Google Scholar]
- 40.Skinner HA, Steinhauer PD, Santa-Barbara J. Family Assessment Measure III: FAM-III [technical manual]. Multi-Health Systems; 1995. [Google Scholar]
- 41.Skinner H, Steinhauer P, Sitarenios G. Family Assessment Measure (FAM) and process model of family functioning. J Fam Ther. 2000;22:190–210. [Google Scholar]
- 42.Reise SP, Morizot J, Hays RD. The role of the bifactor model in resolving dimensionality issues in health outcomes measures. Qual Life Res. 2007;16:19–31. [DOI] [PubMed] [Google Scholar]
- 43.Watts AL, Poore HE, Waldman ID. Riskier tests of the validity of the bifactor model of psychopathology. Clin Psychol Sci. 2019. 2167702619855035. [Google Scholar]
- 44.Tinsley HE, Brown SD. Handbook of Applied Multivariate Statistics and Mathematical Modeling. San Diego, CA: Academic Press; 2000. [Google Scholar]
- 45.Lt Hu, Bentler PM. Cutoff criteria for fit indexes in covariance structure analysis: conventional criteria versus new alternatives. Struct Equat Model. 1999;6:1–55. [Google Scholar]
- 46.Hox JJ, Moerbeek M, Van de Schoot R. Multilevel Analysis: Techniques and Applications. New York, NY: Routledge; 2017. [Google Scholar]
- 47.Armstrong RA. When to use the Bonferroni correction. Ophthalmic Physiol Opt. 2014; 34:502–508. [DOI] [PubMed] [Google Scholar]
- 48.Kenny DA, Kaniskan B, McCoach DB. The performance of RMSEA in models with small degrees of freedom. Sociol Methods Res. 2015;44(3):486–507. [Google Scholar]
- 49.Curry J, Silva S, Rohde P, et al. Recovery and recurrence following treatment for adolescent major depression. Arch Gen Psychiatry. 2011;68:263–269. [DOI] [PMC free article] [PubMed] [Google Scholar]
- 50.Yancey AK, Ortega AN, Kumanyika SK. Effective recruitment and retention of minority research participants. Annu Rev Public Health. 2006;27:1–28. [DOI] [PubMed] [Google Scholar]
- 51.Keeton CP, Caporino NE, Kendall PC, et al. Mood and suicidality outcomes 3–11 years following pediatric anxiety disorder treatment. Depress Anxiety. 2019;36:930–940. [DOI] [PubMed] [Google Scholar]
Associated Data
This section collects any data citations, data availability statements, or supplementary materials included in this article.