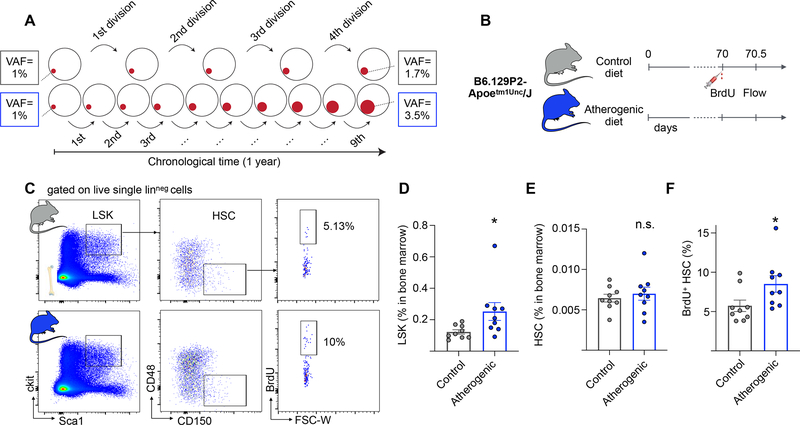
Figure 1. Apoe−/− mice on an atherogenic diet exhibit increased HSC proliferation.
(A) Schematic illustrating hypothetical examples of driver clone growth. HSCs in one person (top row, grey boxes) undergo e.g. 4 symmetric self-renewal divisions per year. A driver that confers a fitness advantage s of 15% will on average expand from a VAF of 1% to 1.7%. HSCs in an person with a 2.25-fold elevated proliferation rate (bottom row, blue boxes) will undergo 9 self-renewal division in the same time, resulting in a driver VAF of 3.5%. (B) Experimental outline. Apoe−/− mice are fed with atherogenic or control (chow) diets for 10 weeks. A BrdU pulse is administered and bone marrow cells are analyzed 12 hours later. (C) Representative flow cytometry plots and gating strategy for bone marrow HSCs. (D-F) Quantification of LSK percentage (D) HSC percentage (E) and BrdU+ HSCs (F) in bone marrow of Apoe−/− mice on atherogenic (n=9) and control (n=9) diets. Data are represented as mean ± SEM. Mann-Whitney tests were used for statistical analysis in D-F. All tests were two-sided. * indicates p<0.05, n.s., not significant. See also Figure S1.

