Abstract
To understand the effects of single‐ and multiple‐drug combinations for hypertension on the risk of adverse clinical outcomes, the authors analyzed data from the International Verapamil SR/Trandolapril Study (INVEST). This trial randomized 22,576 hypertensive patients with coronary artery disease to sustained‐release verapamil or to atenolol as initial agents, followed by trandolapril or hydrochlorothiazide. Electronically collected prescription data from INVEST during 61,835 patient‐years were analyzed using a Cox proportional hazards model with nine covariates (randomization strategy, four average daily dose terms, two ratios measuring the proportion of time the first two drugs in the treatment arm were coprescribed, and two interaction terms). Increasing doses of atenolol and sustained‐release verapamil were associated with decreasing risk of the composite primary outcome (death, myocardial infarction, or stroke). Combination therapy with two drugs (verapamil/trandolapril or atenolol/ hydrochlorothiazide) reduced the risk of primary outcome compared with monotherapy (verapamil or atenolol), and triple therapy (verapamil/trandolapril/hydrochlorothiazide or atenolol/hydrochlorothiazide/trandolapril) further reduced the risk.
Randomized controlled trials in hypertension have contributed to the reduction of cardiovascular (CV) disease by allowing a direct assessment of the effects of initial treatment with single drugs and restricting the drug(s) of interest from the control or comparison group(s). However, multidrug combinations are usually required in high‐risk patients to achieve the lower blood pressure (BP) targets now recommended for organ protection. To better understand the effects of single‐ and multiple‐drug combinations on BP control and CV outcomes in long‐term clinical trials with flexible drug dosing regimens, new analytic techniques are required.
The International Verapamil SR/Trandolapril Study (INVEST) is an example of such a study. 1 The primary protocol‐specified analysis was the standard unadjusted intention‐to‐treat comparison of the two randomized treatment strategies with the assumption that all other factors were balanced between the two strategies. 1 , 2 Other, as yet unpublished, analyses have also been performed to assess the predictive effect of select baseline variables on adverse clinical outcomes using Cox proportional hazards models. However, the novel study design, which used flexible dosing regimens and focused on achieving lower BP targets, does not directly permit assessment of individual effects of each initial antihypertensive drug, since a very small proportion of patients ended up using that drug alone. Furthermore, the use of a shared second‐line agent (trandolapril) for hypertensive patients with diabetes, heart failure, or chronic kidney disease in either randomized group does not easily allow dissection of the effects attributable to it when the data are analyzed solely according to the initial treatment assignments.
Accordingly, the objective of this investigation was to develop a model for predicting the risk of adverse clinical outcomes according to drug and dosing data collected over time for each patient in INVEST. This analysis provides a mechanism to assess dose‐response relationships for each of the preplanned combinations of protocol‐specified drugs on the risk of clinical outcomes.
METHODS INVEST
Study Design
The design, rationale, and results of INVEST have been published in detail previously. 1 , 2 Briefly, INVEST randomized 22,576 hypertensive patients with coronary artery disease to one of two open‐label multidrug hypertension treatment strategies (Figure 1). One strategy began with the sustained‐release (SR) calcium antagonist verapamil, while the other began with the β blocker atenolol. The angiotensin‐converting enzyme inhibitor trandolapril, and/or the thiazide diuretic hydrochlorothiazide (HCTZ), could be added to achieve the BP goals recommended by the then‐current Sixth Report of the Joint National Committee on Prevention, Detection, Evaluation, and Treatment of High Blood Pressure (JNC VI). 3 Trandolapril was recommended in the protocol for all patients with diabetes, renal impairment, or heart failure. Nonstudy antihypertensive medications could also be used in patients who did not achieve their BP goals, despite maximum tolerated doses of study drugs. After 61,835 patient‐years of follow‐up, 2269 patients experienced a primary outcome (first occurrence of all‐cause death, nonfatal myocardial infarction, or nonfatal stroke). BP control was excellent in both treatment strategies, and there was no significant difference across randomized treatment arms in BP reduction or the proportion achieving BP goals. 1 The primary outcome occurred in 9.9% and 10.2% of subjects in the verapamil SR and atenolol strategies, respectively; there was no significant difference in the primary outcome across randomized groups (relative risk, 0.98; 95% confidence interval, 0.90–1.06). 1
Figure 1.
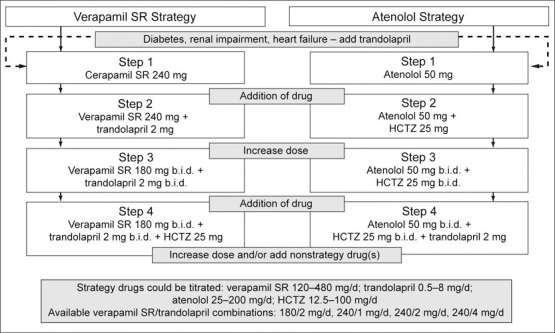
Study design. SR=sustained release; HCTZ=hydrochlorothiazide
All data were captured electronically via the Internet using a purpose‐made Web‐based system, hereinafter referred to as the INVEST system. 2 , 4 , 5 Following online randomization, a prescription was selected from a list of the protocol‐specified drugs and doses within the assigned treatment strategy. At sites within the United States, Canada, and Mexico, this led to direct mailing of select study drug(s) to the patient's home; in the other participating countries, study drugs were dispensed to the patient directly by the site investigator during the study visit. 5 For each study prescription, the date, dose, and quantity prescribed were stored in the database. The quantity of tablets/capsules prescribed was calculated based on the date of the next scheduled study visit, with approximately a 10% surplus to allow for possible delay of the next study visit. At each visit during the study, repeat or new medications were prescribed as needed, using the INVEST system, to achieve target BP goals. For patients initially assigned to the verapamil SR strategy, for whom trandolapril was added, a combination product was available in a variety of approved dose combinations, as an alternative to prescribing the two drugs separately. 6
Overview of Statistical Methods
The primary protocol‐specified efficacy analysis used a chi‐square test to compare the relative risk of the primary outcome in each strategy. Additional analyses using a Cox proportional hazards model were similarly prespecified to incorporate time‐to‐event information in the analyses of the primary efficacy variable and also to account for possible differences in prespecified baseline characteristics across randomized groups. Patients without a documented primary outcome event were censored at their last date of contact before the study closeout in this analysis.
To directly investigate the role of the initial drug and subsequent drug combinations within each treatment strategy, several drug‐related variables were defined. These variables were: 1) four average daily dose variables, one calculated for each study drug (verapamil SR, atenolol, trandolapril, and HCTZ) in mg/d, averaged across the duration of follow‐up for each subject; 2) two ratios reflecting the proportion of time that the first two drugs in each strategy were coprescribed; and 3) two interaction terms, for the average daily dose of either trandolapril or HCTZ within the initial treatment strategy, which allow estimates of the effects of these second‐line drugs to differ between strategies.
Results are presented using a Cox proportional hazards model for the time to primary outcome that included randomized strategy and the eight variables described above to estimate the dose‐response relationship within each of the four strategy drugs and potential differential risk across strategy drugs. All statistical analyses were performed using SAS version 8.2 (SAS Institute, Cary, NC).
Correlations between each of the drug variables were investigated. Average follow‐up systolic BP (SBP) and diastolic BP (DBP) were calculated over all available post‐baseline data. The baseline value was substituted for patients with no follow‐up data. Correlations between average SBP and DBP during follow‐up and the four average daily dose variables were also explored. To investigate the effect of study drugs on the primary outcome, adjusted for BP‐lowering, a Cox proportional hazards model was constructed that included terms for average SBP and DBP during follow‐up.
Definitions and Assumptions
Average Daily Dose. The sequence of antihypertensive drugs was protocol‐specified and differed in each strategy (Figure 1). For each drug, average daily dose for each patient was estimated by dividing the total amount of drug prescribed throughout the study by the length of follow‐up. All drugs were entered into the model as time‐dependent covariates, with zero before the first prescription, and the average daily dose thereafter.
Total Amount of Drug Prescribed. For each patient, the total amount of drug prescribed was calculated as the sum of each prescription amount, obtained from the product of the number of days and daily dose for each prescription for that drug throughout the study, until the date of a primary outcome event or censoring. For example, for each patient randomized to the verapamil SR strategy, total amountverapamil SR = (days covered by prescription1yerapamil SR X daily dose of prescription 2verapamil SR) + (days covered by prescription 2verapamil SR X daily dose of prescription 2verapamil SR) +.…
Any prescription for a fixed combination of verapamil SR and trandolapril was considered individual prescriptions of component drugs in these calculations, so appropriate doses of verapamil SR and trandolapril contributed to the respective total amounts.
A number of assumptions were made due to the real‐world characteristics of data collection. Although the INVEST system recorded date, name, dose, and quantity of each study medication prescribed, the actual quantity of drug dispensed was assumed to have been taken as prescribed.
The INVEST system permitted and recorded changes in prescriptions between scheduled visits. If a patient received a prescription for a new study drug before the next scheduled visit, it was assumed that the investigator intended the drugs to be coprescribed for the duration of the overlap; thus, the total of each prescription was included in respective average daily dose calculations. If the prescription was for a drug that was currently prescribed, but the dose or frequency information differed, the new prescription replaced the previous one. For example, atenolol 50 mg/d was considered to have been stopped on the day before a new prescription for atenolol 100 mg/d was given.
Length of Follow‐up. For each drug, the date of a primary outcome event or censoring used in the Cox proportional hazards model for time to primary outcome, minus the date of first study drug prescription for the drug of interest, was used as length of follow‐up in the denominator to calculate average daily dose.
Proportions of Combination Therapy. Two variables were defined to describe the relative duration of combined use of the first two drugs in each strategy according to the treatment algorithm (Figure 1). The verapamil SR/trandolapril combination ratio was the proportion of days that the combination was prescribed to the total number of days that either verapamil SR or trandolapril was prescribed. The dose combinations available in the study were verapamil SR/trandolapril 180/2 mg, 240/1 mg, 240/2 mg, and 240/4 mg; each could have been prescribed q.d. or b.i.d. Our analyses did not distinguish between separate doses of verapamil SR and trandolapril or their combination (as a single pill).
An analogous atenolol/HCTZ combination ratio was calculated for patients who received atenolol and HCTZ simultaneously. Since this combination is not commercially available, the dose combinations of atenolol/HCTZ included: 50/12.5 mg, 50/25 mg, 100/25 mg, and 100/50 mg, each given q.d. or b.i.d.; these turned out to be the most commonly prescribed doses of this combination.
RESULTS
The defined combination variables provided 5796 patients in the verapamil SR strategy and 5771 patients in the atenolol strategy. The distributions of prescriptions by drug and dose are summarized in Figure 2. A wide variety of dosing options was prescribed. Verapamil SR was prescribed at 240 mg/d for 54% of prescriptions; atenolol was prescribed at 50 mg/d for 52%. In both randomized arms, combination therapy typically used a higher dose of the initial drug: the verapamil SR/trandolapril combination was used in 34% of prescriptions at 360/4 mg/d; atenolol/HCTZ was prescribed in 46% of prescriptions at 100/25 mg/d.
Figure 2.
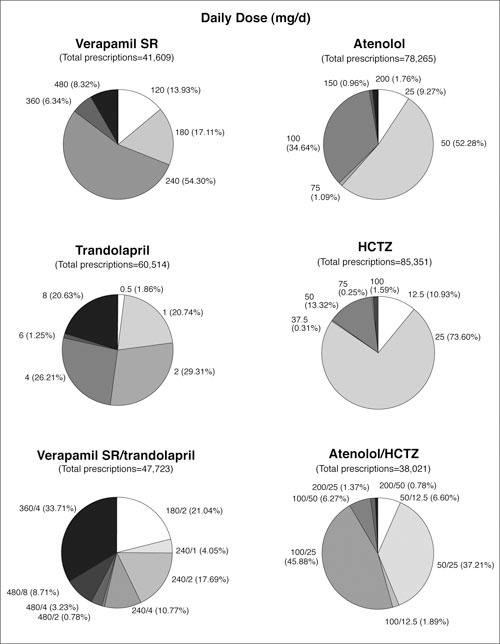
Summary of prescriptions in the International Verapamil SR/Trandolapril Study (INVEST). Verapamil SR/ trandolapril prescriptions combine prescriptions of verapamil SR/transolapril single‐pill combination with coprescriptions of verapamil SR and trandolalpril at available doses of verapamil SR/transolapril combination; atenolol/HCTZ prescriptions are coprescriptions of atenolol and HCTZ at defined doses. SR=sustained release; HCTZ=hydrochlorothiazide
At 24 months of follow‐up, most patients were receiving two or more strategy drugs. 1 The large numbers of prescriptions for add‐on drugs in both strategies (60,514 trandolapril and 85,353 HCTZ), and the coprescriptions for the verapamil/ trandolapril combination and the atenolol/HCTZ combination (47,723 and 38,021, respectively) provide evidence that multiple drug use was frequent (Figure 2).
The frequencies of the primary outcome by categories of average daily dose for each drug are summarized in Figure 3. There are no clear dose‐response patterns. Interpretation of these data is confounded by the fact that the dose categories are arbitrary and do not account for combinations of drugs prescribed simultaneously. Furthermore, these are raw numbers of events divided by the number at risk and do not include time‐to‐event information.
Figure 3.
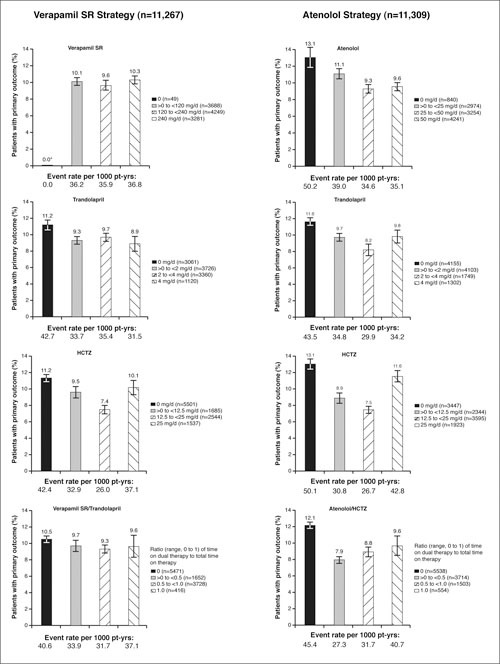
Frequencies of the primary outcome by strategy and category of average daily dose. SR=sustained release; HCTZ=hydrochlorothiazide; pt‐yrs=patient‐years; *the 49 subjects in the verapamil SR strategy who received no prescription of verapamil SR reported no primary outcome events.
A Cox proportional hazards model was constructed to address some of these limitations. To investigate relationships between covariates included in this more complex approach, each pair‐wise correlation was computed. As expected, the highest correlations were between strategy and the two initial drugs (lrl=0.7). The correlations between the verapamil/trandolapril ratio and verapamil SR (0.6) and atenolol/HCTZ ratio and atenolol (0.3) were also reasonably high. All covariates were entered simultaneously into the Cox model.
The results of the Cox proportional hazards model with terms for strategy, each of the four study drugs, the two interactions between strategy and add‐on drug, and the verapamil/trandolapril and atenolol/HCTZ combination ratios are summarized in the Table and illustrated in Figure 4.
Figure 4.
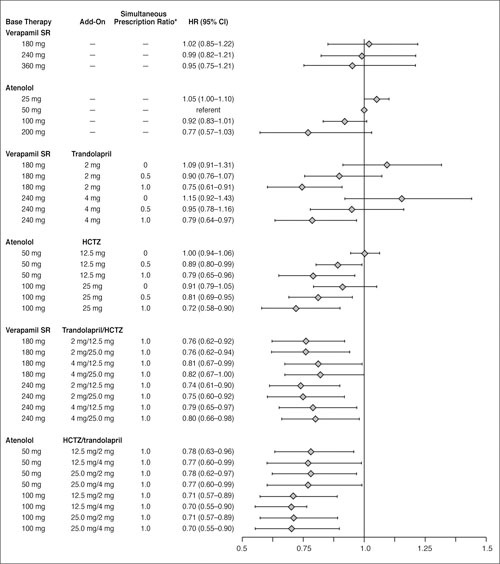
Estimated hazard ratios (HR) and 95% confidence intervals (CI) from Cox proportional hazards model of time to primary outcome for select average daily dose combinations of strategy drugs, relative to atenolol 50 mg/d in the atenolol‐based treatment strategy. SR=sustained release; HCTZ=hydrochlorothiazide; *ratio with a value ranging from 0 to 1 that represents the amount of time specific verapamil SR/trandolapril or atenolol/HCTZ dose combinations were prescribed simultaneously
Hazard ratios (Hrs) for the primary end point for strategy and for each of the initial drugs (verapamil SR and atenolol) were not statistically significant, consistent with the primary efficacy analysis result of equivalence between randomized strategies. 1 However, both the verapamil/trandolapril and atenolol/HCTZ combination ratios were statistically significant (p<0.0001 and p=0.023, respectively; Table). The Hrs in both cases are less than unity, indicating a reduced risk for increasing doses of verapamil SR and atenolol. The HR of 1.04 for the trandolapril strategy interaction suggests increased risk with increasing dose of trandolapril, but this was not statistically significant (p=0.14).
Estimates of HR are also presented in Figure 4 for select doses and dose combinations of study drugs, with associated 95% confidence intervals, using the 50‐mg daily dose of atenolol in the atenolol strategy as a reference (HR, 1.00). The dual combination analysis (in the middle of Figure 4) showed that, as the value of each ratio increased, the risk of the primary outcome decreased for both initial drugs and was independent of the initial doses. The lowest risk estimates were observed with three drugs for both strategies (bottom two sections of Figure 4).
Follow‐up BP was also an important outcome of the study, rather than a baseline parameter. This prevents determination of simultaneous relationships between BP, study drug use, and outcomes, but correlations between average follow‐up SBP and DBP and each of the four average daily dose variables were calculated to obtain some estimate of their associations. The correlations were low for SBP (ǀrǀ≤0.1 for each) and DBP (ǀrǀ≤0.05 for each); but greater between SBP and DBP (r=0.5).
In an exploratory analysis with variables for SBP and DBP added to the previous Cox proportional hazards model, both were statistically significant (p<0.001), with estimated Hrs of 1.03 and 0.97, respectively. The estimates of drug dose effects on the primary outcome from this model that included follow‐up SBP and DBP differed only slightly from those obtained from the original model, and the pattern of the results was unchanged (Figure 5). Similar results were obtained if changes from baseline BPs (rather than the absolute BPs themselves) were used as covariates. In all such analyses, the best prevention of CV events was with “triple” combination therapy; at all doses, the decrease in CV risk was significantly better than monotherapy. With all two‐drug combinations, there was a significant graded prevention of CV events as the “simultaneous prescription ratio” increased from 0 to 1.
Figure 5.
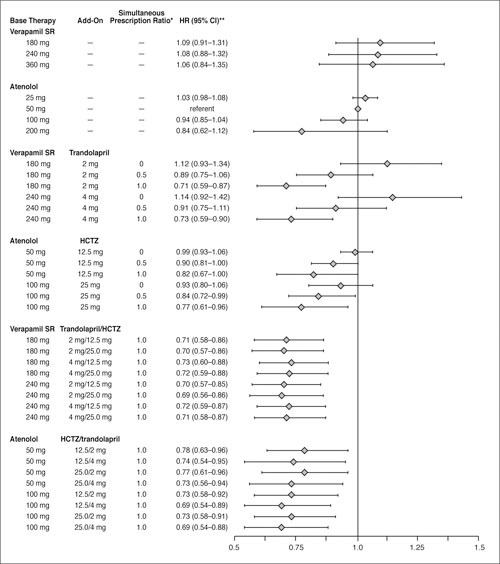
Estimated hazard ratios (HR) and 95% confidence intervals (Cl) from Cox proportional hazards model of time to primary outcome for select average daily dose combinations of strategy drugs, relative to atenolol 50 mg/d in the atenolol‐based treatment strategy, from a model adjusted for average follow‐up systolic blood pressure (SBP) and diastolic blood pressure (DBF). SR=sustained‐release; HCTZ=hydrochlorothiazide; “'ratio with a value ranging from 0 to 1 that represents the amount of time specific verapamil SR/trandolapril or atenolol/HCTZ dose combinations were prescribed simultaneously; **HR (95% CI) has been adjusted for average SBP and DBP.
DISCUSSION
The methodology described here was developed to investigate clinically relevant questions related to study drug prescribing in INVEST, a trial designed to focus on clinical outcomes after intensive BP control with the use of multidrug combinations that encompassed a wide range of dosing regimens. The study design resulted in a high rate of BP control and allowed the use of an angiotensin‐converting enzyme inhibitor, followed by a diuretic if needed for BP control, in patients with high‐risk conditions (protocol‐specified as heart failure, diabetes, or renal impairment). We have described an approach that uses nonconventional Cox modeling, since the covariates in the model in this case are not fixed at randomization, but instead dependent on the progress of each patient throughout follow‐up during the study. Our objective was to incorporate as much of the data containing dose information available from the INVEST system as possible, rather than to assume that a clinical outcome was attributed only to the most recent, or most frequent, prescription.
The INVEST system was designed to collect data about a large number of patients, using a flexible drug dispensing methodology. Accordingly, there were certain limitations to this analysis. The assumptions needed to estimate one value per patient per drug were considered the most appropriate, but may have been less than optimal in some cases. The most obvious of these assumptions was that we assumed that all medications were taken as prescribed.
By the study design and treatment algorithm, it could be predicted that patients with well‐controlled BP require less medication and patients with poorly controlled BP or high‐risk conditions (for example, protocol‐specified as heart failure, diabetes, or renal impairment) require more medication. The low correlations observed between follow‐up BP and drug use could, however, illustrate the possible confusion of simultaneously assessing two outcomes of the study. Subjects with low follow‐up SBP could either be well‐controlled on large doses of drug(s) or be comparatively healthy and need only a very low dose. On the other hand, subjects with high follow‐up SBP could either be receiving an inadequately low dose or receiving a substantial dose, but still not have achieved BP control. This hypothesis is supported by the observation that the estimates relating to study drug use are stable and robust to adjustment for follow‐up BP or for change from baseline to average follow‐up BP.
Our model's results provide more specific estimates of the effect of each drug, and of combination therapy, that could not be detected using a more conventional approach of assessing individual frequency distributions. No differences were observed between strategy or initial drug use; however, increasing doses of the initial drugs, atenolol or verapamil SR, were associated with decreasing risk of the primary outcome. Furthermore, coprescription of two (verapamil/trandolapril or atenolol/HCTZ) or three medications (verapamil/trandolapril/HCTZ or atenolol/HCTZ/trandol‐april) also reduced the risk of a primary outcome in both strategies, perhaps because it led to lower BPs. The nonsignificantly increased risk associated with increasing doses of trandolapril alone is likely to be the result of “indication bias”: the protocol specified that all high‐risk patients (history of heart failure, renal impairment, or diabetes) were to receive trandolapril at randomization.
Despite the complex study design and the potential for confounding influences of BP control and drug dosing on clinical outcomes, we have developed a methodology to address whether trends in dose response, or relative benefits between different antihypertensive medications, could be identified in future investigations. This question applied originally to the analysis of the primary outcome, but could also be extended to secondary and other outcomes of INVEST. The lower incidence of diabetes in the group randomized to verapamil is of particular clinical and public health interest. 1 Other work suggests that inhibitors of the renin‐angiotensin‐aldosterone system are more likely than other classes of antihypertensive drugs to prevent diabetes. 7 , 8
Several sensitivity analyses using this model showed little change in the overall results. Forcing follow‐up BPs into the model (Figure 5), categoric variables for any study drug, inclusion of nonstudy drugs (according to pharmacologic classes), omitting treatment strategy, omitting the verapamil/ trandolapril and atenolol/HCTZ ratios, and even omitting the interaction terms, all resulted in estimates of the drug effects that were very similar to our original model (Figure 4).
In conclusion, the drug‐modelling methodology developed to analyze data from INVEST is a useful alternative and addition to more standard methodologies. This new methodology complements existing methodologies, because the new model allows for changes in drug dosages, combination therapy, and add‐on therapy, all of which are an inherent part of modern long‐term antihypertensive treatment strategies.
Acknowledgments and disclosure: We thank Xiaolei Leahy and Qian Zhou for their assistance with programming the data presented. Financial support for this work was provided by the University of Florida and Abbott Laboratories.
References
- 1. Pepine CJ, Handberg EM, Cooper‐DeHoff RM, et al. Main outcomes from the International Verapamil‐Trandolapril Study (INVEST): a randomized trial of a calcium antagonist strategy versus a noncalcium antagonist strategy for the treatment of hypertension in patients with coronary artery disease. JAMA. 2003; 290:2805–2816. [DOI] [PubMed] [Google Scholar]
- 2. Pepine CJ, Handberg‐Thurmond E, Marks RG, et al. Rationale and design of the International Verapamil SR/Trandolapril Study (INVEST): an Internet‐based randomized trial in coronary artery disease patients with hypertension. J Am Coll Cardiol. 1998; 32:1228–1237. [DOI] [PubMed] [Google Scholar]
- 3. The Sixth Report of the Joint National Committee on Prevention, Detection, Evaluation, and Treatment of High Blood Pressure. Arch Intern Med. 1997; 157:2413–2446. [DOI] [PubMed] [Google Scholar]
- 4. Marks R, Bristol H, Conlon M, et al. Enhancing clinical trials on the internet: lessons from INVEST. Clin Cardiol. 2001;24(11 suppl):V17–V23. [DOI] [PMC free article] [PubMed] [Google Scholar]
- 5. Cooper‐DeHoff R, Handberg E, Heissenberg C, et al. Electronic prescribing via the internet for a coronary artery disease and hypertension megatrial. Clin Cardiol. 2001;24(11 suppl):V14–V16. [DOI] [PMC free article] [PubMed] [Google Scholar]
- 6. Hassell A, Johnson F, Fox W, et al. The bioequivalence of Tarka, a combination of trandolapril and Isoptin SR versus their individual components, at steady state, in normal volunteers [abstract]. Pharm Res. 1995;12(suppl):418. [Google Scholar]
- 7. Scheen AJ. Renin‐angiotensin system inhibition prevents type 2 diabetes mellitus, Part I: a meta‐analysis of randomised clinical trials. Diabetes Metab. 2004; 30:487–496. [DOI] [PubMed] [Google Scholar]
- 8. Elliott WJ. Differential effects of antihypertensive drugs on new‐onset diabetes? Curr Hypertens Rep. 2005; 7:249–256. [DOI] [PubMed] [Google Scholar]


