Abstract
The authors hypothesized that the Dietary Approaches to Stop Hypertension (DASH) diet and reduced sodium intake would control stage 1 hypertension and reduce high‐normal blood pressure (BP) to optimal levels. Adults with systolic BP 120–159 mm Hg and diastolic BP 80–95 mm Hg were randomly assigned to receive the DASH diet or a typical American (control) diet, consuming three different sodium intakes (higher=142 mmol/d, intermediate=07 mmol/d, and lower=65 mmol/d) for 30 days each. BP control was defined as systolic BP <140 mm Hg and diastolic BP <90 mm Hg. Among subjects with hypertension at baseline, at higher sodium intake the DASH diet increased BP control two‐fold over control (63% vs. 32%; 95% confidence interval, 1.4–2.9). Reducing sodium intake in the control diet group increased BP control 2.3‐fold (74% vs. 32%; 95% confidence interval, 1.7–3.2). The maximum BP control rate (84%) was achieved with the DASH/lower sodium diet. BP became normal or optimal in 71% of persons consuming the control/lower sodium diet and 77% of persons consuming the DASH/lower sodium diet. Both the DASH diet and reduced sodium intake improved BP control.
Hypertension is a major risk factor for cardiovascular disease and a major public health problem in the United States due to its high prevalence. For example, the lifetime risk of developing hypertension in Americans aged 55–65 years has been estimated as 90%. 1 Control of hypertension in the United States is inadequate. Almost half of persons with hypertension are not diagnosed or, if diagnosed, not treated, and among treated hypertensives, only about half achieve the currently recommended goal of systolic blood pressure (SBP) <140 mm Hg and diastolic blood pressure (DBP) <90 mm Hg. 2 Predictors of poor control include older age, male sex, and not having visited a doctor in the past 12 months. 3 In addition, despite published guidelines, even those who do visit a doctor are often not adequately treated for elevated blood pressure (BP). In a survey conducted at five Veterans Administration hospitals, antihypertensive therapy was intensified in only 6.7% of office visits despite the fact that BP remained elevated in 40% of those patients. 4 The majority of primary care physicians report that they do not intensify treatment when SBP is 140–160 mm Hg or DBP is 90–95 mm Hg unless the patient is younger than age 60 years. 5 A large proportion of these physicians are unfamiliar with current national guidelines for hypertension control. 2 , 5 Clearly, national efforts to improve control of high BP will require convincing clinicians to become more aggressive about its pharmacologic treatment. A complimentary strategy for BP control is the increased use of effective nonpharmacologic interventions.
Nonpharmacologic strategies may also offer an opportunity to move persons with high‐normal BP (the upper end of the prehypertension category by current guidelines 6 ) into a more advantageous BP category (either normal or optimal). High‐normal BP, compared with optimal BP, more than doubles cardiovascular disease (CVD) risk in women and increases risk by 60% in men. 7 Because CVD risk decreases with lower BP levels, even below the hypertension cutpoint, it is reasonable to suppose that nonpharmacologic approaches that reduce BP from high‐normal to normal or optimal BP would reduce CVD risk. Such a shift to lower categories of BP could also be expected to reduce the incidence of hypertension over time.
The Dietary Approaches to Stop Hypertension (DASH) dietary pattern, which emphasizes fruits, vegetables, and low‐fat dairy products, as well as a reduced sodium intake diet, both significantly lower BP in persons with stage 1 hypertension and in those with high‐normal BP. 8 , 9 , 10 , 11 The DASH diet also lowers BP in those with isolated systolic hypertension. 12 Therefore, both DASH and reduced sodium intake, separately and combined, have the potential to improve BP control rates. Previous reports have dealt with mean BP changes with the DASH dietary pattern and/or a reduced sodium intake diet without other changes in dietary pattern. Given the observed BP changes, we hypothesized that the DASH dietary pattern, a control diet with a reduced sodium intake, and both combined (compared with a typical American diet) would lead to improved BP control in DASH‐Sodium study participants who were hypertensive upon study entry. We also hypothesized that these interventions would lead to normal or optimal BP in a proportion of persons with high‐normal BP (prehypertension) at study entry. Approaching the DASH‐Sodium study results in this way provides additional insight into the potential clinical impact of these dietary interventions.
METHODS
The design of the DASH‐Sodium trial has been described in detail elsewhere. 10 , 13 It was a multicenter, randomized feeding study comparing the effects on BP of three levels of sodium intake and two dietary patterns among adults with above‐optimal BP or unmedicated stage 1 hypertension.
Study Population
Participants included 412 adults aged 22 years or older with BP averaged over three screening visits of 120–159 mm Hg systolic and 80–95 mm Hg diastolic. 10 Thus the study participants had baseline BP levels that were above optimal, and fit into the sixth Joint National Committee on the Prevention, Detection, and Treatment of High Blood Pressure (JNC VI) categories of normal but above optimal, high‐normal, or stage 1 hypertension (Table I). The seventh JNC has designated the above optimal and high‐normal group as having prehypertension. 6 Exclusion criteria were heart disease, renal insufficiency, poorly controlled hyperlipidemia or diabetes mellitus, insulin‐requiring diabetes, special dietary requirements, intake of more than 14 alcoholic drinks per week, or use of antihypertensive drugs or other medications that would affect BP or nutrient metabolism. The Human Subjects Committees of the clinical centers and coordinating center approved the study, and each participant gave informed consent. A National Heart, Lung, and Blood Institute‐appointed Data and Safety Monitoring Board provided oversight.
Table I.
Classification of Blood Pressure for Adults Aged 18 Years and Older, and Distribution of Blood Pressure Category in Study Participants
| Blood Pressure (mm Hg) | Participants in This Category at Baseline | ||||
|---|---|---|---|---|---|
| Category* | Systolic | Diastolic | n | % | |
| Optimal | <120 | and | <80 | 0 | 0 |
| Normal† | <130 | and | <85 | 104 | 27 |
| High‐normal† | 130–139 | or | 85–89 | 131 | 33 |
| Hypertension | |||||
| Stage 1 | 140–159 | or | 90–99 | 155 | 40 |
| Stage 2 | 160–179 | or | 100–109 | … | … |
| Stage 3 | ≥180 | or | ≥110 | … | … |
| Total | 390 | 100 | |||
| *If systolic blood pressure and diastolic blood pressure categories are discordant, choose the higher category; †the seventh report of the Joint National Committee on Prevention, Detection, Evaluation, and Treatment of High Blood Pressure has designated these patients as prehypertensive. 6 Adapted with permission from Arch Intern Med. 1997;157:2413–2446. 2 | |||||
Feeding Protocol
Throughout the study, participants received all of their food from study personnel and were asked not to eat any nonstudy food. Individual energy intake was adjusted to keep weight stable. Two dietary patterns were prepared at one of three sodium levels (lower, intermediate, and higher), the sodium content of which varied according to energy intake in the ratio 1:2:3, with targets of 50 mmol/d, 100 mmol/d, and 150 mmol/d, respectively, for a 2100 kcal diet. The two dietary patterns were a control diet, typical of what many Americans eat, and the DASH diet, which, by comparison, emphasizes fruits, vegetables, and low‐fat dairy foods, includes whole grains, poultry, fish, and nuts, and is reduced in fats, red meat, sweets, and sugar‐containing beverages. 13 , 14 Before randomization, participants ate the control diet at the higher sodium level during a 2‐week run‐in period. They were then randomly assigned to one of the two dietary patterns (control or DASH) using a parallel group design. Each participant ate his or her assigned dietary pattern for three consecutive 30‐day intervention feeding periods, with a different sodium level during each period, assigned in random order.
Measurement Protocol
Trained staff measured BP at each of three screening visits, on 2 days during the run‐in period, and on five of the last 9 days of each intervention feeding period. Interim BPs were also assessed once during each of the first 3 weeks of each intervention feeding period for safety monitoring. At each BP measurement visit, the average of two readings was recorded as the BP for that visit.
During screening and the last week of each intervention feeding period, a 24‐hour urine collection was obtained for measurement of sodium excretion and of other nutrients. Height (meters) was measured at baseline and weight (kilograms) was measured at each clinic visit; body mass index was calculated as weight divided by height‐squared. Medical history and alcohol consumption were obtained by self‐report.
Baseline BP was defined as the average of the five sets of preintervention BPs. End‐of‐feeding BP was defined as the average of the five sets of BPs measured at the end of each 30‐day intervention feeding period. If fewer than five were available, end‐of‐feeding BP was defined as the average of all recordings that were available.
BP was categorized as optimal, normal, high‐normal, or stage 1 hypertension according to JNC VI guidelines (the guidelines that were available when the study was done) (Table I). 2 When SBP and DBP were in different categories, the higher category was assigned. Isolated systolic hypertension (ISH) was defined as SBP ≥140 mm Hg and DBP <90 mm Hg. BP control was defined as SBP <140 mm Hg and DBP <90 mm Hg.
Statistical Methods
Participant characteristics were compared at baseline between those assigned to the control and DASH diets in subgroups defined by the presence of hypertension, ISH, and high‐normal BP at baseline. The proportions of hypertensive participants attaining BP control on the lower and intermediate sodium levels were compared with that on the higher sodium level using McNemar's test for correlated binary data, which conditions on the number of discordant patients (i.e., controlled on one sodium level but not the other) and determines whether the two types of discordance (controlled on lower but not higher, and controlled on higher but not lower) are equally likely.
The relative risk of attaining BP control on one sodium level compared with the higher sodium level was computed, and an approximate 95% confidence interval was obtained using a slight modification of the formula for independent data.* Standard χ 2 techniques were used to compare proportions achieving BP control across diets at a fixed sodium level. All tests were two‐tailed using significance level α=0.05. Mean systolic BPs at end‐of‐feeding for each diet/sodium intervention were calculated for those with hypertension, ISH, and high‐normal BP at baseline. In addition, the proportions of participants with high‐normal BP at baseline who attained optimal, normal, high‐normal, or elevated BP with each dietary intervention were calculated.
RESULTS
Four hundred twelve persons were randomized into the DASH‐Sodium trial; 390 had at least one BP at the end of all of the three intervention feeding periods, and are included in this analysis. At baseline, 155 of these persons had stage 1 hypertension, of whom 77 had ISH. An additional 131 had high‐normal BP at baseline, and the remaining 104 had normal but above optimal BP (Table I).
Table II shows baseline characteristics of those participants who had stage 1 hypertension, ISH, and high‐normal BP at baseline, by diet assignment. As expected, persons with hypertension, and especially ISH, were slightly older than those with high‐normal BP. Participants with hypertension and ISH were more likely to be women. Baseline values were generally similar between control and DASH participants, although 30% of hypertensives assigned to the control diet compared with 23% of those assigned to the DASH diet had taken BP medication at some time in the past; corresponding proportions for ISH were 33% and 32%, respectively. Although not hypertensive at baseline, 13%–14% of those with high‐normal BP had taken BP medications in the past, and more than a third had been previously told that they had hypertension. Baseline sodium excretion, reflecting average intake, was approximately 150 mmol/d, with little difference between those who were hypertensive and those who were not.
Table II.
Baseline Characteristics
| Stage I Hypertensives | ISH | High‐Normal BP | ||||
|---|---|---|---|---|---|---|
| n | Control 76 | DASH 79 | Control 40 | DASH 37 | Control 68 | DASH 63 |
| Age (y) | 52.0±10.3 | 49.4±10.8 | 53.7±11.1 | 54.8±10.9 | 48.1±10.3 | 48.1±8.6 |
| Women (%) | 60.5 | 63.3 | 60.0 | 73.0 | 55.8 | 57.1 |
| Race/ethnicity (%) | ||||||
| Non‐Hispanic white | 35.5 | 38.0 | 40.0 | 37.8 | 35.3 | 38.1 |
| African American | 59.2 | 60.8 | 57.5 | 59.5 | 60.3 | 58.7 |
| Other | 5.3 | 1.3 | 2.5 | 2.7 | 4.4 | 3.2 |
| Baseline systolic BP (mm Hg) | 144.1±7.2 | 142.0±8.0 | 145.7±4.7 | 146.6±5.0 | 132.4±4.5 | 132.0±4.2 |
| Baseline diastolic BP (mm Hg) | 88.1±4.1 | 88.6±4.9 | 84.9±2.9 | 84.2±3.4 | 85.3±2.9 | 84.9±3.2 |
| BMI | 29.5±5.0 | 28.3±5.0 | 30.0±4.6 | 28.6±5.5 | 29.6±5.3 | 29.9±4.8 |
| Taken BP medication (%) | 30.3 | 22.8 | 32.5 | 32.4 | 13.2 | 14.3 |
| Been told by physician they are hypertensive (%) | 56.6 | 58.2 | 57.5 | 59.5 | 39.7 | 34.9 |
| Alcohol intake (drinks/wk) | 1.0±1.9 | 1.2±2.0 | 0.9±1.6 | 1.2±2.2 | 1.6±2.6 | 1.1±1.9 |
| Baseline urinary sodium (mmol/24 hour) | 153.4±73.1 | 157.5±79.7 | 154.3±68.5 | 150.1±72.5 | 149.6±75.6 | 155.3±78.5 |
| ISH=isolated systolic hypertension; BP=blood pressure; DASH=Dietary Approaches to Stop Hypertension diet; BMI=body mass index | ||||||
Figure 1 shows BP control rates in the 155 DASH‐Sodium participants who were hypertensive at baseline, and in the subset of 77 hypertensives with ISH. BP control was defined as both SBP <140 mm Hg and DBP <90 mm Hg at the end of a given feeding period. Among hypertensive participants assigned to the control diet, 32%, 51%, and 74% achieved BP control after 30 days of higher, intermediate, and lower sodium intake, respectively. Corresponding percentages for those eating the DASH diet were 63%, 65%, and 84%, respectively. Thus hypertensive participants eating the DASH diet at the higher sodium level were 2.0 times more likely than participants eating the control diet at the higher sodium level to achieve BP control (95% confidence interval [CI], 1.4–2.9). The control diet at the higher sodium level reflects typical American intake and was similar to the participants' intake at baseline. Compared with this pattern, the BP control rates with the DASH diet at intermediate and lower sodium intake were 2.0 and 2.6 times higher, respectively (95% CI, 1.4–3.0 and 1.9–3.7, respectively). Maximum BP control rates were achieved in participants eating the DASH diet at the lower sodium level (84%).
Figure 1.
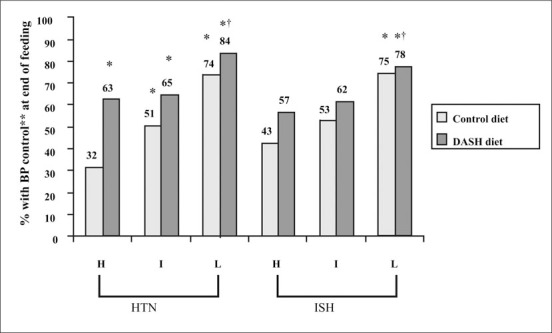
End‐of‐feeding blood pressure (BP) control rates (%) by diet and sodium level for Dietary Approaches to Stop Hypertension (DASH)‐Sodium trial participants who were hypertensive (HTN) at baseline (systolic BP ≥140 mm Hg or diastolic BP ≥90 mm Hg) and in those who had isolated systolic hypertension (ISH) at baseline (systolic BP ≥140 mm Hg and diastolic BP <90 mm Hg). H=higher sodium level (142 mmol/d); I=intermediate sodium level (107 mmol/d); L=lower sodium level (65 mmol/d); *p<0.01 compared with control diet at higher sodium level; †p<0.05 compared with DASH diet at higher sodium level; **BP control was defined as systolic BP <140 mm Hg and diastolic BP <90 mm Hg.
Comparing sodium effects in hypertensives within each dietary pattern, BP was 2.3 times more likely to be controlled when individuals ate the control diet at the lower sodium intake than when they ate the control diet at the higher sodium intake (95% CI, 1.7–3.2). The control diet with intermediate sodium intake also increased control rates by 1.6 times, compared with control diet at the higher sodium intake (95% CI, 1.2–2.2). In addition, lower compared with higher sodium improved BP control in those eating the DASH diet (p<0.05).
A similar pattern of BP control was observed in participants with ISH at baseline (Figure 1). Forty‐three percent, 53%, and 75% achieved BP control with the control diet at higher, intermediate, and lower sodium intakes, respectively. Fifty‐seven percent, 62%, and 78% achieved BP control with the DASH diet at those sodium intakes. Compared with participants with ISH who ate the typical American dietary pattern (control diet at higher sodium intake), those who ate the DASH diet at the lower sodium intake had 1.8 times higher BP control rates (95% CI, 1.2–2.7).
As expected, improvements in control rates are reflected in reductions in mean BP. Figure 2 and Figure 3 display mean SBP levels by dietary pattern and sodium level for those who were hypertensive at baseline (Figure 2) and in the subset of hypertensives who had ISH at baseline (Figure 3). A similar pattern was observed for DBP (data not shown). Additional data on BP change in the hypertensive subgroup can be found in Vollmer et al. 11
Figure 2.
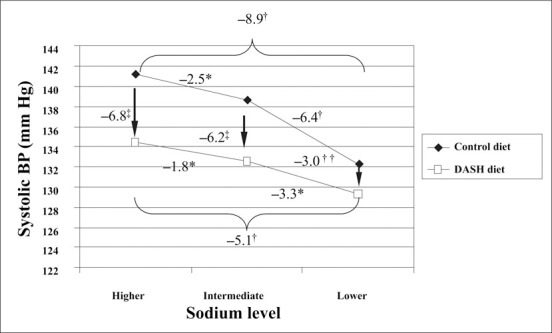
Mean end‐of‐feeding systolic blood pressure (BP) (mm Hg) of 155 participants with hypertension by diet and sodium level. For effect of sodium *p<0.05,†p<0.0001 within diet group, for effect of Dietary Approaches to Stop Hypertension (DASH) diet‡p<0.0001††p<0.05 between diet groups.
Figure 3.
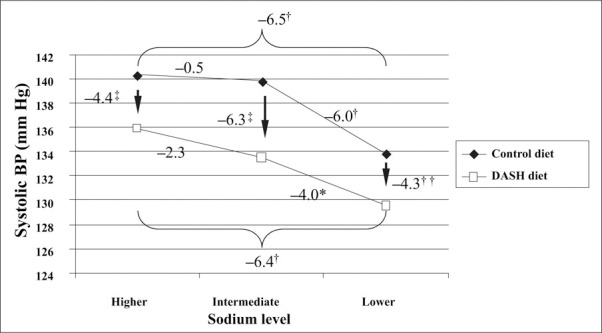
Mean end‐of‐feeding systolic blood pressure (BP) (mm Hg) of 77 participants with isolated systolic hypertension, by diet and sodium level. For effect of sodium *p<0.05, †p<0.0001 within diet group and for effect of Dietary Approaches to Stop Hypertension (DASH) diet‡p<0.0001,††p<0.05 between diet groups.
Figure 4 demonstrates that for those study participants who had high‐normal BP at baseline, BP became optimal or normal in 71% of those persons who ate the control diet at the lower sodium level (optimal in 28% and normal in 43%). The DASH diet with intermediate sodium intake improved BP in 68% (optimal in 27% and normal in 41%) and DASH with lower sodium intake improved BP in 76%. Among the participants with high normal BP at baseline, only 24% remained high‐normal or hypertensive on the DASH diet with lower sodium. In the 131 persons who had high‐normal BP at baseline, SBP declined with each successively lower sodium level, and was lower with the DASH compared with control diet at higher and intermediate sodium levels (Figure 5). There was no additional benefit of the lower sodium level in this subgroup.
Figure 4.
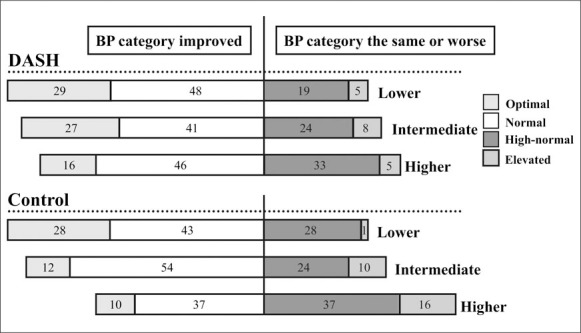
Blood pressure (BP) category at end of intervention in participants with high‐normal BP at baseline. Among the 131 Dietary Approaches to Stop Hypertension‐Sodium trial participants with high‐normal BP at baseline, the percent who had optimal (systolic BP <120 mm Hg and diastolic BP <80 mm Hg), normal (systolic BP 120–129 mm Hg and diastolic BP 80–84 mm Hg), high normal (systolic BP 130–139 mm Hg and diastolic BP 85–89 mm Hg), or elevated (systolic BP ≥140 mm Hg or diastolic BP ≥90 mm Hg) BP with dietary intervention. BP category is defined by whichever category (systolic BP or diastolic BP) is higher; categories are mutually exclusive.
Figure 5.
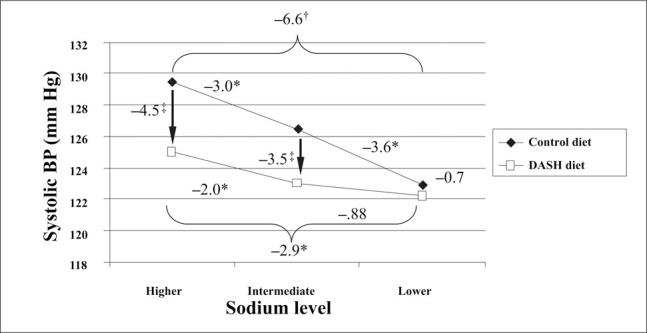
Mean end‐of‐feeding systolic blood pressure (BP) (mm Hg) of 131 participants with high‐normal BP, by diet and sodium level. For effect of sodium *p<0.05,†p<0.0001 within diet group and for effect of Dietary Approaches to Stop Hypertension (DASH) diet‡p<0.0001,‡p<0.05 between diet groups.
DISCUSSION
The high rate of undiagnosed and uncontrolled hypertension is often cited as a clarion call for increased medical management of high BP. 2 However, hypertension is already the most common nontraumatic reason for a visit to a physician's office, and antihypertensive medications cost more than $10 billion per year. 15 The resources that would be required to successfully control hypertension solely by increasing medical care and medication treatment for the estimated 32 million Americans with undiagnosed or inadequately controlled hypertension are considerable. In addition, it is clear that cardiovascular risk is not confined to levels that meet criteria for a diagnosis of clinical hypertension. Above optimal BP also carries significant risk and has recently been termed prehypertension to reflect this risk. 7 Indeed, the number of persons with above optimal BP or stage 1 hypertension is so large that the majority of BP‐related CVD events occur in this segment of the population. 16 , 17 Clearly, to achieve the greatest reduction in these events, the medical management of hypertension must be complemented by effective nonpharmacologic strategies that can be applied at the population level.
Population‐based change in dietary pattern has been proposed as a nonpharmacologic strategy for controlling and preventing hypertension. Our study demonstrates the ability of the DASH dietary pattern or a reduced sodium intake, separately and combined, to improve BP control rates in persons with hypertension. In this study, 63% of persons with stage 1 hypertension achieved current BP treatment goals after adopting the DASH dietary pattern, and 51% achieved goal BP simply by reducing sodium intake to currently recommended levels without a major change in other dietary components. Seventy‐four percent achieved goal BP on more aggressive sodium reduction alone, and 84% achieved goal BP with the combination of DASH diet and lower sodium intake. Similar benefits were noted in persons with ISH, a growing segment of the hypertensive population. In addition, it is clear that high‐normal BP that is not in the hypertensive range is nonetheless associated with increased risk of CVD 7 and that many persons with high‐normal BP will progress to clinical hypertension as they age. The current study demonstrates the ability of the DASH dietary pattern or a reduced sodium intake without other dietary changes to convert high‐normal BP to more optimal levels, potentially reducing BP‐related CVD events and preventing the development of hypertension. The DASH diet plus sodium reduction was shown to be even more effective than either diet alone in reducing BP.
The DASH‐Sodium study was a relatively short‐term feeding study that was not conducted in a real‐world setting of free‐living persons making food choices, but the current study and previous data 8 , 10 suggest that the BP‐lowering effects are sustained as long as the dietary pattern and sodium level remained unchanged. These data imply that long‐term adherence to these dietary interventions would lead to better long‐term BP control. All foods were provided to study participants, leaving open for future investigation the question of the extent to which persons choosing and preparing their own foods can adhere to the DASH dietary pattern and reduce sodium intake. Clearly, the ability of these dietary interventions to control BP will only be realized with their successful and sustained implementation in free‐living populations. However, the consistency of results across age, sex, and race subgroups 9 , 11 suggests that public health strategies that achieve implementation of dietary changes can benefit a large cross‐section of the population at risk.
Our study included persons with stage 1 hypertension, including a subset with stage 1 ISH. The extent to which these interventions can improve BP control rates when combined with pharmacotherapy in persons with more severe hypertension is unknown. Approximately half of all patients on antihypertensive medication have inadequately controlled BP. 2 The DASH diet is known to lower BP in patients taking the angiotensin receptor blocker losartan. 18 In addition, reduced sodium intake, which stimulates the renin‐angiotensin system, improves the efficacy of angiotensin converting enzyme inhibitors and angiotensin receptor blockers. 19 These findings suggest that BP control rates will improve with the addition of DASH diet and reduced sodium intake in patients treated with at least some types of antihypertensive medication. This hypothesis remains to be tested further in clinical trials.
Both the DASH diet and a reduced sodium intake significantly improved BP control in persons with hypertension and led to optimal or normal BP in many persons with high‐normal BP. Public health and clinical strategies for improving BP control rates should include recommendations to follow the DASH dietary pattern and to reduce sodium intake.
*Denote the proportions attaining BP control on lower and higher sodium levels by pL and pH, respectively. We use the delta method to obtain the large‐sample distribution of 1π(pL/pH): 1π(pL/pH)≈1π(πL)+(1/πL)(pL−πL)−{1π(πH)+(1/πH)(pH−πH)}, where πL and πH are the probabilities of attaining BP control on the lower and higher sodium levels, respectively. The logarithm of the relative risk is approximately normally distributed with mean 1π(πL/πH) and variance: v=(πL)−2var(pL)+ (πH)−2var(pH)−2(πLπH)−1cov(pL,pH), where var and cov denote variance and covariance, respectively. Let pLH,PL, not H,Pnot L,H, and pnot L, not H denote the proportions of participants controlled on the lower and higher, lower but not higher, higher but not lower, and neither lower nor higher sodium levels, respectively. Simplifying the expression for v and substituting sample estimates for probabilities yields the approximate variance v=(1/π){(1−pL)/pL+(1−pH)/pH−2(pLpH)−1 [pLHpnot L, not H−pnot L,HpL, not H]}. This leads to the approximate 95% CI for the population relative risk: [(RR)exp(−1.96v1½2), (RR)exp(+1.96v1½2)], where RR is the sample relative risk.
Disclosure:
This research was supported by cooperative agreement and other awards from the National Heart, Lung, and Blood Institute, National Institutes of Health, to Brigham and Women's Hospital (U01‐HL 57173), Duke University (U01‐HL57114), Pennington Biomedical Research Institute (U01‐HL57190), Johns Hopkins University (U01‐HL57139, K08 HL03857–01), and Kaiser Permanente Center for Health Research (U01‐HL57156), and from the General Clinical Research Center Program of the National Center for Research Resources, National Institutes of Health to Brigham and Women's Hospital (M01‐RR02635) and Johns Hopkins University (M01‐RR00722).
References
- 1. Vasan RS, Beiser A, Seshadri S, et al. Residual lifetime risk for developing hypertension in middle‐aged women and men: the Framingham Heart Study. JAMA. 2002;287:1003–1010. [DOI] [PubMed] [Google Scholar]
- 2. The sixth report of the Joint National Committee on prevention, detection, evaluation, and treatment of high blood pressure. Arch Intern Med. 1997;157:2413–2446. [DOI] [PubMed] [Google Scholar]
- 3. Hyman DJ, Pavlik VN. Characteristics of patients with uncontrolled hypertension in the United States. N Engl J Med. 2001;345:479–486. [DOI] [PubMed] [Google Scholar]
- 4. Berlowitz DR, Ash AS, Hickey EC, et al. Inadequate management of blood pressure in a hypertensive population. N Engl J Med. 1998;339:1957–1963. [DOI] [PubMed] [Google Scholar]
- 5. Hyman DJ, Pavlik VN. Self‐reported hypertension treatment practices among primary care physicians: blood pressure thresholds, drug choices, and the role of guidelines and evidence‐based medicine. Arch Intern Med. 2000;160:2281–2286. [DOI] [PubMed] [Google Scholar]
- 6. Chobanian AV, Bakris GL, Black HR. Seventh report of the Joint National Committee on Prevention, Detection, Evaluation, and Treatment of High Blood Pressure. Hypertension. 2003;42:1206–1252. [DOI] [PubMed] [Google Scholar]
- 7. Vasan RS, Larsen MG, Leip EP, et al. Impact of high‐normal blood pressure on the risk of cardiovascular disease. N Engl J Med. 2001;345:1291–1297. [DOI] [PubMed] [Google Scholar]
- 8. Appel LJ, Moore TJ, Obarzanek E, et al. A clinical trial of the effects of dietary patterns on blood pressure. N Engl J Med. 1997;336:1117–1124. [DOI] [PubMed] [Google Scholar]
- 9. Svetkey LP, Simons‐Morton D, Vollmer WM, et al. Effects of dietary patterns on blood pressure: subgroup analysis of the Dietary Approaches to Stop Hypertension (DASH) randomized clinical trial. Arch Intern Med. 1999;159:285–293. [DOI] [PubMed] [Google Scholar]
- 10. Sacks FM, Svetkey LP, Vollmer WM, et al. Effects on blood pressure of reduced dietary sodium and the Dietary Approaches to Stop Hypertension (DASH) diet. (The DASH‐Sodium Trial). DASH‐Sodium Collaborative Research Group . N Engl J Med. 2001;344:3–10. [DOI] [PubMed] [Google Scholar]
- 11. Vollmer WM, Sacks FM, Ard J, et al. Effects of dietary patterns and sodium intake on blood pressure: subgroup analysis of the DASH‐Sodium trial. Ann Intern Med. 2001;135:1019–1028. [DOI] [PubMed] [Google Scholar]
- 12. Moore TJ, Conlin PR, Ard J, et al. The DASH diet is effective treatment for stage 1 isolated systolic hypertension. Hypertension. 2001;38:155–158. [DOI] [PubMed] [Google Scholar]
- 13. Karanja NM, Obarzanek E, Lin PH, et al. Descriptive characteristics of the dietary patterns used in the Dietary Approaches to Stop Hypertension Trial. DASH Collaborative Research Group . J Am Diet Assoc. 1999;99(suppl):S19–S27. [DOI] [PubMed] [Google Scholar]
- 14. Svetkey LP, Sacks FM, Obarzanek E, et al. The DASH Diet, Sodium Intake and Blood Pressure Trial (DASH‐sodium): rationale and design. DASH‐Sodium Collaborative Research Group . J Am Diet Assoc. 1999;99(suppl):S96–S104. [DOI] [PubMed] [Google Scholar]
- 15. Cherry DK, Burt CW, Woodwell DA. National Ambulatory Care Survey: 1999 Summary. Hyattsville , MD : National Center for Health Statistics; 2001. Advance Data from Vital and Health Statistics No. 322:1–22. [Google Scholar]
- 16. National High Blood Pressure Education Program working Group . National High Blood Pressure Education Program Working Group report on hypertension in the elderly. Hypertension. 1994;23:275–285. [PubMed] [Google Scholar]
- 17. Neaton JD, Wentworth D. Serum cholesterol, blood pressure, cigarette smoking, and death from coronary heart disease: overall findings and differences by age for 316099 white men. Arch Intern Med. 1992;152:56–64. [PubMed] [Google Scholar]
- 18. Conlin PR, Bohannon AD, Miller ER, et al. The DASH diet enhances the blood pressure response to Losartan in hypertensive patients. Am J Hypertens. 2003;16:337–342. [DOI] [PubMed] [Google Scholar]
- 19. Flack JM, Mensah GA, Ferrario CM. Using angiotensin converting enzyme inhibitors in African‐American hypertensives: a new approach to treating hypertension and preventing target‐organ damage. Curr Med Res Opin. 2000;16:66–79. [PubMed] [Google Scholar]


