

Abstract
Is migration from isolated indigenous island communities to Panama City associated with an increase in stress? Individuals were randomly sampled from two Kuna communities: 325 individuals in Panama City and 133 on a Caribbean island. Stress was assessed through the Milcom questionnaire, which explores physical symptoms and symptoms relevant to mood and emotional state, and Cantril's ladder, which examines life satisfaction. Physical symptoms were more common in the urban community (p<0.001), and complaints reflecting mood were also significantly higher on the mainland (p<0.001); the two measures were highly correlated. While systolic and diastolic blood pressure was higher in the mainland community (p<0.001), there was no relation between blood pressure level and any index of stress. Despite unambiguous evidence of an increase in stress in migrants to the city, there was no indication that the stress contributed to the rise in blood pressure level. Migration to an urban setting is associated with an increase in physical symptoms and symptoms reflecting depressed mood, suggesting increased stress level. Life satisfaction is less influenced, possibly providing a measure of the degree of stress.
Since high blood pressure (BP) was first identified as a clinical entity, few candidates as pathogenic contributors have held more interest than “stress.” 1 , 2 , 3 , 4 , 5 , 6 , 7 , 8 Both the general community and the biomedical community use the word stress in a number of ways. In this study, the word stress is applied to a psychosocial situation that provokes a negative emotional and circulatory response. 8
In Kuna Amerinds residing in their indigenous home on Caribbean islands off the coast of Panama, BP does not rise with age and hypertension is extremely uncommon. 9 , 10 This protection from hypertension is environmental rather than genetic, because on migration to Panama City and its environs, BP rises with age and hypertension becomes common. 10
In their essay on BP and migration, Cooper and Rotimi 7 argued that the crucial environmental factor is psychosocial stress while pointing out that this remains an elusive item to measure. As one approach to assessing stress, James and colleagues 11 employed estimates of life satisfaction and emotional state in Samoan participants. As an alternative approach, Way 12 examined stress with migration in Peru by employing the Cornell Medical Index. He documented an increased frequency of reported symptoms in migrants, which paralleled an increase in the number of sick days and the number of days the participants were unable to work. Along with these changes, Way noted a parallel shift in responses to the the psychosocial elements of the Cornell Medical Index, those labeled “emotional.” 12 In this study, we have employed both approaches to assessing stress in Kuna residing in the island community of Ailigandi and 5 years or more after migration to Abayala, a mainland suburb of Panama City.
METHODS
We enrolled 133 Kuna who are long‐term residents of the island of Ailigandi and 325 Kuna volunteers who are long‐term migrants to the Panama City area, where they have lived for at least 5 years. The protocols were reviewed and approved by the “Congresos,” grass‐roots—appointed parliaments in each community. Written informed consent was obtained from each participant. As the first step in the enrollment of a random sample, a census was obtained in each community by a member of the Congreso. Enrollment was by family, and an eligible family contained at least three members who were at least 18 years of age or older. All candidates were tested for blood group, and all participants were O‐group positive, a characteristic of the Kuna. 10 The families resident in each area were randomized for selection.
BP was measured in the nondominant arm with a calibrated battery‐driven oscillometer device (Omron Corporation, Kyoto, Japan). BP was measured three times with the subject in the sitting position after 5 minutes of rest; the mean was used. Height and weight were measured immediately after the BP measurements.
In addition to questionnaires designed to evaluate diet, each participant completed a Milcom Health History Questionnaire (Hollister, Inc., Libertyville, IL) in Spanish, which reviewed 135 symptoms, including 16 that inquire about mental health and emotional status. This instrument is based on the Cornell Medical Index, a validated instrument. 12 They also responded to a questionnaire based on Cantril's Ladder, which is also thoroughly validated. 13 The question addressed by Cantril's ladder is “How satisfactory is your life?” The ladder provides ten rungs. The zero rung at the bottom of the ladder is the worst imaginable quality of life, a quality of life so poor that it cannot be sustained for more than a short time. The tenth rung at the top of the ladder is blissful happiness, a state that rarely lasts for more than a few days. The middle rung on the ladder was described as “the average quality of life in your community” and was not further explained or described. In most communities, the mean, median, and mode response is 5, with Gaussian distribution around the mode. 13
The participants were promised anonymity. Both forms, the Milcom and Cantril, were placed in a sealed envelope for review by an individual who did not know the participant. Literacy in Spanish was essentially universal in participants younger than 40 years of age, but decreased with increasing age. Among the elderly Kuna, some did not employ verbal Spanish effectively. For that reason, a Kuna health employee, fluent in both languages, was available to translate the questions in the questionnaires. Although attempts were made to maintain participant privacy, some of the effects of age may reflect this fact.
Mean values are presented with the SEM as the index of dispersion. Chi‐square was used for evaluation of nonparametric analyses, and analysis of variance was used for comparisons involving multiple variables. Correlation analyses were performed on select indices. A p value of <0.05, after adjustment for multiple comparisons, was used to assess statistical significance.
RESULTS
The samples selected from the two communities did not differ in male/female distribution, age, height, weight, or body mass index (BMI) (Table I). They did differ in systolic and diastolic BP level, both of which were significantly higher in Abayala, the mainland community (p<0.001) (Table I).
Table 1.
Mean Demographic and Blood Pressure (BP) Data
| abayala | ailigandi | |||||
|---|---|---|---|---|---|---|
| Total | Male | Female | Total | Male | Female | |
| Number | 325 | 146 | 179 | 133 | 51 | 82 |
| Age (yr) | 37.2 | 38.1 | 36.4 | 41.1 | 42.1 | 40.4 |
| Height (cm) | 151.2 | 157.6 | 146.1 | 149.9 | 156.2 | 146.0 |
| Weight (kg) | 52.9 | 55.9 | 50.5 | 50.7 | 54.7 | 48.2 |
| Body mass index (kg/m2) | 23.1 | 22.6 | 23.6 | 22.5 | 22.4 | 22.5 |
| Systolic BP (mm Hg) | 107.0±0.98 | 115.0 | 100.5 | 98.7±1.2* | 104.4 | 95.2 |
| Diastolic BP (mm Hg) | 69.1±0.76 | 74.2 | 64.9 | 59.4±0.6* | 61.7 | 57.9 |
| BP data for Total groups are mean ± SEM. *p<0.001 | ||||||
A difference in a number of psychosocial measures was seen.
The total number of complaints in the Milcom questionnaires was significantly larger in the mainland village, Abayala (18.8±0.69) than in the indigenous island community (11.7±0.71; p<0.01) (Table II, Figure 1). This difference reflected both physical complaints and the 16 questions devoted to assessing mood and mental state. In the mainland community, there were 15.2±0.59 physical complaints compared with 9.2±0.63 in the island community (p<0.001). Similarly, responses to the 16 mental state and mood questions were positive significantly more frequently in the mainland community (3.6±0.16) than in the island community (2.5±0.20; p<0.001). This difference did not extend to the questions reflecting frank clinical depression (0.41±0.04 in the mainland; 0.35±0.05 in the island community; p=0.75) (Table II).
Table 2.
Psychosocial Measures: Mean Scores
| Abayala (n=325) | Ailigandi (n=133) | |
|---|---|---|
| Milcom total | 18.8±0.69 | 11.7±0.71* |
| Milcom physical | 15.2±0.60 | 9.2±0.63* |
| Milcom mental | 3.6±0.16 | 2.5±0.19* |
| Milcom depression | 0.41±0.04 | 0.35±0.04 |
| Cantril | 6.4±0.10 | 6.5±0.14 |
| Data are mean ± SEM. *p<0.001 | ||
Figure 1.
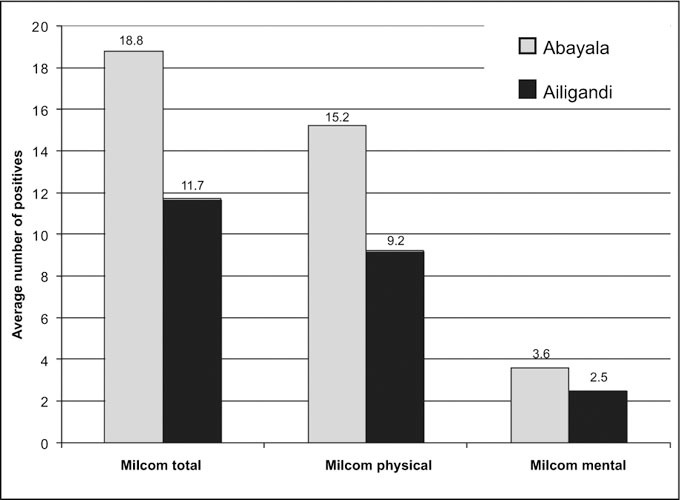
Comparison of the number of positive (symptom present) responses to the 135 questions in the Milcom questionnaire, comparing responses in the suburban village (Abayala) and the indigenous, isolated location (Ailigandi). Differences between the two locations and the total number of positive responses (those reflecting physical symptoms and those involving mental state or mood) were all highly significant (p<0.001).
As one approach to validating these measures, before the study was undertaken we planned a series of internal comparisons. One involved a comparison of the assessment made of physical symptoms on the Milcom questionnaire with those obtained from the 16 questions involving mood and mental state. The correlation between the two was very strong (r=0.97; p<0.001) (Figure 2).
Figure 2.
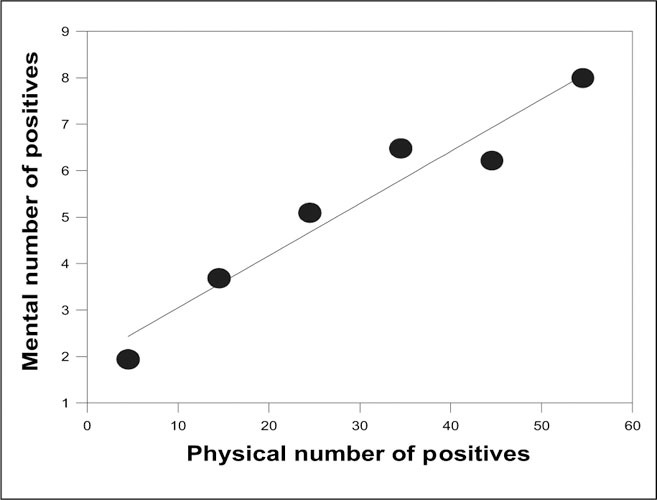
Relation between total number of positive responses to the 119 questions involving physical symptoms and the number of positive responses to the mental or mood questions in the same individual. Because 458 individuals were involved, average values by cohort by decade have been presented. The correlation is highly significant (r=0.97; p<0.001).
Cantril's ladder, designed to assess life satisfaction, also showed a different pattern of response in the two communities (Figure 3). In both communities, the mode was 5, the anticipated mode both from theoretic considerations and from prior experience. 13 The distribution around the mode, however, differed strikingly both from theory and prior experience. There was a highly significant tendency to skew (p<0.001) with only a small number of subjects indicating a Cantril rating below 5. Significantly more of the urban community (45%) indicated a Cantril rating at the level of their community. Only 30% of the indigenous island community residents indicated that their Cantril rating was 5, the mode of the community. Of Cantril ratings above average (6 or higher), there were significantly more indigenous island dwellers than urban participants (p=0.025).
Figure 3.
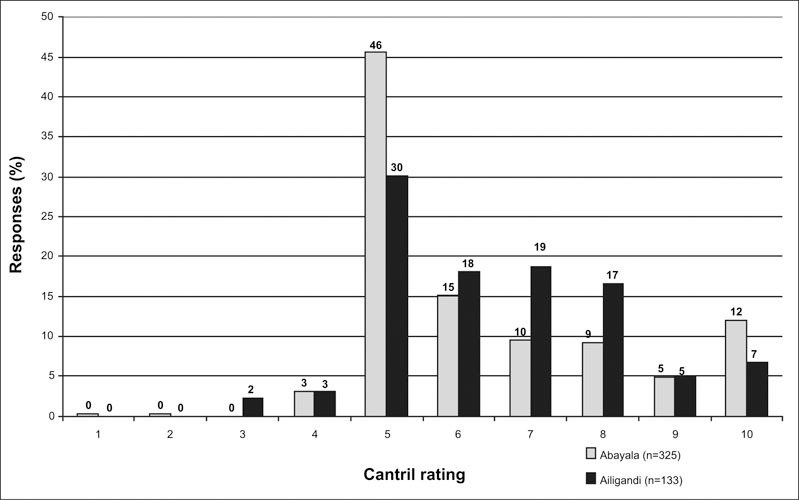
Frequency distribution of responses to the Cantril ladder query in the isolated indigenous village (Ailigandi) and the mainland suburban community (Abayala). Both distributions have the anticipated mode of 5 but are highly skewed, with very few responses below 5 (p<0.01). The two distributions are statistically different (χ2=13.3; p<0.01), with more of the Abayala participants at the mode level 5 and statistically fewer above that level (p<0.001).
In both the mainland and the island communities, those who claimed a Cantril life satisfaction score below 5 (the midpoint) had higher scores (more symptoms) on the Milcom questionnaire (p<0.02); there was no difference between communities. For those with a Cantril score of 5 or higher, the Milcom scores were significantly lower and differed between the two communities systematically. An identical pattern was seen when the 16 Milcom mental health questions were employed. Thus, life satisfaction, when average or above average, did not correlate with either the frequency of physical symptoms or the frequency of symptoms related to mental state or mood.
The most common physical complaints involved concern about weight gain (123 participants), back pain (118 participants), blurry vision (107 participants), and joint or muscle pain (88 participants). The most common complaints in the 16 questions related to mental state were being bothered by criticism (98 participants), a tendency to worry a lot (97 participants), a tendency to be shy (94 participants), difficulty in concentrating (74 participants), and nervousness around strangers (62 participants).
As anticipated, systolic BP in the mainland community (107.0±0.98 mm Hg) was significantly higher than systolic BP in the island community (98.7±1.2 mm Hg; p<0.001). In 22.2% of the mainland participants (72/325) systolic BP exceeded 120 mm Hg, compared with only 6.8% of the island community (9 of 133; p=0.007) (Figure 4). All of the 16 participants with a systolic BP exceeding 140 mm Hg lived in the mainland community. There were, in addition, 56 individuals in that community in whom BP ranged from 120 to 140 mm Hg, currently labeled as prehypertension. 14 Of great interest is the fact that none of the indices employed (Milcom total, Milcom mental, Milcom physical, or Cantril) showed a significant relation to BP level (Table III).
Figure 4.
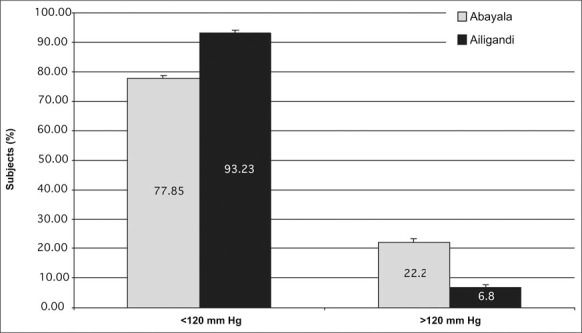
Systolic blood pressure (SBP) distributions in Ailigandi and Abayala. Many more inhabitants of suburban, mainland Abayala bad an SBP >120 mm Hg (22.2%) than in isolated, indigenous Ailigandi (6.8%; p<0.001). All 16 participants with SBP >140 mm Hg (not shown) resided in Abayala.
Table 3.
Psychosocial Scores and Systolic Blood Pressure (SBP) in the Abayala by SBP Group
| SBP Group Scores | All Subjects | Female | Male |
|---|---|---|---|
| ≥ 140 mm Hg (n=16)* | |||
| Milcom total | 17.50 | 19.33 | 16.40 |
| Milcom mental | 2.38 | 2.17 | 2.50 |
| Milcom physical | 15.13 | 17.17 | 13.90 |
| Milcom depression | 0.38 | 0.17 | 0.50 |
| Cantril | 6.38 | 6.17 | 6.50 |
| Mean SBP (mm Hg) | 154.25 | 150.67 | 156.40 |
| ≥120 to <140 mm Hg (n=56)** | |||
| Milcom total | 15.04 | 19.54 | 13.67 |
| Milcom mental | 2.64 | 2.77 | 2.60 |
| Milcom physical | 12.39 | 16.77 | 11.07 |
| Milcom depression | 0.32 | 0.23 | 0.35 |
| Cantril | 6.79 | 6.46 | 6.88 |
| Mean SBP (mm Hg) | 125.11 | 126.15 | 124.79 |
| <120 mm Hg (n=253)† | |||
| Milcom total | 19.68 | 21.39 | 16.75 |
| Milcom mental | 3.87 | 4.30 | 3.14 |
| Milcom physical | 15.81 | 17.09 | 13.61 |
| Milcom depression | 0.43 | 0.41 | 0.47 |
| Cantril | 6.27 | 6.21 | 6.37 |
| Mean SBP (mm Hg) | 100.1 | 96.51 | 106.03 |
| *SEM, ±2.545; **SEM, ±0.646; †SEM, ±0.705 | |||
A systematic difference independent of BP was found in male and female participants. In general, the female participants had significantly more total symptoms than did the males, reflecting primarily physical symptoms (Table II). The difference was less striking in the complaints about mood and mental state and in the frequency of depression. More men than women complained of depression, although that did not reach statistical significance. Age had a small but statistically significant influence on a number of variables in this study. Systolic BP rose with age to a modest degree (SBP=99.2+0.251 age; r=0.29; p<0.001) in Abayala but did not vary significantly with age in Ailigandi. Age also influenced BMI in Abayala, again to a minor degree (BMI=21.13+0.0573 age; r=0.225; p<0.001). Again, BMI was not related to age in the island community. Age also influenced the total Milcom score in the mainland community (Milcom total=10.8+0.214 age; r=0.26; p<0.001), reflecting primarily physical symptoms (physical symptom total=4.63+0.217 age; r=0.35; p<0.001). Again, these relationships were not evident in the island community, Ailigandi.
DISCUSSION
By the most robust index available, physical and mental symptoms obtained from the Milcom questionnaire, life was more stressful in the Panama City suburb than in the indigenous island community. In a similar study performed on migrants in Peru, there was an increase in the number of complaints involving psychosocial elements that was paralleled by an increase in the total number of symptoms and a number of objective measures including the number of sick days and the number of days in which migrant participants were unable to work because of feeling unwell. 12 This study provides a strong confirmation that life in an urban environment is associated with an increase in reported symptoms. The strong correlation between physical symptoms and symptoms associated with mood and emotional state provides internal evidence that at least in part, the increased symptoms reflected increased stress, as suggested earlier. 12 The stress was not associated with depression. The correlation between stress assessed by symptom frequency and stress associated with life satisfaction was complex and less striking. The striking difference in physical and mood symptoms between the communities was not paralleled by an overall difference in life satisfaction, although the two communities did differ in the pattern.
In a detailed analysis, James et al. 11 addressed these issues in western Samoa. Acculturation, assessed as degree of participation in a Western lifestyle, correlated with psychosocial parameters including estimates of life satisfaction and emotional stability, along with a validating measurement, catecholamine excretion. In Samoa, relating the psychosocial factors to BP rise was complicated by the complexity of Samoans' acculturation, which included not only a major shift in diet, but also large increases in body weight and adiposity and very large increases in salt intake. 15 In the Kuna, there are important shifts in diet 16 but no increase in body weight or adiposity and no change in salt intake. 10 There are important cultural factors: virtually no Samoans reported feeling anxious, for example 15 ; in contrast, anxiety was a common feature in the positive responses to the mental questions in the Kuna both in the island community and the Panama City suburb, if one accepts a complaint about tending to worry a lot as a sign of anxiety. In some models, both anxiety and depression are considered to be stress‐related disorders. 17 Despite decades of investigation, no clear pattern has emerged relating BP change on migration to either stress levels or to emotional state, including anxiety, depression, or anger. 18 The instruments employed to address stress level in this study were selected for several reasons. Both instruments had been validated in similar populations. 12 , 13 Both instruments provided an index of our primary objective, stress level. Both have been very widely used, and both are easy to administer and to score. The Milcom questionnaire is commercially available and derived from the Cornell Medical Index. Cantril has published a book 13 providing great detail on his instrument.
How shall the data be interpreted? On the one hand, both BP level and stress level were increased in the mainland community compared with the island community. Studies on sodium intake, for example, are interpreted as supporting a role for salt in the pathogenesis of a BP rise when community averages of salt intake and BP are correlated, even though that correlation never extends to individuals. Our interpretation is that the failure of BP level to reflect stress level argues against a role for stress in the genesis of the BP rise.
Cantril anticipated that his index would provide a description in which the mean, median, and mode response would be 5 with a symmetrical, Gaussian distribution around 5. He found this pattern in more than 20 communities around the world. 13 There were two exceptions: in the United States and in communal farms (kibbutzim) in Israel, the pattern differed strikingly. The median and mean lay between 6 and 7, well above the anticipated level of 5, and the outcome was bimodal with one mode at 5 and a second‐layer mode substantially higher. An intermediate pattern was identified in the present study, both in Kuna dwelling in the indigenous island situation and in a Panama City suburb. The mode lay at the anticipated level of 5, but the findings thereafter were extremely skewed. Very few believed that their quality of life was below average, and the majority considered their life better than the average in their community—echoing Garrison Kiellor's reports from Lake Wobegon, where all the children are “above average.” This seems to apply to the issue of quality of life in select communities. The complexity of responses to Cantril's ladder may have reduced its efficiency in identifying and quantifying stress. Conversely, it is possible, at least within a range, that one can feel stress and yet feel excellent life satisfaction. It is common experience that one person's source of stress represents another person's exhilarating challenge.
CONCLUSIONS
Although stress remains an elusive quality to measure, the use of judiciously selected quality‐of‐life scales, along with instruments designed to examine emotional status and physical symptoms, can provide a useful index for assessing the contribution of these factors to the BP rise that occurs with migration. Our hypothesis is that diet plays the major role in the BP rise, perhaps via the effect of flavanoid‐rich cocoa on nitric oxide synthesis, 16 , 19 but that stress acts as an amplifier in selected individuals. A successful study will have to be designed to make it possible to assess these factors and their interaction.
Hypertension is a complex process in which a genetic component, representing 30%–50% of the total pathogenesis of hypertension, is acted on by environmental factors to lead to a sustained increase in BP. Environmental factors include two major categories: those relating to what we eat and drink and those relating to what is broadly described as “stress,” a psychosocial situation that provokes a negative emotional and circulatory response. In this population study, BP increases were not correlated with the increases in measures of stress. While we know a great deal about factors that change BP, we know substantially less about the pathogenesis of essential hypertension. Migrants can provide a useful approach to assessing these factors.
Acknowledgments and disclosure: We are grateful for the support of Onesimo Perez, Gladys Morris, Cbarlene Malarick, RN, BS, Caroline Coletti, BS, MS, Meghan Hughes, BS, and Diana Capone for their assistance in various aspects of this study. This work was supported in part by the National Institutes of Health (grants NCRR GCRC M01RR02635, Hypertension SCOR 5P0HL55000, Hypertension Training T32HL07609, and 1R01DK5466804), as well as M&M/Mars, Inc. of Hackettstown, NJ.
References
- 1. Henry JP, Liu J, Meehan WP. Psychosocial stress and experimental hypertension. In: Laragh JH, Brenner BM, eds.. Hypertension: Pathophysiology, Diagnosis, and Management. Vol 1. 2nd ed.. New York, NY: Raven Press; 1995:905–921. [Google Scholar]
- 2. Harburg E, Erfurt JC, Chape C, et al. Socioecological stressor areas and black‐white blood pressure. J Chronic Dis. 1973;26:595–611. [DOI] [PubMed] [Google Scholar]
- 3. Dressier WW. Social support, lifestyle incongruity, and arterial blood pressure in a southern black community. Psychosom Med. 1991;53:608–620. [DOI] [PubMed] [Google Scholar]
- 4. Hollenberg NK, Williams GH, Adams DF. Essential hypertension: abnormal renal vascular and endocrine responses to a mild psychological stimulus. Hypertension. 1981;3:11–17. [DOI] [PubMed] [Google Scholar]
- 5. Pickering TG, Devereux RB, James GD, et al. Environmental influences on blood pressure and the role of job strain. J Hypertens Suppl. 1996;14:S179–S186. [PubMed] [Google Scholar]
- 6. Timio M. Blood pressure trend and psychosocial factors: the case of the nuns in a secluded order. Acta Physiol Scand Suppl. 1997;640:137–139. [PubMed] [Google Scholar]
- 7. Cooper R, Rotimi C. Hypertension in populations of West African origin: is there a genetic predisposition? J Hypertens. 1994;12:215–227. [PubMed] [Google Scholar]
- 8. Hollenberg NK. Stress and blood pressure. In: Izzo JL Jr, Black HR, eds.. Hypertension Primer: The Essentials of High Blood Pressure. 3rd ed. Philadelphia, PA: Lippincott, Williams & Wilkins; 2003. [Google Scholar]
- 9. Kean BH. The BP of the Kuna Indians. J Trop Med Hyg. 1944;24:341–343. [Google Scholar]
- 10. Hollenberg NK, Martinez G, McCullough M, et al. Aging, acculturation, salt intake and hypertension in the Kuna of Panama. Hypertension. 1997;29:171–176. [DOI] [PubMed] [Google Scholar]
- 11. James GD, Baker PT, Jenner DA, et al. Variation in lifestyle characteristics and catecholamine excretion rates among young western Samoan men. Soc Set Med. 1987;25:981–986. [DOI] [PubMed] [Google Scholar]
- 12. Way AB. Health, Exercise Capacity and Effective Fertility Aspects of Migration to Sea Level by High‐Altitude Peruvian Quechua Indians [dissertation], Madison, WI: University of Wisconsin Press; 1972. [Google Scholar]
- 13. Cantril H. The Pattern of Human Concerns. New Brunswick, NJ: Rutgers University Press; 1965. [Google Scholar]
- 14. Seventh report of the Joint National Committee on Prevention, Detection, Evaluation, and Treatment of High Blood Pressure. Hypertension. 2003;42:1206–1273. [DOI] [PubMed] [Google Scholar]
- 15. Baker PT, Hanna JM, Baker TS, eds.. The Changing Samoans: Behavior and Health in Transition. New York, NY: Oxford University Press; 1986. [Google Scholar]
- 16. Chevaux KA, Jackson L, Villar ME, et al. Proximate, mineral, and procyanidin content of certain foods and beverages consumed by the Kuna Amerinds of Panama. J Food Compost Anal. 2001;14:553–563. [Google Scholar]
- 17. Holmes A, Griebel G, Heilig M, et al. Neuropeptides and stress‐related disorders‐multiple targets and converging concepts [author reply]. Trends Pharmacol Sci. 2004;25:242–243. [Google Scholar]
- 18. James JG, Baker BT. Human population biology and blood pressure: evolutionary and ecological considerations and interpretations of population studies. In: Laragh JH, Brenner BM, eds.. Hypertension: Pathophysiology, Diagnosis, and Management. 2nd ed.. New York, NY: Raven Press; 1995:115–126. [Google Scholar]
- 19. Fisher ND, Hughes M, Gerhard‐Herman M, et al. Flavanol‐rich cocoa induces nitric‐oxide‐dependent vasodilation in healthy humans. J Hypertens. 2003;21:2281–2286. [DOI] [PubMed] [Google Scholar]