

Abstract
The objective of this study was to determine the relationship of C‐reactive protein (CRP) and blood pressure (BP) across the range of BP categories including prehypertension. The Third National Health and Nutrition Examination Survey (NHANES III) data collected from 1988 to 1994 were analyzed. In unadjusted analyses, there was a step‐wise increase in the probability of elevated CRP across a wide range of BP categories. Prehypertensive participants had a higher prevalence of elevated CRP than normotensive people (27.4% vs. 19.8%; p<05). After adjustment for age, gender, race, smoking, body mass index, exercise, diabetes, and medication usage, participants with systolic BP 120–139 mm Hg or diastolic BP 80–89 mm Hg were more likely to have elevated CRP than people with systolic BP <120 (odds ratio, 1.36; 95% confidence interval, 1.14–1.62; odds ratio, 1.20; 95% confidence interval, 1.02–1.41, respectively). CRP and BP are positively related across a wide range of BP categories. A substantial proportion of prehypertensive individuals have elevated CRP independent of multiple confounders.
Elevated blood pressure (BP) is a prevalent independent risk factor for cardiovascular disease. Over 50 million US adults, or approximately 29%, have hypertension, defined as a BP ≥140/90. 1 Recently, discussion in The Seventh Report of the Joint National Committee on Prevention, Detection, Evaluation, and Treatment of High Blood Pressure (JNC 7) 2 has begun to focus on a new and more rigorous classification of elevated BP by defining individuals formerly not considered as hypertensive with a systolic BP (SBP) of 120–139 or diastolic BP (DBP) of 80–89 mm Hg as having “prehypertension.” Although it is unclear what level of cardiovascular risk is associated with prehypertension, evidence suggests that people with BP in the prehypertensive range may be at increased cardiovascular risk because they are twice as likely to develop hypertension as people with normal BP (<120/80 mm Hg). 3 Some studies indicate a relationship between BP in the mild or prehypertension range and dyslipidemia and insulin resistance to a greater extent than their normotensive counterparts. 4
Although the mechanisms underlying the development of cardiovascular disease in people with hypertension are still not completely understood, an accumulating body of evidence suggests that inflammation may play an important intermediary role. This is particularly important because elevated levels of inflammatory markers such as C‐reactive protein (CRP) independently predict increased cardiovascular risk. 5 , 6 , 7 , 8 Elevated levels of CRP have been linked to several atherogenic conditions, including hyperglycemia, insulin resistance, and overt diabetes. 9 , 10 , 11 , 12 , 13
Recent studies have begun to illuminate the nature of the relationship between CRP and BP. In the Helsinki Heart Study, 14 the combination of SBP ≥150 mm Hg and CRP >2.7 mg/L was found to be additive for the risk of myocardial infarction and coronary death (odds ratio [OR], 4.73; 95% CI, 2.43–9.21 compared with elevated SBP alone; OR, 1.56; 95% CI, 0.95–2.55 for elevated CRP alone). A recent study of 8347 Korean subjects demonstrated an increased prevalence of hypertension associated with each increased quartile of CRP. 15 Sesso and colleagues 16 have shown that increased CRP levels in women with normal BP or prehypertension are associated with increased risk of developing hypertension later. However, none of these studies have examined the relationship between BP, particularly prehypertension, and CRP in a large and demographically diverse US population.
To evaluate the association between CRP and BP, we analyzed data from the Third National Health and Nutrition Examination Survey 1988–1994 (NHANES III). This database has several advantages, including information about demographic and anthropometric variables, as well as information about many cardiovascular risk factors, which allowed us to control for several confounders. The primary aim of the study was to examine the relationship between BP and elevation of CRP and to determine whether people with “prehypertension” were more likely to have elevated CRP compared with people with normal BP, i.e., <120/80 mm Hg.
METHODS
The focus of this study was an analysis of the adults ≥17 years of age who participated in NHANES III, a national public‐use dataset collected between 1988 and 1994. The Medical University of South Carolina Institutional Review Board issued an exemption for the analysis. Our analyses focused on adults without a diagnosis of hypertension, as defined by a negative response to the question, “Have you ever been told by a doctor that you had hypertension, also called high blood pressure?” This was done to enable us to evaluate the relationship between CRP and BP in a population whose BP would be less likely to be modified by treatment with medication or lifestyle changes. The NHANES III collected multistage, stratified, clustered samples from the civilian, noninstitutionalized population. The National Center for Health Statistics (NCHS) administered the survey to a randomly selected group of approximately 40,000 residents in 89 communities across the United States. The interviews were conducted in English and Spanish by highly trained field staff who were continuously retrained throughout the 6‐year period to ensure that the appropriate standards were maintained. Most (86%; n=33,994) of the surveyed residents were interviewed in their homes, and all of them were invited to examination centers for additional data collection including physical examination and laboratory measures. Seventy‐nine percent (n=31,311) of those surveyed completed all or some of the physical exam and laboratory data collection. Detailed information on the plan and operation of the NHANES III has been previously published. During the 6 years of NHANES III data collection, 20,050 adults completed the household survey.
To examine the relationship between CRP and BP, three of the five NHANES III data files were selected for analysis: the household adult data file, examination data file, and laboratory data file. We excluded any adult who did not participate in all three parts of the survey: interview, exam, and laboratory. Of those who filled out an adult household survey, 98.5% (n=19,760) also completed the laboratory tests and physical exam. CRP levels were recorded for 16,966 adults, and 12,498 of them had not been diagnosed with hypertension.
Study Measures
Blood Pressure. Three sets of BP measurements were obtained using a mercury sphygmomanometer during the physical exam. The reported SBP and DBP pressures (mm Hg) are the average of these three measurements. Three levels of BP status were established independently for SBP and DBP measurements: non‐hypertensive (SBP <120 mm Hg, DBP <80 mm Hg), prehypertensive (SBP 120–139 mm Hg, DBP 80–89 mm Hg), and hypertensive (SBP ≥140 mm Hg, DBP ≥90 mm Hg). We used these divisions because we were most interested in characteristics of participants in the prehypertension range, as newly established by the JNC 7 guidelines. 2 We also used SBP as a continuous variable in some further analyses.
CRP. Standard phlebotomy techniques were used to obtain specimens. Serum specimens were frozen to ‐20°C until being analyzed later. CRP was measured using a Behring Nephelometer Analyzer System (Behring Diagnostics Inc., Somerville, NJ). Elevated levels of CRP were defined using guidelines recently published by the American Heart Association 5 that designated high risk at CRP levels >3.0 mg/L.
Control Variables
Age, gender, race, smoking status, body mass index (BMI), diabetes status, medications (nonsteroidal anti‐inflammatory medications and cholesterol‐lowering medications), and physical activity were included in the analysis as control variables due to their known association with CRP. 13 , 17 , 18 , 19 , 20 , 21 Race included four categories: non‐Hispanic White, non‐Hispanic Black, Hispanic, and other. BMI was computed on the basis of weight in kilograms divided by the height in meters squared. Smoking status was determined by self‐report as to whether the respondent was a current smoker. Diabetics were identified from the response to the question “Has a doctor ever told you that you have diabetes?” In addition we included undiagnosed diabetics who were identified by having a fasting plasma glucose level >126 mg/dL. For determination of physical activity, each respondent was asked whether they participated in physical exercise activity and how often they participated during the past month. Respondents were stratified into three frequency groups: none, 1–12 times per month, and >12 times per month. Participants who were taking aspirin, over‐the‐counter nonsteroidal anti‐inflammatory medications, prescription nonsteroidal anti‐inflammatory medications, or cholesterol‐lowering medications were counted as “yes” for medication use, and others “no.”
DATA ANALYSIS
Descriptive data and US adult population estimates were compiled using data from the NHANES III. Weighting variables and a jackknife design were used in SUDAAN, a specialized statistical program (Research Triangle Institute, Cary, NC), to account for the complex sampling design of the NHANES III, which over‐sampled minority, low‐income, and elderly households. We focused on people in the sample without a diagnosis of hypertension to evaluate the relationship between CRP and BP in a naïve population that would not have been likely to have BP altered by treatment. We examined the relationship between BP and CRP in individuals without a diagnosis of hypertension by comparing the percent of people with elevated CRP by SBP group in 10 mm Hg increments (<120, 120–129, 130–139, 140–149, 150–159, ≥160 mm Hg). We examined DBP in similar fashion (DBP <80, 80–89, ≥90 mm Hg).
We used multivariate logistic regression models to evaluate the relationship between BP (particularly prehypertension) and elevated CRP, with adjustments for possible confounders. The initial models were defined with the outcome (dependent) variable of elevated CRP and the independent variable of SBP group with three levels: normal BP, prehypertension, and hypertension (<120, 120–139, ≥140 mm Hg). These levels match the BP levels in JNC 7. 2 Control variables included age, race, gender, smoking, BMI, diabetes status, medication use, and exercise activity. In further analyses, we used SBP as a continuous variable in the regression model instead of using JNC 7 categories. We examined DBP in the same fashion using JNC 7 categories (<80, 80–89, and ≥90 mm Hg) in a separate analysis. To determine whether the relationship between BP and CRP was altered by race, we conducted the same analyses above for each race (white, African American, Hispanic) separately, controlling for the same factors as previously.
Standardized β, p values, ORs, and 95% confidence intervals were obtained from the logistic regression output. Statistical significance was defined as p≤0.05 without correction for multiple‐comparisons, since there are relatively few factors and the specific analyses were planned in advance. 22
RESULTS
Demographic and descriptive data of the sample are shown in Table I. Among people without a previous diagnosis of hypertension, 23.5% had CRP >3.0 mg/L and 30.3% had prehypertension.
Table I.
Demographic and Descriptive Characteristics of the US Population Without a Previous Diagnosis of Hypertension From NHANES III*
| Prehypertensive | |||
|---|---|---|---|
| Nonhypertensive (<120/80 mm Hg) | (120–139 mm Hg SBP or 80–89 mm Hg DBP) | Undiagnosed Hypertensive (>140/90 mm Hg) | |
| Total | 62.3 | 30.3 | 7.3 |
| Age | |||
| 17–44 | 81.5 | 54.1 | 12.3 |
| 45–65 | 15.9 | 31.8 | 37.1 |
| ≥66 | 2.6 | 14.2 | 50.6 |
| Race | |||
| White | 73.9 | 76.4 | 78.2 |
| Black | 10.4 | 10.9 | 10.6 |
| Hispanic | 11.3 | 8.9 | 7.0 |
| Other | 4.4 | 3.9 | 4.2 |
| Male | 40.0 | 66.0 | 51.3 |
| Current smoker | 32.2 | 30.0 | 25.4 |
| BMI ≥30 | 12.2 | 23.8 | 23.3 |
| Diabetic | 4.3 | 7.6 | 12.5 |
| Using medication | 10.9 | 15.1 | 21.6 |
| Exercise group | |||
| None | 12.1 | 13.3 | 20.1 |
| 1–12 ×/mo | 31.6 | 29.0 | 28.2 |
| >12 ×/mo | 56.3 | 57.7 | 51.7 |
| Elevated CRP (>3.0 mg/L) | 19.8 | 27.4 | 36.3 |
| NHANES III=Third National Health and Nutrition Examination Survey; SBP=systolic blood pressure; DBP=diastoic blood pressure; BMI=body mass index; CRP=C‐reactive protein; *all numbers are expressed in percent | |||
US population estimates from NHANES III for the rates of elevated CRP (±SE) by SBP group in persons without a diagnosis of hypertension are illustrated in Figure 1. In unadjusted analyses, people with SBP in the prehypertensive (27.4%) or hypertensive range (36.3%) had a significantly (p<0.05) higher prevalence of elevated CRP than people with SBP <120 mm Hg (19.3%). There was a greater prevalence of elevated CRP with each 10 mm increase of SBP from <120 to 120–129 and to 130–139 mm Hg. Similarly, people with DBP in the prehypertensive (26.4%) or hypertensive (25.0%) group had a higher prevalence of elevated CRP than people with normal BP (22.6%, p=0.017).
Figure 1.
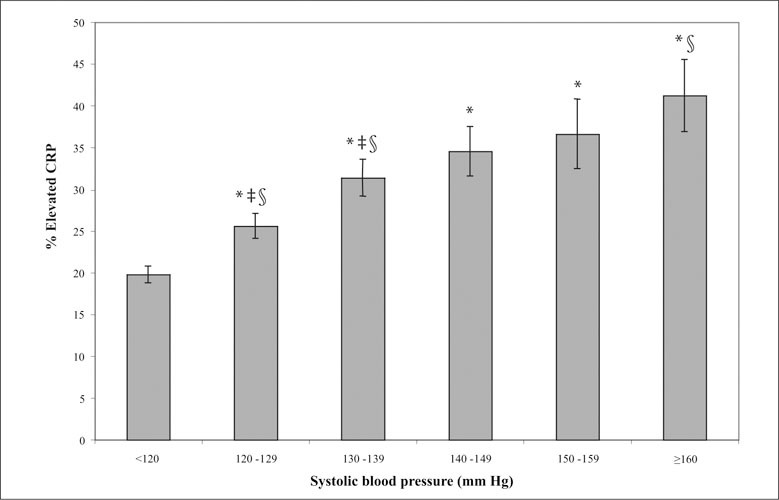
US population estimates from the Third National Health and Nutrition Examination Survey (NHANES III) for the rates of elevated C‐reactive protein (CRP) ± standard error (SE) by systolic blood pressure (SBP) group in persons without a diagnosis of hypertension. *Nonhypertensive people (SBP <120) have a significantly (p<0.05) lower rate of elevated CRP than prehypertensive or hypertensive people; ‡each of the two prehypertension categories has significantly greater rates of elevated CRP than the preceding categories; §people with stage 2 hypertension (SBP ≥160) have a significantly greater rate of elevated CRP than people with prehypertension.
The results of the multivariate models for clinically elevated CRP levels among people without previously diagnosed hypertension are presented in Table II. The multivariate model was adjusted for age, gender, race, smoking, BMI, exercise activity, medication use, and diabetes status. Participants who had SBP between 120–139 or ≥140 mm Hg had significantly higher odds of having elevated CRP than people with SBP <120. For DBP, only DBP 80–89 mm Hg was independently associated with higher likelihood of elevated CRP (OR, 1.20; 95% CI, 1.02–1.41). The association between higher SBP and greater likelihood of elevated CRP was maintained when we examined the relationship in multivariate regression models using BP as a continuous variable (p<0.05). When we examined the same relationships by race, we found the association between SBP and CRP was maintained in whites, but not in African Americans or Hispanics. There were no significant trends in DBP and CRP by race.
Table II.
Logistic Regression Analyses Among NHANES III Persons Without a Diagnosis of Hypertension, Odds Ratio (OR) and 95% Confidence Interval (95% CI) of Having Elevated CRP (≥3.0 mg/L)
| Wall People* | Whites | Blacks | Hispanics | |||||
|---|---|---|---|---|---|---|---|---|
| Variable | OR† | 95% CI | OR† | 95% CI | OR† | 95% CI | OR† | 95% CI |
| Age | ||||||||
| 17–44 | 1 | 1 | 1 | 1 | 1 | 1 | 1 | 1 |
| 45–65 | 1.49 | 1.25–1.77 | 1.55 | 1.26–1.92 | 1.63 | 1.21–2.19 | 0.94 | 0.62–1.44 |
| ≥66 | 1.92 | 1.39–2.64 | 2.07 | 1.44–2.98 | 1.81 | 1.35–2.43 | 0.64 | 0.37–1.11 |
| Gender | ||||||||
| Male | 1 | 1 | 1 | 1 | 1 | 1 | 1 | 1 |
| Female | 1.98 | 1.72–2.27 | 1.93 | 1.61–2.30 | 1.76 | 1.39–2.23 | 2.61 | 1.77–3.84 |
| Smoker | ||||||||
| Yes | 1.48 | 1.21–1.79 | 1.46 | 1.15–1.84 | 1.79 | 1.48–2.17 | 1.07 | 0.67–1.71 |
| No | 1 | 1 | 1 | 1 | 1 | 1 | 1 | 1 |
| BMI | ||||||||
| <30 | 1 | 1 | 1 | 1 | 1 | 1 | 1 | 1 |
| ≥30 | 3.15 | 2.69–3.70 | 3.06 | 2.48–3.77 | 4.07 | 3.39–4.88 | 3.14 | 2.24–4.41 |
| Exercise | ||||||||
| None | 1 | 1 | 1 | 1 | 1 | 1 | 1 | 1 |
| 1–12 ×/mo | 0.94 | 0.76–1.56 | 0.87 | 0.65–1.16 | 1.17 | 0.87–1.55 | 1.00 | 0.63–1.57 |
| >12 ×/mo | 0.75 | 0.61–0.92 | 0.70 | 0.53–0.93 | 0.92 | 0.70–1.21 | 0.76 | 0.47–1.23 |
| Diabetic | ||||||||
| Yes | 1.98 | 1.54–2.56 | 1.90 | 1.40–2.59 | 1.76 | 1.23–2.53 | 3.49 | 1.90–6.41 |
| No | 1 | 1 | 1 | 1 | 1 | 1 | 1 | 1 |
| Using medication | ||||||||
| Yes | 1.10 | 0.91–1.34 | 1.13 | 0.89–1.42 | 0.96 | 0.61–1.51 | 1.05 | 0.64–1.71 |
| No | 1 | 1 | 1 | 1 | 1 | 1 | 1 | 1 |
| SBP | ||||||||
| <120 | 1 | 1 | 1 | 1 | 1 | 1 | 1 | 1 |
| 120–139 | 1.36† | 1.14–1.62† | 1.32† | 1.09–1.60† | 1.18 | 0.93–1.48 | 1.61 | 0.90–2.88 |
| ≥140 | 1.54† | 1.18–2.01† | 1.51† | 1.08–2.10† | 1.37 | 0.90–2.07 | 1.38 | 0.73–2.59 |
| NHANES III=Third National Health and Nutrition Examination Survey; CRP=C‐reactive protein; BMI=body mass index; SBP=systolic blood pressure; *controlled for race in this category; †odds ratio, p<0.05 | ||||||||
DISCUSSION
The relationship between BP and elevated CRP appears graded and continuous in this representative sample of the US population. Of particular interest, individuals with prehypertension were significantly more likely to have elevated CRP than people with normal BP. The relationship between prehypertension and elevated CRP persisted after controlling for numerous confounders including age, gender, race, smoking, BMI, waist circumference, exercise activity, medication use, and diabetes.
These results suggest that elevated CRP may explain some of the risk associated with BP readings in the prehypertensive range. In this regard, we note that the relationship between prehypertension and CRP was most evident with SBP and not DBP. Previous epidemiological studies have indicated a stronger relationship of SBP than DBP to cardiovascular events and mortality. 23 , 24 , 25 Although speculative, our study results provide another potential contributor to the stronger relationship of SBP than DBP to cardiovascular events, namely, elevated CRP.
These findings provide further evidence for the newly designated category of prehypertension by the JNC 7, which identifies a group of people who may be at greater cardiovascular risk than previously appreciated due to elevated CRP levels. The link between prehypertension and elevated CRP lends support to the JNC 7 recommendations to target such individuals for lifestyle interventions. Weight loss, for example, is effective in reducing CRP and other inflammatory biomarkers in obese patients as well as BP and other features of the metabolic syndrome. 26 Further, due to the increased risks when both elevated SBP and elevated CRP are present, 14 our findings may provide a rationale for pharmacotherapy in a broader subset of people with prehypertension
Our findings also add to the growing body of research establishing CRP as the primary marker of cardiovascular inflammation. CRP plays a prominent role in the inflammatory response and has become well established as an independent risk factor for cardiovascular events. 5 , 8 , 9 , 27 , 28 Epidemiological data document the association between elevation of CRP levels and a variety of cardiovascular risk factors and the metabolic syndrome, including diabetes, 11 , 12 obesity, 20 hyperlipdemia, 9 hyperglycemia, 13 and physical inactivity. 19 Our current finding of elevated CRP with increasing levels of BP in a large nationally representative population documents that people with prehypertension are more likely to have elevated CRP, and raises the question of whether people with both risk factors may be at increased risk for subsequent cardiovascular disease. Sesso and colleagues 16 have shown that elevated CRP is associated with an increased risk of developing hypertension in a cohort study, including people with baseline BP in the prehypertension range. Possible mechanisms for this association are in the process of being elucidated and include oxidative stress 29 , 30 and interactions with adhesion molecules, plasminogen activator inhibitor‐1, and low‐density lipoprotein cholesterol uptake. 31 , 32 , 33
The strengths of this study are that the data were derived from a nationally representative sample. The relationship between CRP and BP, including values in the prehypertensive range, were independent of several confounders, including BMI, smoking, diabetes, and physical activity. The limitations of the study include that people may be miscategorized according to the diagnosis of hypertension, since self‐report was used. Also, although three BP readings were obtained for each participant, BP readings were done only on one occasion, rather than the multiple repeat measures recommended for confirmation of the diagnosis of hypertension. For the purposes of our report, only individuals who had never been told by a physician that they had hypertension were included to minimize the confounding influence of lifestyle change and pharmacotherapy. Another potential limitation is that CRP was analyzed using a categorical method comparing high to low levels, rather than using CRP as continuous. However, the American Heart Association guidelines that define high risk coincide with the level used in our study. 5
In conclusion, our study shows an independent association between BP and elevation of CRP in people without a diagnosis of hypertension. Individuals with prehypertension had a significantly greater likelihood of CRP elevation than people with normal BP. The relationship between CRP and prehypertension was most evident with SBP. The association between prehypertension and CRP seen in the overall population was demonstrated in whites but not confirmed in African Americans or Hispanics. Further research is needed to better understand the association between BP and CRP, and the consequences for future cardiovascular risk of CRP elevation in people with prehypertension.
Disclosure: Supported in part by grant 1D12HP00023–01 from the Health Resources and Services Administration, by an Advanced Research Training grant from the American Academy of family Physicians, and by NIH grants HL 58794, HL 04290, P01 HS1087 from the Agency for Healthcare Research and Quality (AHRQ), and P60 MD00267 (NIH).
References
- 1. Hajjar I, Kotchen TA. Trends in prevalence, awareness, treatment, and control of hypertension in the United States, 1988–2000. JAMA. 2003;290(2):199 – 206. [DOI] [PubMed] [Google Scholar]
- 2. Chobanian AV, Bakris GL, Black HR, et al., and the National High Blood Pressure Education Program Coordinating Committee. The Seventh Report of the Joint National Committee on the Prevention, Detection, Evaluation, and Treatment of High Blood Pressure. JAMA. 2003;289(19):2560 – 2572. [DOI] [PubMed] [Google Scholar]
- 3. Vasan RS, Larson MG, Leip EP, et al. Assessment of frequency of progression to hypertension in non‐hypertensive participants in the Framingham Heart Study. Lancet. 2001;358(9294):1682 – 1686. [DOI] [PubMed] [Google Scholar]
- 4. Kim JI, Tsujino T, Fujioka Y, et al. Bezafibrate improves hypertension and insulin sensitivity in humans. Hypertens Res. 2003;26(4):307 – 313. [DOI] [PubMed] [Google Scholar]
- 5. Pearson TA, Mensah GA, Alexander RW, et al. Markers of inflammation and cardiovascular disease: application to clinical and public health practice. A statement for healthcare professionals from the Centers for Disease Control and Prevention and the American Heart Association. Circulation. 2003;107(3):499 – 511. [DOI] [PubMed] [Google Scholar]
- 6. Ridker PM, Glynn RJ, Hennekens CH. C‐reactive protein adds to the predictive value of total and HDL cholesterol in determining risk of first myocardial infarction. Circulation. 1998;97(20):2007 – 2011. [DOI] [PubMed] [Google Scholar]
- 7. Ridker PM, Stampfer MJ, Rifai N. Novel risk factors for systemic atherosclerosis. JAMA. 2001;285(19):2481 – 2485. [DOI] [PubMed] [Google Scholar]
- 8. Ridker PM, Rifai N, Rose L, et al. Comparison of C‐reactive protein and low‐density lipoprotein cholesterol levels in the prediction of first cardiovascular events. N Engl J Med. 2002;347(20):1557 – 1565. [DOI] [PubMed] [Google Scholar]
- 9. Ridker PM, Buring JE, Cook NR, et al. C‐reactive protein, the metabolic syndrome, and risk of incident cardiovascular events: an 8‐year follow‐up of 14,719 initially healthy American women. Circulation. 2003;107(3):391 – 397. [DOI] [PubMed] [Google Scholar]
- 10. Taniguchi A, Nagasaka S, Fukushima M, et al. C‐reactive protein and insulin resistance in non‐obese Japanese type 2 diabetic patients. Metabolism. 2002;51(12):1578 – 1581. [DOI] [PubMed] [Google Scholar]
- 11. Pradhan AD, Manson JE, Rifai N, et al. C‐reactive protein, interleukin 6, and risk of developing type 2 diabetes mellitus. JAMA. 2001;286(3):327 – 334. [DOI] [PubMed] [Google Scholar]
- 12. Freeman DJ, Norrie J, Caslake MJ, et al. C‐reactive protein is an independent predictor of risk for the development of diabetes in the West of Scotland Coronary Prevention Study. Diabetes. 2002;51(5):1596 – 1600. [DOI] [PubMed] [Google Scholar]
- 13. King DE, Buchanan TA, Mainous AG 3rd, et al. C‐reactive protein and glycemic control in adults with diabetes. Diabetes Care. 2003;26(5):1535 – 1539. [DOI] [PubMed] [Google Scholar]
- 14. Kervinen H, Palosuo T, Manninen V, et al. Joint effects of C‐reactive protein and other risk factors on acute coronary events. Am Heart J. 2001;141(4):580 – 585. [DOI] [PubMed] [Google Scholar]
- 15. Sung KC, Suh JY, Kim BS, et al. High sensitivity C‐reactive protein as an independent risk factor for essential hypertension. Am J Hypertens. 2003;16(6):429 – 433. [DOI] [PubMed] [Google Scholar]
- 16. Sesso HD, Buring JE, Rifai N, et al. C‐reactive protein and the risk of developing hypertension. JAMA. 2003;290(22):2945 – 2951. [DOI] [PubMed] [Google Scholar]
- 17. Wener MH, Daum PR, McQuillan GM. The influence of age, sex, and race on the upper reference limit of serum C‐reactive protein concentration. J Rheumatol. 2000;27(10):2351 – 2359. [PubMed] [Google Scholar]
- 18. Tracy RP, Psaty BM, Macy E, et al. Lifetime smoking exposure affects the association of C‐reactive protein with cardiovascular disease risk factors and subclinical disease in healthy elderly subjects. Arterioscler Thromb Vasc Biol. 1997;17(10):2167 – 2176. [DOI] [PubMed] [Google Scholar]
- 19. King DE, Carek P, Mainous AG 3rd, et al. Inflammatory markers and exercise: differences related to exercise type. Med Sci Sports Exerc. 2003;35(4):575 – 581. [DOI] [PubMed] [Google Scholar]
- 20. Ford ES. Body mass index, diabetes, and C‐reactive protein among US Adults. Diabetes Care. 1999;22(12):1971 – 1977. [DOI] [PubMed] [Google Scholar]
- 21. Wu T, Dorn JP, Donahue RP, et al. Associations of serum C‐reactive protein with fasting insulin, glucose, and glycosylated hemoglobin: the Third National Health and Nutrition Examination Survey, 1988–1994. Am J Epidemiol. 2002;155(1):65 – 71. [DOI] [PubMed] [Google Scholar]
- 22. Rosner B, ed. Fundamentals of Biostatistics. 5th ed. Pacific Grove, CA: Duxbury Press; 2000. [Google Scholar]
- 23. Curb JD, Pressel SL, Cutler JA, et al. Effect of diuretic‐based antihypertensive treatment on cardiovascular disease risk in older diabetic patients with isolated systolic hypertension: Systolic Hypertension in the Elderly Program Cooperative Research Group. JAMA. 1996;276(23):1886 – 1892. [PubMed] [Google Scholar]
- 24. Stamler J, Stamler R, Neaton JD. Blood pressure, systolic and diastolic, and cardiovascular risks. US population data. Arch Intern Med. 1993;153(5):598 – 615. [DOI] [PubMed] [Google Scholar]
- 25. Robinson SC, Brucer M. Range of normal blood pressure: a statistical and clinical study of 11,383 persons. Arch Intern Med. 1939;3(64):409 – 444. [Google Scholar]
- 26. Esposito K, Pontillo A, DiPalo C, et al. Effect of weight loss and lifestyle changes on vascular inflammatory markers in obese women. JAMA. 2003;289(14):1799 – 1804. [DOI] [PubMed] [Google Scholar]
- 27. Grau AJ, Buggle F, Becher H, et al. The association of leukocyte count, fibrinogen and C‐reactive protein with vascular risk factors and ischemic vascular diseases. Thromb Res. 1996;82(3):245 – 255. [DOI] [PubMed] [Google Scholar]
- 28. Rohde LE, Hennekens CH, Ridker PM. Survey of C‐reactive protein and cardiovascular risk factors in apparently healthy men. Am J Cardiol. 1999;84(9):1018 – 1022. [DOI] [PubMed] [Google Scholar]
- 29. Yasunari K, Maeda K, Nakamura M, et al. Oxidative stress in leukocytes is a possible link between blood pressure, blood glucose, and C‐reacting protein. Hypertension. 2002;39:777 – 780. [DOI] [PubMed] [Google Scholar]
- 30. Lopes HF, Martin KL, Nashar K, et al. DASH diet lowers blood pressure and lipid‐induced oxidative stress in obesity. Hypertension. 2003;41(3):422 – 430. [DOI] [PubMed] [Google Scholar]
- 31. Pasceri V, Willerson JT, Yeh ET. Direct proinflammatory effect of C‐reactive protein on human endothelial cells. Circulation. 2000;102(18):2165 – 2168. [DOI] [PubMed] [Google Scholar]
- 32. Pasceri V, Cheng JS, Willerson JT, et al. Modulation of C‐reactive protein‐mediated monocyte chemoattractant protein‐1 induction in human endothelial cells by anti‐atherosclerosis drugs. Circulation. 2001;103(21):2531 – 2534. [DOI] [PubMed] [Google Scholar]
- 33. Devaraj S, Xu DY, Jialal I. C‐reactive protein increases plasminogen activator inhibitor‐1 expression and activity in human aortic endothelial cells: implications for the metabolic syndrome and atherothrombosis. Circulation. 2003;107(3):398 – 404. [DOI] [PubMed] [Google Scholar]