

Abstract
Understanding the impact of patient factors on blood pressure (BP) management is an important step to developing interventions to improve cardiovascular health. The National Health and Nutrition Examination Survey (NHANES) 1999–2002 was used to identify predictors of hypertension awareness, treatment, and control. An estimated 63.3 million (31.0%) US adults currently have BP exceeding 140/90 mm Hg, and prevalence is higher for blacks than for other racial/ethnic subgroups. Among antihypertensive medication‐treated patients, 51.3% are controlled. Treated blacks and Mexican Americans have the lowest rates of BP control. Mexican Americans are 0.62 times as likely to be aware and 0.61 times as likely to be treated as white persons with hypertension. Compared with whites, treated Mexican Americans are 0.71 times as likely and treated blacks 0.59 times as likely to achieve BP control. Hypertension treatment and BP control in the United States remain suboptimal, and significant racial/ethnic disparities persist. Effective interventions targeting Mexican Americans and blacks as well as whites are essential to improving hypertension management.
The level of blood pressure (BP) is an important indicator of cardiovascular (CV) health. A BP exceeding 140/90 mm Hg has been used to indicate the presence of hypertension, although it has been realized for years that there is no threshold for the determination of CV risk. Several recent reports have documented that the prevalence of persons in the United States with BP exceeding 140/90 mm Hg is on the rise. 1 , 2 , 3 Hypertension prevalence estimates have increased from 25.0% in 1991–1994 2 to 31.3% for 1999–2000. 1 (Part of this increase may be the result of redefining the level of BP that defines hypertension, especially in the elderly.) During 1999–2000, only 58% of persons with BPs exceeding 140/90 mm Hg were treated pharmacologically. 2 While BP control in treated patients has improved, from 47% in 1988–1991 to 53.1%in 1999–2000, 2 the objective should be to treat all patients to BP goal. An estimated 31% of all US hypertensive persons are controlled to BP of <140/90 mm Hg. 2
Improving hypertension control rates requires an understanding of barriers to control. Analysis of the National Health and Nutrition Examination Survey (NHANES) 1999–2002 found a prevalence of hypertension of 41.4% in blacks compared with 28.1% in whites, and although treatment and awareness rates were higher among blacks, control rates were higher in treated whites (59.7%) than blacks (48.9%). 4 Analysis of NHANES 1999–2000 found that, compared with whites, Mexican Americans were less likely to receive antihypertensive medication, and both treated blacks and Mexican Americans had lower BP control rates. 2 Patient racial, ethnic, and socioeconomic characteristics can impact health care access; Hispanics are less likely to have a regular health care provider and health insurance than blacks or whites, 5 and hypertensive blacks are less likely to have health insurance compared with whites. 4
Clinical trials have demonstrated the benefits of antihypertensive therapy on CV disease morbidity and mortality. 6 , 7 Annual direct medical expenditures for uncontrolled hypertension in the United States are estimated at $964 million, and among pharmacologically treated patients with CV disease, the estimated incremental cost of failure to achieve a BP goal is $467 million. 8 It is now recognized that even lower BPs are optimal and that BPs exceeding 140/90 mm Hg represent advanced disease 9 ; a recent trial found that BP increases in patients with prehypertension may be prevented by early pharmacologic treatment. 10
We used NHANES 1999–2002 to describe the effect of patient characteristics on BP management in the United States. Hypertension awareness, treatment, and control rates were assessed overall and for racial/ethnic subgroups. This study updates the current literature by using the most recent US epidemiologic data, NHANES 1999–2002, to illustrate racial/ethnic disparities in hypertension management.
METHODS
Eligibility Criteria
This cross‐sectional study used data from NHANES, an ongoing stratified multistage probability sample of the noninstitutionalized US population conducted by the National Center for Health Statistics. 11 , 12 Data from the 1999–2002 surveys were used for this analysis. Respondents 18 years and older who participated in the interview and medical examination (N=19,759) were eligible.
Persons with hypertension were identified if at least 1 of these criteria were met: (1) systolic BP (SBP) at least 140 mm Hg or diastolic BP (DBP) at least 90 mm Hg; (2) subject reported current use of an antihypertensive medication; or (3) the subject had been told by a doctor or health professional on 2 or more different visits that he/she had hypertension. The average of all available BP measurements from the medical examination data was used for analysis. Pregnant women were excluded from the analysis.
Study Definitions
Body mass index was calculated as weight in kilograms divided by the square of height in meters. 13 , 14 Subjects were considered to be aware of their hypertensive status if they answered “yes” to the question: “Have you ever been told by a doctor or health care professional that you had hypertension, also called high blood pressure?” Subjects were considered to be treated if they answered “yes” to the question: “Because of your high blood pressure/hypertension are you now taking prescribed medicine?” BP control was defined in nondiabetic subjects who were medically treated as SBP <140 mm Hg and DBP <90 mm Hg; for diabetic subjects, control was defined as SBP <130 mm Hg and DBP <80 mm Hg. Presence of diabetes was determined as either self‐reported current use of insulin and/or oral hypoglycemic agents and/or if the subject responded “yes” to the question, “Have you ever been told by a doctor or other health professional that you have diabetes (also known as “sugar diabetes”)?”
Data Analysis
Participants were categorized by self‐report of race/ethnicity as non‐Hispanic white, non‐Hispanic black, Mexican American, other Hispanic (non‐Mexican American), and all others. While descriptive results (Table I) are presented for all racial/ethnic subgroups, statistical comparisons were not performed for the “all other” subgroup, due to the many different racial/ethnic backgrounds constituting this subgroup.
Table I.
Demographic and Clinical Characteristics in US Adults With Hypertension,* NHANES 1999–2002, by Race/Ethnicity
| Characteristic, % (SE) | Non‐Hispanic White (n=1769) | Non‐Hispanic Black (n=846) | Mexican American (n=677) | Non‐Mexican American Hispanic (n=155) | All Others (Including Multiracial) (n=99) | Total (n=3546) | ||||||
|---|---|---|---|---|---|---|---|---|---|---|---|---|
| Prevalence (age‐specific), y | ||||||||||||
| 18–39 | 10.66 | (1.07) | 15.83 | (1.38) | 7.84 | (1.11) | 10.03 | (2.74) | 12.15 | (3.93) | 11.01 | (0.93) |
| 40–54 | 27.77 | (1.87) | 45.40 | (2.38) | 25.59 | (2.36) | 23.42 | (5.64) | 35.23 | (6.37) | 29.66 | (1.59) |
| 55–64 | 47.83 | (2.00) | 68.17 | (3.23) | 46.01 | (2.82) | 52.47 | (7.43) | 50.17 | (8.96) | 50.19 | (1.58) |
| 65–74 | 65.31 | (2.11) | 82.18 | (2.58) | 62.51 | (2.89) | 76.60 | (3.95) | 65.49 | (10.13) | 67.27 | (1.80) |
| ≥75 | 76.30 | (1.24) | 82.56 | (3.17) | 79.20 | (3.71) | 69.19 | (8.91) | 63.88 | (16.20) | 76.23 | (1.25) |
| Prevalence (age‐adjusted) Estimated no. hypertensives | 46,191,000 | 8,349,000 | 2,649,000 | 3,535,000 | 2,546,000 | 63,271,000 | ||||||
| Overall | 29.75 | (0.88) | 41.77 | (0.93) | 28.19 | (1.10) | 29.25 | (2.19) | 31.54 | (3.29) | 30.95 | (0.80) |
| Female | 29.17 | (0.88) | 42.59 | (1.41) | 28.86 | (1.26) | 30.32 | (2.39) | 32.70 | (3.71) | 31.02 | (0.67) |
| Male | 29.86 | (1.28) | 40.48 | (1.19) | 27.06 | (1.53) | 27.68 | (3.37) | 29.83 | (4.14) | 30.39 | (1.22) |
| Among hypertensives | ||||||||||||
| Age, mean (SE), y | 59.49 | (0.57) | 52.93 | (0.72) | 51.12 | (1.34) | 56.13 | (2.24) | 51.25 | (2.23) | 57.75 | (0.49) |
| 18–39 | 11.98 | (1.37) | 18.91 | (1.88) | 26.29 | (3.55) | 20.58 | (6.04) | 20.79 | (5.98) | 14.33 | (1.23) |
| 40–54 | 26.96 | (1.31) | 36.19 | (1.85) | 33.94 | (3.22) | 23.45 | (4.67) | 40.74 | (5.80) | 28.83 | (0.96) |
| 55–64 | 18.95 | (1.09) | 20.02 | (1.32) | 17.23 | (1.46) | 20.67 | (4.56) | 20.56 | (4.71) | 19.18 | (0.79) |
| 65–74 | 20.89 | (0.93) | 15.42 | (1.13) | 14.29 | (1.52) | 21.62 | (4.34) | 12.20 | (3.45) | 19.58 | (0.74) |
| ≥75 | 21.22 | (1.24) | 9.46 | (1.42) | 8.24 | (1.23) | 13.68 | (3.37) | 5.71 | (3.17) | 18.08 | (0.93) |
| Sex | ||||||||||||
| Female | 53.10 | (1.16) | 57.34 | (1.85) | 50.03 | (2.76) | 59.25 | (3.93) | 58.42 | (5.25) | 54.09 | (1.01) |
| Male | 46.90 | (1.16) | 42.66 | (1.85) | 49.97 | (2.76) | 40.75 | (3.93) | 41.58 | (5.25) | 45.91 | (1.01) |
| BMI, mean (SE) | 29.86 | (0.23) | 31.16 | (0.32) | 30.54 | (0.35) | 29.51 | (0.61) | 29.01 | (1.23) | 30.01 | (0.18) |
| BMI, kg/m2 | ||||||||||||
| <25 | 26.86 | (1.25) | 24.46 | (1.32) | 21.47 | (2.18) | 21.24 | (6.22) | 37.25 | (5.41) | 26.42 | (0.88) |
| 25–<30 | 33.38 | (1.16) | 29.08 | (1.80) | 34.39 | (2.07) | 39.46 | (3.93) | 30.03 | (7.57) | 33.06 | (1.07) |
| ≥30 | 39.76 | (1.24) | 46.46 | (1.98) | 44.14 | (2.84) | 39.30 | (5.06) | 32.69 | (8.44) | 40.52 | (1.13) |
| Smoking history | ||||||||||||
| Every day | 27.62 | (1.77) | 42.93 | (3.08) | 35.85 | (2.95) | 28.86 | (5.64) | 28.15 | (7.01) | 29.82 | (1.40) |
| Some days | 3.16 | (0.79) | 7.60 | (1.65) | 11.61 | (2.62) | 9.26 | (4.97) | 17.76 | (7.33) | 4.77 | (0.77) |
| Not at all | 69.22 | (1.80) | 49.47 | (3.09) | 52.54 | (3.63) | 61.89 | (5.48) | 54.09 | (9.49) | 65.41 | (1.48) |
| Household income, $ | ||||||||||||
| <35,000 | 40.11 | (2.11) | 53.02 | (2.57) | 46.77 | (3.71) | 59.28 | (7.83) | 39.86 | (11.66) | 43.15 | (1.74) |
| 35,000–74,999 | 28.82 | (1.64) | 19.29 | (2.01) | 26.47 | (2.13) | 19.94 | (5.39) | 35.66 | (8.69) | 27.25 | (1.21) |
| ≥75,000 | 20.83 | (1.84) | 10.99 | (1.23) | 11.01 | (2.81) | 6.16 | (2.54) | 12.81 | (4.62) | 17.98 | (1.42) |
| Refuse or don't know | 10.23 | (1.28) | 16.70 | (1.65) | 15.74 | (2.03) | 14.62 | (4.78) | 11.66 | (4.58) | 11.62 | (1.19) |
| NHANES indicates National Health and Nutrition Examination Survey; BMI, body mass index. *Patients who: (1) had been told at least twice by doctors or other health professionals that they had hypertension or high blood pressure; (2) had systolic blood pressure ≥140 mm Hg or diastolic blood pressure ≥90 mm Hg; or (3) currently use antihypertension medication; and (4) were at least 18 years old. Pregnant women and patients who did not have a physical examination were excluded. | ||||||||||||
The combined NHANES was weighted to calculate age‐specific hypertension prevalence, and projected rates of control, awareness, and treatment of hypertension in the US population, using the adjusted sampling weights for the aggregated 4‐year data. 15 The percentage (and SE) of persons in each group relative to ethnic/racial group was calculated using sample weights. The prevalence of hypertension for the US population was estimated after adjusting for population age using the standard 2000 noninstitutionalized US population.
Differences among race/ethnic groups were compared using the chi‐square test. Logistic regression was used to estimate odd ratios and their 95% confidence intervals (CIs) for the association of hypertension awareness, treatment, control, and race/ethnicity while controlling for subject demographics (age, sex, income, health insurance status) and comorbid conditions (obesity class, renal insufficiency, heart disease, stroke). Study analyses were performed using SAS 9.1 (SAS Institute, Inc, Cary, NC) and SUDAAN (RTI International, Research Triangle Park, NC) statistical software. 16 , 17
RESULTS
Currently 63.3 million persons in the United States are estimated to have BPs exceeding 140/90 mm Hg, an age‐adjusted prevalence of 31.0%. The adult hypertensive population identified using NHANES 1999–2002 (N=3546) is described in Table I. Age‐adjusted prevalence of hypertension is highest in blacks (41.8%), followed by whites (29.8%), other Hispanics (29.3%), and Mexican Americans (28.2%). Age‐adjusted hypertension prevalence in whites is similar for men and women; in all other racial/ethnic subgroups, small differences were seen, with more women than men having hypertension. Hypertensive Mexican Americans are younger (mean age, 51.1 years) than whites (59.5 years), other Hispanics (56.1 years), or blacks (52.9 years). Among hypertensive persons, blacks are more likely than other racial/ethnic subgroups to be obese, while whites are less likely to be smokers.
Among hypertensive persons, whites are more likely than other racial/ethnic subgroups to have health insurance (Table II), while Mexican Americans are least likely to report a routine health care site and most likely to report no health care visits within the past year. Among hypertensive individuals, prevalence of diabetes is lower for whites than for other racial/ethnic subgroups. Mean BP for persons with hypertension is 141/76 mm Hg (Table II). Mean BP is lowest for whites compared with other racial/ethnic subgroups and highest for blacks.
Table II.
Socioeconomic and Clinical Characteristics of US Adults With Hypertension,* NHANES 1999–2002, by Race/Ethnicity
| Characteristic, % (SE) | Non‐Hispanic White (n=1769) | Non‐Hispanic Black (n=846) | Mexican American (n=677) | Non‐Mexican American Hispanic (n=155) | Total (n=3447) | P | ||||||
|---|---|---|---|---|---|---|---|---|---|---|---|---|
| Have health insurance | 92.50 | (0.92) | 83.32 | (1.14) | 68.40 | (3.55) | 82.00 | (4.18) | 89.58 | (0.93) | <.0001 | |
| Have a routine site for health care | 94.24 | (0.64) | 91.96 | (0.61) | 80.15 | (2.39) | 91.98 | (3.32) | 93.13 | (0.67) | <.0001 | |
| No. health care visits in past year | ||||||||||||
| None | 8.39 | (0.67) | 10.49 | (0.98) | 17.18 | (2.16) | 12.31 | (2.72) | 9.29 | (0.59) | <.0001 | |
| 1 | 12.63 | (0.80) | 15.57 | (1.04) | 14.01 | (1.60) | 10.95 | (2.99) | 13.00 | (0.72) | ||
| 2–3 | 30.38 | (1.18) | 24.63 | (1.69) | 25.35 | (2.11) | 27.72 | (5.57) | 29.21 | (0.98) | ||
| 4–9 | 31.30 | (1.09) | 29.96 | (1.38) | 25.58 | (2.56) | 26.26 | (3.14) | 30.57 | (0.93) | ||
| ≥10 | 8.62 | (0.77) | 8.93 | (1.26) | 10.59 | (0.86) | 15.92 | (2.81) | 9.17 | (0.66) | ||
| Refuse or don't know | 8.69 | (0.65) | 10.41 | (1.21) | 7.29 | (1.24) | 6.84 | (1.66) | 8.76 | (0.58) | ||
| Most frequent site for health care | ||||||||||||
| Clinic or heath center | 17.65 | (2.87) | 19.35 | (2.13) | 30.79 | (2.49) | 22.48 | (3.50) | 18.74 | (2.29) | <.0001 | |
| Doctor's office, HMO, hospital outpatient department | 74.74 | (2.46) | 67.27 | (2.26) | 48.31 | (2.18) | 67.09 | (4.81) | 72.12 | (2.01) | ||
| ED or others | 1.78 | (0.40) | 5.34 | (0.98) | 0.94 | (0.38) | 2.41 | (1.61) | 2.27 | (0.41) | ||
| Refuse or don't know | 5.82 | (0.65) | 8.04 | (0.61) | 19.96 | (2.37) | 8.02 | (3.32) | 6.87 | (0.68) | ||
| Comorbid conditions | ||||||||||||
| Diabetes† | 13.01 | (0.56) | 22.69 | (1.77) | 22.73 | (2.08) | 21.33 | (4.31) | 15.25 | (0.55) | <.0001 | |
| Renal insufficiency‡ | 10.43 | (0.86) | 17.61 | (1.97) | 8.75 | (1.36) | 14.42 | (3.54) | 11.58 | (0.69) | .0047 | |
| Heart disease (CHE CHD, angina, or heart attack) | 16.02 | (0.98) | 13.19 | (1.47) | 9.33 | (1.26) | 13.47 | (2.84) | 15.19 | (0.88) | .0008 | |
| Stroke§ | 5.76 | (0.59) | 7.32 | (0.95) | 3.84 | (0.64) | 4.99 | (2.11) | 5.85 | (0.47) | .0217 | |
| Systolic/Diastolic BP, mean, mm Hg | ||||||||||||
| All hypertensives | 140/75 | 142/79 | 141/78 | 142/76 | 141/76 | |||||||
| Treated hypertensives | 137/72 | 141/77 | 141/73 | 140/74 | 137/73 | |||||||
| Hypertensive diabetics | 139/68 | 142/73 | 143/71 | 141/75 | 140/71 | |||||||
| NHANES indicates National Health and Nutrition Examination Survey; HMO, health maintenance organization; ED, emergency department; CHE congestive heart failure; CHD, coronary heart disease; and BP, blood pressure. *See Table I for definition. †Patients who reported a diabetes diagnosis, were currently taking insulin and/or an oral hypoglycemic agent, or had hemoglobin A1C of ≥7%. ‡Defined as a glomerular filtration rate <60 mL/min per 1.73 m2. §Patients who were told by a doctor or other health professional that they had a stroke. | ||||||||||||
More than half (52.6%) of hypertensive adults are currently receiving antihypertensive medication. Among medication users, mean BP is 137/73 mm Hg. Trends for treated hypertensive patients by race/ethnicity are similar to those for all hypertensive subjects, as among treated patients, whites have the lowest mean BP (137/72 mm Hg), while blacks have the highest (141/77 mm Hg).
Overall, 70.6% of hypertensive persons in the United States are aware that they have hypertension (Figure 1). Mexican Americans are least likely to be aware of their hypertensive status. Across all racial/ethnic subgroups, age and sex play a significant role in awareness rates; hypertensive persons aged 18 to 39 are less likely to be aware than other age groups, as are men compared with women (Table III). This difference is most pronounced in Mexican Americans, as only 52.8% of Mexican American men are aware of their hypertensive status compared with 70.9% of women.
Figure 1.
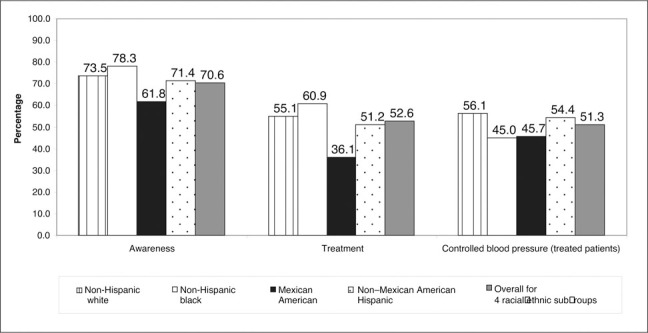
Proportion of awareness, treatment, and controlled blood pressure in treated hypertensive patients. Control is defined as blood pressure <140/90 mm Hg for nondiabetic persons and <130/80 mm Hg for persons wth diabetes.
Table III.
Awareness, Treatment, and BP Control in US Adults With Hypertension,* NHANES 1999–2002, by Demographic Strata
| Characteristic, % (SE) | Non‐Hispanic White | Non‐Hispanic Black | Mexican American | Non‐Mexican American Hispanic | Total | |||||
|---|---|---|---|---|---|---|---|---|---|---|
| Awareness† | 73.50 | (1.05) | 78.26 | (1.72) | 61.84 | (2.58) | 71.42 | (4.86) | 70.55 | (1.04) |
| Age, y | ||||||||||
| 18–39 | 65.26 | (4.36) | 65.79 | (5.30) | 49.66 | (5.82) | 59.68 | (9.41) | 63.61 | (3.13) |
| 40–54 | 75.27 | (2.47) | 79.35 | (2.67) | 65.12 | (3.82) | 74.15 | (10.86) | 75.40 | (1.94) |
| 55–64 | 78.29 | (2.11) | 87.22 | (2.59) | 67.43 | (5.55) | 73.56 | (7.58) | 78.85 | (1.79) |
| 65–74 | 73.45 | (2.07) | 81.44 | (2.18) | 68.84 | (3.46) | 77.89 | (4.44) | 74.44 | (1.76) |
| ≥75 | 71.70 | (1.55) | 74.93 | (2.55) | 63.35 | (6.42) | 70.97 | (9.51) | 71.79 | (1.32) |
| Sex | ||||||||||
| Male | 71.01 | (1.37) | 69.81 | (2.35) | 52.79 | (4.06) | 63.96 | (8.89) | 69.63 | (1.18) |
| Female | 75.70 | (1.85) | 84.55 | (1.83) | 70.88 | (3.02) | 76.56 | (3.73) | 76.86 | (1.56) |
| Treatment | 55.07 | (1.75) | 60.93 | (1.86) | 36.11 | (2.88) | 51.15 | (5.01) | 52.61 | (1.52) |
| Age, y | ||||||||||
| 18–39 | 18.51 | (2.81) | 30.07 | (3.33) | 9.67 | (4.72) | 28.91 | (11.30) | 19.36 | (3.74) |
| 40–54 | 51.56 | (3.07) | 60.16 | (3.35) | 34.26 | (3.11) | 44.91 | (10.13) | 54.99 | (4.21) |
| 55–64 | 65.96 | (2.46) | 77.18 | (2.98) | 50.40 | (5.44) | 64.19 | (9.01) | 67.78 | (2.79) |
| 65–74 | 52.47 | (2.80) | 73.61 | (2.38) | 62.52 | (2.95) | 62.51 | (5.25) | 60.07 | (3.10) |
| ≥75 | 62.79 | (2.52) | 70.47 | (2.41) | 52.40 | (4.38) | 57.66 | (11.51) | 59.33 | (3.71) |
| Sex | ||||||||||
| Male | 50.59 | (1.86) | 51.66 | (1.92) | 29.08 | (2.76) | 38.00 | (7.88) | 50.68 | (2.79) |
| Female | 59.03 | (2.38) | 67.82 | (2.31) | 43.13 | (3.76) | 60.19 | (5.48) | 57.82 | (2.55) |
| BP control‡ among treated hypertensives | 56.11 | (1.44) | 45.01 | (1.84) | 45.74 | (3.77) | 54.43 | (5.45) | 51.27 | (1.31) |
| Age, y | ||||||||||
| 18–39 | 59.92 | (11.70) | 44.57 | (8.21) | 64.76 | (19.90) | 100.00 | (0.00) | 60.75 | (7.66) |
| 40–54 | 69.64 | (2.80) | 46.98 | (4.20) | 53.31 | (7.09) | 66.76 | (16.47) | 64.36 | (2.54) |
| 55–64 | 63.59 | (3.31) | 48.57 | (4.23) | 43.44 | (4.02) | 40.68 | (9.90) | 59.12 | (2.85) |
| 65–74 | 52.26 | (2.43) | 41.98 | (4.60) | 41.62 | (7.37) | 31.35 | (10.27) | 48.37 | (2.62) |
| ≥75 | 38.04 | (3.50) | 35.82 | (4.93) | 27.26 | (6.15) | 66.23 | (9.66) | 38.80 | (3.23) |
| Sex | ||||||||||
| Male | 62.52 | (2.65) | 49.35 | (2.86) | 37.27 | (4.88) | 55.87 | (15.42) | 59.78 | (2.19) |
| Female | 51.26 | (2.02) | 42.55 | (2.56) | 51.44 | (4.80) | 53.80 | (5.23) | 49.99 | (1.66) |
| NHANES indicates National Health and Nutrition Examination Survey. *See Table I for definition. †Defined as a positive response to the question, “Have you ever been told by a doctor or other health professional that you had hypertension, also called high blood pressure?”‡Defined as blood pressure (BP) <140/90 mm Hg for nondiabetic persons and <130/80 mm Hg for persons with diabetes. | ||||||||||
While 52.6% of hypertensive individuals are treated, treatment rates between racial/ethnic subgroups vary, as only 36.1% of Mexican Americans are receiving medication (Figure 1), compared with 51.2% of other Hispanics, 55.1% of whites, and 60.9% of blacks. Persons aged 18 to 39 are less likely to be treated than those 40 years and older (Table III); fewer than 1 in 5 hypertensive persons aged 18 to 39 are receiving antihypertensive medication, although 63.6% of persons aged 18 to 39 reported hypertension awareness. Overall, women (57.8%) are more likely to be treated than men (50.7%). While white women are slightly more likely to be treated than white men, the difference between the sexes is more pronounced for other racial/ethnic subgroups: 51.7% of black men vs 67.8% of black women, 38.0% of other Hispanic men vs 60.2% of women, and 29.1% of Mexican American men vs 43.1% of women.
Among treated persons, 51.3% are controlled to SBP less than 140 mm Hg and DBP less than 90 mm Hg; blacks (45.0%) and Mexican Americans (45.7%) have the lowest rates of BP control (Figure 1). Control rates among treated patients decrease with age (Table III). Overall, treated men are more likely to be controlled (59.8%) than women (50.0%). Treated Mexican American women (51.4%) are much more likely than men (37.3%) to have their BP controlled. For all other racial/ethnic subgroups, control rates were higher in treated men than women (Table III).
Approximately 15.3% of US hypertensive persons have diabetes. Mean BP (140/71 mm Hg) is slightly lower in this subgroup than all hypertensive individuals (141/76 mm Hg) (Table II). Treatment, awareness, and control rates are shown in Figure 2. Overall, 81.0% of hypertensive diabetic subjects are aware of their hypertensive status; awareness rates are highest for blacks compared with other subgroups. Among hypertensive diabetic individuals, 74.7% are using antihypertensive medication; hypertension treatment rates in this subset are significantly lower for Mexican Americans (64.4%) compared with blacks (81.3%; P=.019). Fewer than one third (32.5%) of hypertensive diabetic patients using antihypertensive medication have their BP controlled at less than 130/80 mm Hg, a definition that has been used only for the past several years. A sensitivity analysis using the older, less restrictive definition of BP control in patients with diabetes found that 51.7% of hypertensive diabetic patients receiving antihypertensive medication had BP less than 140/90 mm Hg. BP control rates for treated hypertensive diabetic patients are highest for whites compared with blacks or Mexican Americans; approximately 1 in 4 black or Mexican American persons with hypertension and diabetes receiving antihypertensive medication have controlled BP.
Figure 2.
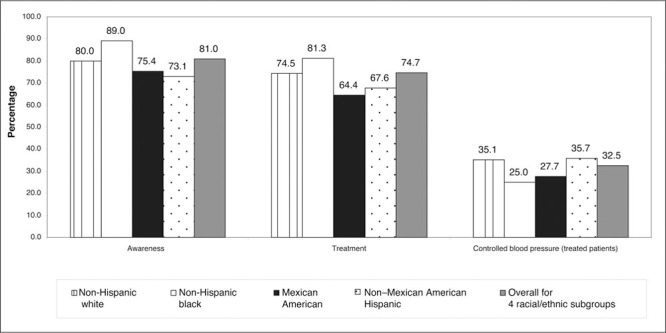
Proportion of awareness, treatment, and controlled blood pressure in treated diabetic hypertensive patients. Control is defined as blood pressure <130/80 mm Hg.
Odds ratios (ORs) for hypertension awareness, treatment, and BP control are shown in Table IV. Mexican Americans with hypertension are 0.62 (95% CI, 0.47–0.82) times as likely as whites to be aware of their hypertensive status. Blacks are 1.38 (95% CI, 1.12–1.72) times as likely to be treated than whites, while Mexican Americans are 0.61 (95% CI, 0.46–0.80) times as likely to be treated. Among treated hypertensive patients, blacks (OR, 0.59; 95% CI, 0.44–0.78) and Mexican Americans (OR, 0.71; 95% CI, 0.50–1.00) are less likely to be controlled compared with whites. Persons aged 40 to 54 are 1.51 (95% CI, 1.04–2.21) times as likely than those aged 18 to 39 to be aware of their hypertensive status, and women are 1.42 (95% CI, 1.07–1.88) times as likely to be aware than men. Women are 1.28 (95% CI, 1.04–1.58) times as likely to be treated than men, and persons with health insurance are 2.86 (95% CI, 1.87–4.36) times as likely to be treated than those without, and are 1.87 (95% CI, 1.07–3.28) times as likely to achieve BP control. Controlling for covariates, sex is a significant predictor of both awareness and treatment; however, treated men and women are equally likely to achieve BP control.
Table IV.
ORs of Awareness, Treatment, and Controlled Blood Pressure in Treated Hypertensive Patients*
| Sample Patients, OR (95% CI) | Awareness All Hypertensive Subjects | Treatment All Hypertensive Patients | Controlled Blood Pressure Treated Hypertensive Patients† | |||
|---|---|---|---|---|---|---|
| Race/ethnicity | ||||||
| Non‐Hispanic white | 1 | 1 | 1 | |||
| Non‐Hispanic black | 1.07 | (0.80–1.42) | 1.38 | (1.12–1.72) | 0.59 | (0.44–0.78) |
| Mexican American | 0.62 | (0.47–0.82) | 0.61 | (0.46–0.80) | 0.71 | (0.50–1.00) |
| Non‐Mexican American Hispanic | 0.89 | (0.48–1.66) | 1.01 | (0.55–1.84) | 0.84 | (0.40–1.74) |
| Age, y | ||||||
| 18–39 | 1 | 1 | 1 | |||
| 40–54 | 1.51 | (1.04–2.21) | 3.64 | (2.55–5.21) | 1.31 | (0.61–2.82) |
| 55–64 | 1.48 | (0.98–2.23) | 6.40 | (4.65–8.81) | 0.87 | (0.40–1.92) |
| 65–74 | 1.17 | (0.82–1.66) | 5.21 | (3.62–7.49) | 0.67 | (0.29–1.54) |
| ≥75 | 0.88 | (0.58–1.35) | 4.73 | (3.29–6.80) | 0.37 | (0.15–0.89) |
| Sex | ||||||
| Male | 1 | 1 | 1 | |||
| Female | 1.42 | (1.07–1.88) | 1.28 | (1.04–1.58) | 0.80 | (0.61–1.05) |
| Health insurance | ||||||
| No | 1 | 1 | 1 | |||
| Yes | 1.28 | (0.96–1.71) | 2.86 | (1.87–4.36) | 1.87 | (1.07–3.28) |
| Presence of diabetes | 1.61 | (1.24–2.09) | 2.00 | (1.48–2.72) | 0.81 | (0.60–1.09) |
| *Odds ratios (ORs) calculated using logistic regression adjusting for variables listed in addition to body mass index, household income, and presence of renal insufficiency, heart disease, and history of stroke. †Treated hypertensive patients were those who were currently taking antihypertensive medication. CI indicates confidence interval. | ||||||
DISCUSSION
An estimated 63.3 million (31.4%) US adults have BPs exceeding 140/90 mm Hg. This estimate is higher than a recent NHANES 1999–2002 publication by the Centers for Disease Control (CDC), which estimated prevalence at 28.6%, 3 and higher than NHANES 1999–2000 reports, which estimated that 58.4 million (28.7%) had hypertension. 2 While the current study included persons who reported being told of hypertensive status at least 2 times by a health care professional, in addition to those who had SBP at least 140 mm Hg or DBP at least 90 mm Hg, or reported use of antihypertensive medication, the CDC estimate excluded people who were identified as hypertensive only by being told by a health care professional. Our definition of hypertension mirrors that of Fields et al, 1 who estimated hypertension prevalence using NHANES 1999–2000 at 31.3%. We recognize that the definition of hypertension is evolving 9 and future analyses must consider new definitions.
Based on NHANES 1999–2002 data, 53.4% of treated hypertensive persons are controlled to BP less than 140/90 mm Hg, compared with 53.1% from NHANES 1999–2000 data, and 43.6% for NHANES 1991–1994. 2 Despite an increase in control rates among treated hypertensive persons in 1999–2002 compared with prior years, almost half of Americans using antihypertensive medication have a BP exceeding 140/90 mm Hg. Significant disparities in awareness, treatment, and control rates are evident among racial/ethnic subgroups (Figure 1), with implications for future strategies for the management of elevated BPs.
Awareness
Awareness rates are similar for blacks and whites with hypertension, but Mexican Americans are less likely to be aware of their hypertensive status than whites or blacks. The reasons for the lack of awareness among Mexican Americans are not apparent from our data but may reflect access to health care. Also, there have been many more initiatives related to hypertension that target the African American population.
Treatment and Control of BP
Blacks are more likely than whites to be treated. Mexican Americans stand out as a group that is not receiving treatment for increased BP similar to other racial/ethnic groups, and, among Mexican Americans, men are less likely to be aware or treated. Compared with whites, treated hypertensive blacks and Mexican Americans are less likely to achieve BP control. Although the proportion of treated Mexican Americans who achieve BP of <140/90 mm Hg (45.7%) is similar to the proportion of blacks (45.0%), this study suggests that the underlying causes of BP control disparities may be different for Mexican Americans compared with blacks. Further, treated men were less likely to reach goal than women, a finding unique to Mexican Americans; in other racial/ethnic subgroups, treated men had a higher rate of BP goal attainment. Furthermore, in multivariate analyses controlling for race/ethnicity, sex is a significant predictor of both awareness and treatment but not of BP control. Finally, rates of awareness, treatment, and control were similar for other (non‐Mexican American) Hispanics to that of white persons with hypertension.
Sex
Sex had a considerable influence within racial/ethnic subgroups, especially in hypertensive Mexican Americans. BP control rates reported by Hajjar and Kotchen 2 using NHANES 1999–2000 for treated blacks, whites, and Mexican Americans are similar to our study's findings. Hajjar and Kotchen also concluded that women had significantly lower rates of BP control. Although Hajjar and Kotchen attempted to examine the interaction of race/ethnicity and sex on BP control, the sample size of NHANES 1999–2000 was insufficient. 2 Hertz et al, 4 using NHANES 1999–2002 data, reported that among blacks and whites, women were more likely not to achieve goal BP. While their analysis excluded Hispanics, our results suggest that among all treated hypertensive persons, sex is not a significant predictor of BP control when controlling for other covariates. The difference between our study and that of Hertz et al may be due to the disparate sex effect in Mexican Americans compared with other racial/ethnic subgroups. Future studies of BP control should consider that race/ethnicity and sex may be mitigating factors.
Implications for Therapy
Our findings have implications for interventions targeted at lowering BP. Consistent with other studies, we found that Mexican Americans are less likely than blacks or whites to have health insurance or to have a routine care site, and are more likely to report no health care visits over the past year. Our study indicates that Mexican Americans are less likely to be aware or treated than other racial/ethnic subgroups. Individuals with health insurance are 2.9 times as likely to be treated than those without, and among the treated US hypertensive population, are 1.9 times as likely to achieve BP control. These considerations are important regarding the current national debate over health care delivery. Differences between whites and both blacks and Mexican Americans persisted, however, while controlling for insurance status, indicating that this does not fully explain differences in awareness, treatment, or control. Other studies have similarly found that lack of health insurance cannot fully explain BP disparities. 4 , 18 Taken together, these findings suggest that strategies targeting access to health care may impact BP control, but successful interventions may be related to other factors.
BP Lowering Among Treated Patients
This study found that only 51% of treated patients in the United States have their BP controlled to a level of <140/90 mm Hg. Clinical recommendations based, in part, on evidence from randomized trials are often not achieved in usual practice. Many factors may contribute to unsatisfactory BP control in treated patients, including inadequate prescribing and medication adherence. Suboptimal patient adherence and persistence with antihypertensive medication has been documented. 19 , 20 Healthy People 2010 21 stresses that improving adherence to antihypertensive therapy is an important public health issue. Failure to intensify therapy despite elevated BP plays a role. Despite evidence that elevated SBP poses greater CV risk than DBP in persons older than 50 years, 9 one study found that when a patient had a DPB >90 mm Hg, physicians intensified antihypertensive therapy only 24% of the time; when SPB was >140 mm Hg and DPB <90 mm Hg, physicians intensified therapy during only 4% of visits. 22
Study Limitations
Some study limitations should be considered. We used the mean of all available BP measurements obtained during a single visit for NHANES participants to identify hypertensive subjects, although guidelines state that BP readings from at least 2 visits on different dates should be used for hypertension diagnosis. 6 Many study variables, including comorbid conditions and antihypertensive medication use, were self‐reported. As NHANES does not ascertain specific medications used, classes of medications used may have differed by race/ethnicity, potentially influencing control rates.
Interventions targeted to blacks and Mexican Americans as well as to the white population are essential. Consistent with prior NHANES analyses, blacks continue to have the highest hypertension prevalence of all racial/ethnic subgroups. 2 Interventions aimed at improving BP control rates in the US Mexican American population may be especially important due to the growing size of this population. While Hispanics constituted 12.6% of the US population in 2000, census data estimate that by 2050, almost 1 in 4 will be of Hispanic origin. 23
CONCLUSIONS
Eliminating racial/ethnic inequities in hypertension management, and thus CV disease with its associated morbidity and mortality, is an important public health issue. One goal of Healthy People 2010 is to eliminate health disparities among specific population segments, including race/ethnic subgroups. 21 This study found that blacks and Mexican Americans in the United States are less likely to achieve BP control compared with whites. Disparities highlighted in this study specific to hypertensive blacks and Mexican Americans, and an effect of sex within racial/ethnic subgroups, suggest that to achieve this goal, public health initiatives must include targeted interventions.
Acknowledgments and disclosure: We thank Jenifer Wogen, MS, MedMentis Consulting LLC, for assistance with manuscript preparation. Ms Frech‐Tamas and Drs Rocha and Preblick are employed by Novartis Pharmaceuticals Corporation, the maker of several drugs indicated for the treatment of hypertension. Dr Giles has served as a consultant and provided research support for manufacturers of antihypertensive medications. Portions of this study were presented at the 20th Annual Scientific Meeting of the American Society of Hypertension (ASH); San Francisco, CA; May 16, 2005. This study was funded by Novartis Pharmaceutical Corporation.
References
- 1. Fields LE, Burt VL, Cutler JA, et al. The burden of adult hypertension in the United States 1999 to 2000: a rising tide. Hypertension. 2004;44:398–404. [DOI] [PubMed] [Google Scholar]
- 2. Hajjar I, Kotchen TA. Trends in prevalence, awareness, treatment, and control of hypertension in the United States, 1988–2000. JAMA. 2003;290:199–206. [DOI] [PubMed] [Google Scholar]
- 3. Centers for Disease Control and Prevention . Racial/ethnic disparities in prevalence, treatment, and control of hypertension‐United States, 1999–2002. MMWR Morb Mortal Wkly Rep. 2005;54:7–9 Available at: http:www.cdc.govmmwrpreviewmmwrhtmlmm5401a3.htm. Accessed October 10, 2005. [PubMed] [Google Scholar]
- 4. Hertz RP, Unger AN, Cornell JA, et al. Racial disparities in hypertension prevalence, awareness, and management. Arch Intern Med. 2005;165:2098–2104. [DOI] [PubMed] [Google Scholar]
- 5. Trevino FM, Moyer ME, Valdez RB, et al. Health insurance coverage and utilization of health services by Mexican Americans, mainland Puerto Ricans, and Cuban Americans. JAMA. 1991;265:233–237. [DOI] [PubMed] [Google Scholar]
- 6. The Seventh Report of the Joint National Committee on Prevention, Detection, Evaluation, and Treatment of High Blood Pressure: the JNC 7 report. JAMA. 2003;289:2560–2572. [DOI] [PubMed] [Google Scholar]
- 7. Psaty BM, Lumley T, Furberg CD, et al. Health outcomes associated with various antihypertensive therapies used as first‐line agents: a network meta‐analysis. JAMA. 2003;289:2534–2544. [DOI] [PubMed] [Google Scholar]
- 8. Flack JM, Casciano R, Casciano J, et al. Cardiovascular disease costs associated with uncontrolled hypertension. Manag Care Interface. 2002;15:28–36. [PubMed] [Google Scholar]
- 9. Giles TD, Berk BC, Black HR, et al. Expanding the definition and classification of hypertension. J Clin Hypertens (Greenwich). 2005;7:505–512. [DOI] [PMC free article] [PubMed] [Google Scholar]
- 10. Julius S, Nesbitt SD, Egan BM, et al, for the Trial of Preventing Hypertension (TROPHY) Study Investigators . Feasibility of treating prehypertension with an angiotensin‐receptor blocker. N Engl J Med. 2006;354:1685–1697. [DOI] [PubMed] [Google Scholar]
- 11. Centers for Disease Control and Prevention . NHANES 1999–2000 public data release file documentation. Available at: http:www.cdc.govnchsdatanhanesgendoc. pdf. Accessed March 3, 2006.
- 12. Centers for Disease Control and Prevention . NHANES 2001–2002 public data release file documentation. Available at: http:www.cdc.govnchsdatanhanesnhanes_01_02general_ data_release_doc.pdf. Accessed March 3, 2006.
- 13. National Institutes of Health . Clinical guidelines on the identification, evaluation, and treatment of overweight and obesity in adults: the evidence report [published correction appears in Obes Res. 1998;66:464]. Obes Res. 1998;6(suppl 2):51S–209S. [PubMed] [Google Scholar]
- 14. World Health Organization. Diet, Nutrition and the Prevention of Chronic Disease. Geneva, Switzerland: World Health Organization; 1990:797. [PubMed] [Google Scholar]
- 15. Centers for Disease Control and Prevention . Anayltic guidelines. Available at: http:www.cdc.govnchsaboutmajornhanesnhanes2003‐204analytical_guidelines.htm. Accessed March 3, 2006.
- 16. SAS Institute Inc . SAS/STAT User's Guide, Version 8. Cary, NC: SAS Institute; 1999. [Google Scholar]
- 17. RTI International . SUDAAN Language Manual, Release 9.0. Research Triangle Park, NC: RTI International; 2004. [Google Scholar]
- 18. Hyman DJ, Pavlik VN. Characteristics of patients with uncontrolled hypertension in the United States. N Engl J Med. 2001;345:479–486. [DOI] [PubMed] [Google Scholar]
- 19. Conlin PR, Gerth WC, Fox J, et al. Four‐year persistence patterns among patients initiating therapy with the angiotensin II receptor antagonist losartan versus other antihypertensive drug classes. Clin Ther. 2001;23:1999–2010. [DOI] [PubMed] [Google Scholar]
- 20. Wogen J, Kreilick CA, Livornese RC, et al. Patient adherence with amlodipine, lisinopril, or valsartan therapy in a usual‐care setting. J Manag Care Pharm. 2003;9:424–429. [DOI] [PMC free article] [PubMed] [Google Scholar]
- 21. US Dept of Health and Human Services . Healthy People 2010: Understanding and Improving Health and Objectives for Improving Health. 2nd ed. Washington, DC: US Government Printing Office; 2000. [Google Scholar]
- 22. Hyman DJ, Pavlik VN, Vallbona C. Physician role in lack of awareness and control of hypertension. J Clin Hypertens (Greenwich). 2000;2:324–330. [PubMed] [Google Scholar]
- 23. US Census Bureau . 2004 US interim projections by age, sex, race, and Hispanic origin. Available at: http:www.census.govipcwwwusinterimproj. Accessed February 15, 2006.