

Abstract
The goal of this study was to examine the association between adiponectin and low‐grade albuminuria in nondiabetic persons and whether it differed between obese and nonobese individuals. Urinary albumin excretion (UAE) was assessed by overnight collection in 157 participants. Overall, as anticipated, 24‐hour systolic blood pressure and fasting glucose levels were independent determinants of UAE (β=0.254 and 0.176, respectively, P<.05). In obese persons (body mass index [BMI] ≥25 kg/m2; n=63), adiponectin value was a significant negative determinant of UAE (β=−0.256, P<.05) independent of blood pressure and glucose levels, whereas in nonobese participants (n=94) it was not. In an analysis of BMI and the median value of adiponectin (9.9 µg/mL), UAE was found to be significantly higher in obese persons with low adiponectin levels than in obese persons with high adiponectin levels (9.20 vs 5.11 µg/min; P<.05), even after adjustment for age, sex, blood pressure level, and glucose level. There was an inverse association between adiponectin and low‐grade albuminuria in obese nondiabetic persons.
Microalbuminuria, defined as a urinary albumin excretion (UAE) value of 30 to 299 mg/24 h or an equivalent amount using a timed overnight urine collection (20–199 µg/min), is known to be a marker of generalized endothelial dysfunction and an independent predictor of cardiovascular morbidity and mortality in persons with or without diabetes mellitus. 1 , 2 , 3 The association between UAE and major cardiac events has been shown to extend to urinary albumin levels below the currently accepted cutoff for microalbuminuria (low‐grade albuminuria). 2 , 3 UAE is considered to be determined by not only blood pressure (BP) levels but also various metabolic factors, including visceral obesity, insulin resistance, and dyslipidemia. 4 , 5 , 6 Thus, UAE reflects a clustering of these metabolic risk factors and is indeed a part of and even an early marker of the metabolic syndrome.
Although the potential mechanisms underlying these associations, especially in the case of low‐grade albuminuria, have not been clearly established, recent in vitro studies have implicated adipocytokines as potentially important mediators of renal disease pathophysiology. 7 Adiponectin, the most abundant of the factors known to be produced by adipocytes, is thought to enhance insulin sensitivity and exerts anti‐inflammatory or other pleiotropic effects. 8 , 9 Adiponectin seems to play a protective role against vascular injury, both through and separately from its favorable metabolic effects. 10 Tsioufis and colleagues 11 recently reported that adiponectin was a negative predictor of albuminuria independent of age, body mass index (BMI), and BP level. About 30% of the study population had microalbuminuria, however, a percentage considerably higher than in the general population 12 ; the relationship was explored only in hypertensive patients. Thus, whether these results can be extended to more healthy persons, especially nondiabetic individuals, is less clear. Whether this association is also recognized even in the case of low‐grade albuminuria has not been explored. Because adiponectin is considered to have a protective role against obesity‐related vascular injury, the association between adiponectin and albuminuria may be different between obese and nonobese persons. Thus, the purpose of our study was to assess the relationship between adiponectin and low‐grade albuminuria in nondiabetic persons and whether the association was different among obese and nonobese individuals.
METHODS
Study Population
This cross‐sectional study was conducted in 1998 in the Miyori district in the rural community of Kinugawa in Tochigi Prefecture. A total of 181 volunteers were recruited via a local advertisement (33% of the 541 residents were aged 20 years or older) and gave informed consent before study enrollment. 13 , 14 The survey comprised a questionnaire, which included questions on cardiovascular disease ([CVD] myocardial infarction, stable or unstable angina pectoris, stroke, peripheral arterial disease, and heart failure) and smoking. Persons who had diabetes mellitus (defined as a fasting blood glucose level ≥126 mg/dL or the patient currently receiving diabetes mellitus therapy) or macroalbuminuria (UAE value ≥200 µg/min) were excluded from participation in the study. The study protocol was approved by the internal review board of Jichi Medical University School of Medicine.
Definition of Obesity
Asian populations have a higher percentage of body fat at lower BMI levels than white or European populations. Because there is increasing evidence of the emerging high prevalence of type 2 diabetes and increased cardiovascular risk factors in parts of Asia where the average BMI is below the cutoff of 25 kg/m2, obesity was defined as a BMI ≥25 kg/m2, according to a World Health Organization expert consultation as well as the Japan Society for the Study of Obesity. 15 , 16
Assessment of BP Level and UAE
Office BP was measured with a mercury sphygmomanometer in a sitting position after a 5‐minute rest. The mean of 2 measurements was recorded. Ambulatory BP monitoring (ABPM) was performed with an automatic device (TM‐2425; A&D Co Inc, Tokyo, Japan) at 30‐minute intervals during the daytime and nighttime. The accuracy of these devices had previously been validated. 17 The ambulatory BP data used in the present study were obtained by the oscillometric method. Patients were advised to maintain their usual daily activities. We used the guidelines of the Japanese Society of Hypertension for the management of hypertension and defined ambulatory hypertension as a mean 24‐hour systolic BP (SBP) level ≥135 mm Hg and/or a mean 24‐hour diastolic BP (DBP) level ≥80 mm Hg. 18 Hypertension was defined as both office SBP level ≥140 mm Hg or DBP level ≥90 mm Hg and mean 24‐hour ambulatory SBP level ≥135 mm Hg or DBP level ≥80 mm Hg and/or use of antihypertensive drugs. UAE was measured by nephelometry using LX reagent “Eiken” Alb‐II (Eiken Chemical Company, Tokyo, Japan; interassay coefficient of variation, 3.7%). To minimize the confounding influence of daily physical activity and to facilitate the collection procedure, urine was collected from 7 pm to 7 am. Microalbuminuria calculated from overnight timed urine collection was defined as 20 to 199 µg/min.
Assessment of Other Variables
Anthropometrics and the following parameters were measured at baseline after an overnight fast: glucose parameters (fasting glucose, insulin, and homeostasis model assessment‐insulin resistance [HOMA‐IR]) and lipid parameters (triglycerides [TGs], total cholesterol, high‐density lipoprotein cholesterol [HDL‐C]), and low‐density lipoprotein cholesterol [LDL‐C]). Insulin sensitivity was quantified using HOMA‐IR as (plasma insulin × plasma glucose) ÷ 405. 19 For the purpose of the present study, serum samples that had been taken at baseline and stored at −70°C were thawed and assayed for adiponectin levels using an enzyme‐linked immunosorbent assay system (Otsuka Pharmaceutical Co, Ltd, Tokyo, Japan; interassay coefficient of variation, <10%).
Statistical Analyses
Comparison between groups was performed using Student t test for continuous variables and chi‐squared tests for categoric variables. One‐way analyses of variance and analyses of covariance were performed to detect differences among the 4 groups of participants divided according to BMI (<25 or ≥25 kg/m2) and adiponectin levels above or below the median (<9.9 or ≥9.9 µg/mL). Tukey's honestly significant differences test was used for multiple pairwise comparisons of means among groups. Variables with skewed distribution were logarithmically transformed before analysis. To identify factors associated with the development of UAE, the analyses of univariate and forced multivariate regression models were performed with SPSS version 11 software (SPSS Inc, Chicago, IL). Statistical significance was defined as P<.05.
RESULTS
Demographic Characteristics of the Study Population
A total of 181 persons were initially enrolled in this study. Of these, 9 were excluded because ABPM could not be performed because of technical problems, 2 were excluded because of unsatisfactory blood sampling, 3 were excluded because they had macroalbuminuria, and 10 were excluded because they had diabetes. The characteristics of the remaining 157 persons who constituted the study sample are shown in Table I. There were significant differences between obese and nonobese participants in office and ambulatory BP levels, glucose values (fasting glucose, insulin, and HOMA‐IR), adiponectin levels, estimated glomerular filtration rate, and UAE (Table I). Microalbuminuria was present in 7 participants (4%). The number of participants receiving antihypertensive treatment was 40 (25%), and the mean 24‐hour BP level among these patients was 133.5±15.4/79.7±9.1 mm Hg. Nineteen (12%) patients who were not receiving medication had sustained hypertension (both office and ambulatory hypertension); the mean 24‐hour BP level in these patients was 136.4±10.5/83.7±5.6 mm Hg. The number of participants taking lipid lowering medications was 4 (3%). No one had a history of previous CVD.
Table I.
Demographic Characteristics of the Study Population
| Variable | Total Participants (N=157) | Participants With BMI <25 kg/m 2 (n=94) | Participants With BMI ≥25 kg/m 2 (n=63) | P Value a |
|---|---|---|---|---|
| Age, y | 60.7±10.6 | 61.5±11.3 | 59.4±9.3 | .230 |
| Men, No. (%) | 72 (46) | 44 (47) | 28 (44) | .773 |
| BMI, kg/m2 | 24.2±3.1 | 22.1±1.7 | 27.3±1.7 | <.001 |
| Waist size, cm | 77.6±9.0 | 73.2±7.1 | 84.3±7.4 | <.001 |
| Hip size, cm | 90.1±6.1 | 86.9±4.4 | 94.8±5.2 | <.001 |
| Current smoker, No. (%) | 27 (17) | 17 (18) | 10 (16) | .721 |
| Taking antihypertensive medications, No. (%) | 40 (25) | 20 (21) | 20 (32) | .142 |
| Office SBP, mm Hg | 136.1±20.8 | 132.7±19.9 | 141.1±21.2 | .013 |
| Office DBP, mm Hg | 84.2±11.1 | 82.4±10.7 | 86.9±11.0 | .011 |
| 24‐H SBP, mm Hg | 123.7±15.3 | 121.1±14.1 | 127.7±16.1 | .007 |
| 24‐H DBP, mm Hg | 75.2±8.9 | 74.2±8.5 | 76.7±9.3 | .079 |
| Fasting glucose, mg/dLb | 92.0 (87.0–98.7) (4.1–7.2) | 91.0 (87.0–96.2) (3.8–6.3) | 93.0 (87.0–100.0) (4.8–8.3) | .172 |
| HOMA‐IRb | 1.3 (0.9–1.6) | 1.1 (0.9–1.4) | 1.5 (1.1–2.0) | <.001 |
| Total cholesterol, mg/dL | 191.4±33.3 | 187.9±37.3 | 196.6±25.6 | .111 |
| Triglycerides, mg/dLb | 99.0 (75.0–154.0) | 91.5 (71.0–152.5) | 104.0 (87.0–163.0) | .184 |
| HDL‐C, mg/dL | 54.1±12.3 | 54.8±12.7 | 52.8±11.3 | .311 |
| Adiponectin, µg/mLb | 9.9 (6.6–14.0) | 10.7 (6.8–17.0) | 8.9 (6.6–12.9) | .013 |
| Creatinine, mg/dL | 0.9±0.2 | 0.9±0.2 | 0.9±0.1 | .979 |
| UAE, µg/minb | 5.0 (3.3–7.57) | 4.2 (3.1–7.0) | 6.5 (3.8–10.6) | .006 |
| Data are expressed as mean ± SD or median (25th percentile to 75th percentile) unless otherwise indicated. a P values were calculated by nonpaired Student t test between nonobese (BMI ≥25 kg/m2) and obese persons (BMI ≥25 kg/m2). bVariables are skewed and were logarithmically transformed before analysis. Statistical significance was defined as P<.05. Abbreviations: BMI, body mass index; DBP, diastolic blood pressure; HDL‐C, high‐density lipoprotein cholesterol; HOMA‐IR, homeostasis model assessment‐insulin resistance; SBP, systolic blood pressure; UAE, urinary albumin excretion. | ||||
Factors Associated With Adiponectin Value
Adiponectin level was significantly correlated with age (r=0.263; P<.001), female sex (r=0.434; P<.001), BMI (r=−0.229; P=.004), waist size (r=−0.360; P<.001), 24‐hour DBP level (r=−0.213; P=.008), fasting insulin level (r=−0.224; P=.005), triglyceride level (r=−0.416; P<.001), and HDL‐C level (r=−0.392; P<.001). In a forced multiple regression analysis, age (β=0.210; P<.001), female sex (β=0.308; P<.001), and triglyceride level (β=−0.182; P=.021) were independently associated with adiponectin levels.
Factors Associated With UAE Value
In the total study population (N=157), UAE level was found to be significantly correlated with 24‐hour SBP level (r=0.338; P<.001), BMI (r=0.236; P=.003), waist size (r=0.281; P<.001), fasting glucose level (r=0.256; P=.001), and fasting insulin level (r=0.158; P=.049) and negatively correlated with adiponectin level (r=−0.174; P=.029; Table II). In a forced multiple regression analysis including the significant covariates with UAE , 24‐hour SBP and fasting glucose values were the independent determinants of UAE (β=0.254; P=.001 and β=.176; P=.021, respectively). In obese persons (n=63), UAE value was found to be significantly correlated with 24‐hour SBP level (r=0.358; P=.004) and fasting glucose level (r=0.308; P=.011) and negatively correlated with adiponectin level (r=−0.302; P=.016; Table II and Figure 1). In a forced multiple regression analysis, an independent positive correlation was exhibited between UAE value and 24‐hour SBP level (β=0.265; P=.031) and fasting glucose level (β=0.213; P=.078), and there was a negative correlation between UAE value and adiponectin level (β=−0.256; P=.029).
Table II.
Correlation of (Log‐Transformed) UAE and Other Variables
| Variable | Total Participants (N=157) | Participants With BMI <25 kg/m 2 (n=94) | Participants With BMI ≥25 kg/m 2 (n=63) | |||
|---|---|---|---|---|---|---|
| Pearson's Correlation | P Value | Pearson's Correlation | P Value | Pearson's Correlation | P Value | |
| Age, y | 0.039 | .627 | 0.236 | .022 | −0.148 | .517 |
| Sex: 1 = men, 2 = women | −0.148 | .065 | −0.129 | .214 | −0.191 | .135 |
| BMI, kg/m2 | 0.236 | .003 | −0.051 | .627 | 0.233 | .067 |
| Waist size, cm | 0.281 | <.001 | 0.149 | .152 | 0.239 | .059 |
| Hip size, cm | 0.178 | .026 | 0.007 | .950 | 0.091 | .477 |
| Current smoking: 0 = no, 1 = yes | 0.077 | .338 | 0.033 | .753 | 0.146 | .253 |
| Taking antihypertensive medication: 0 = no, 1 = yes | 0.198 | .013 | 0.159 | .126 | 0.100 | .120 |
| Office SBP, mm Hg | 0.347 | <.001 | 0.315 | .002 | 0.327 | .009 |
| Office DBP, mm Hg | 0.329 | <.001 | 0.254 | .014 | 0.352 | .005 |
| 24‐H SBP, mm Hg | 0.338 | <.001 | 0.252 | .014 | 0.358 | .004 |
| 24‐H DBP, mm Hg | 0.316 | <.001 | 0.289 | .005 | 0.307 | .014 |
| Log fasting glucose, mg/dL | 0.256 | .001 | 0.162 | .118 | 0.308 | .011 |
| Log HOMA‐IR | 0.205 | .010 | 0.060 | .563 | 0.197 | .122 |
| Total cholesterol, mg/dL | −0.004 | .957 | −0.171 | .100 | 0.167 | .191 |
| Log triglycerides, mg/dL | 0.041 | .606 | 0.006 | .955 | 0.035 | .779 |
| HDL‐C, mg/dL | −0.045 | .575 | −0.101 | .332 | 0.055 | .666 |
| Log adiponectin, µg/mL | −0.174 | .029 | −0.001 | .990 | −0.302 | .016 |
| Creatinine, mg/dL | 0.125 | .119 | 0.112 | .283 | 0.161 | .208 |
| Univariate regression analyses were performed to assess the association with (log‐transformed) urinary albumin excretion (UAE). Statistical significance was defined as P<.05. Abbreviations: BMI, body mass index; DBP, diastolic blood pressure; HDL‐C, high‐density lipoprotein cholesterol; HOMA‐IR, homeostasis model assessment‐insulin resistance; SBP, systolic blood pressure. | ||||||
Figure 1.
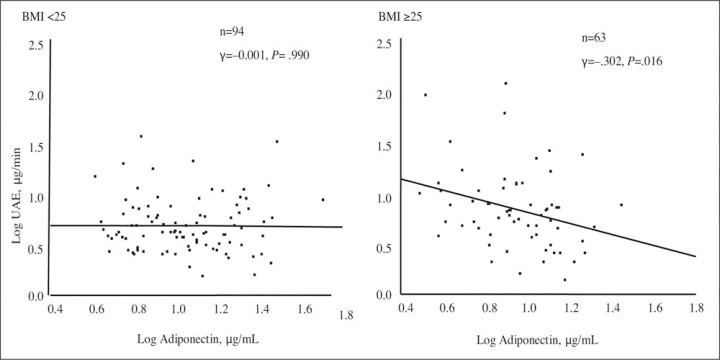
Correlation of (log‐transformed) urinary albumin excretion (UAE) and adiponectin in nonobese (n=94) and obese participants (n=63). Univariate linear regression analysis was performed by Pearson's correlation coefficient analysis. Statistical significance was defined as P<.05. BMI indicates body mass index.
In contrast, in nonobese persons (n=94), age and 24‐hour SBP level were independent determinants of UAE level (β=0.212; P=.036 and 0.231; P=.023, respectively), but neither glucose value nor adiponectin level were significant determinants of UAE value (Figure 1). The patients were divided into 4 groups according to BMI (<25, ≥25 kg/m2) and whether their adiponectin levels were above or below the overall median (<9.9, ≥9.9 µg/mL). The median (interquartile range) adiponectin levels in the groups with adiponectin levels above or below the median were 10.7 (6.8–17.0) µg/mL and 8.9 (6.6–12.9) µg/mL, respectively. As expected, obese persons had a significantly larger waist and hip size and a more insulin‐resistant state compared with lean persons (Table I). Among obese participants, there were no significant differences between the low‐ and high‐adiponectin groups in terms of waist size (85.2 vs 83.0 cm; P=.545), hip size (94.6 vs 95.1 cm; P=.966), insulin resistance (HOMA‐IR, 1.8 vs 1.5; P=.119), or 24‐hour SBP level (129.0 vs 125.6 mm Hg; P=.772). A significant increase in UAE was observed in obese persons with low adiponectin levels, however, compared with obese persons who had high adiponectin levels (9.20 vs 5.11 µg/min; P=.046), nonobese participants with low adiponectin levels (vs 5.01 µg/min; P=.032), and nonobese persons with high adiponectin levels (vs 4.58 µg/min; P=.011) even after adjustment for age, sex, 24‐hour SBP level, and fasting glucose level (Figure 2).
Figure 2.
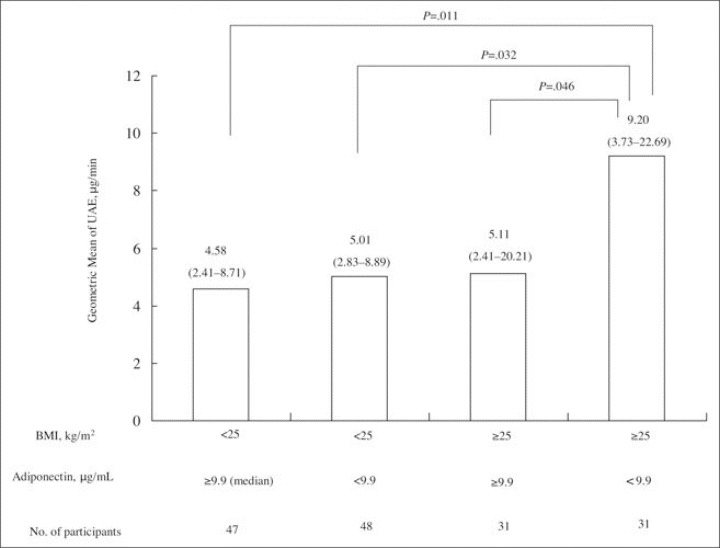
Geometric mean of urinary albumin excretion (UAE) according to body mass index (BMI) and adiponectin levels. Patients were divided into 4 groups according to BMI (<25 and ≥25 kg/m2) and adiponectin levels above and below the median (9.9 mg/mL). P value was calculated by analysis of covariance adjusted by 24‐hour systolic blood pressure level, sex, age, and fasting glucose level. Statistical significance was defined as P<.05.
DISCUSSION
There was an inverse association between adiponectin level and low‐grade albuminuria in obese nondiabetic persons, whereas no association was recognized in nonobese, nondiabetic persons. In obese participants, UAE was determined not only by BP level but also by glucose and adiponectin levels, whereas age and BP level were independent determinants in nonobese participants. Four percent of our population had microalbuminuria, and the vast majority of the participants had UAE <20 µg/min; it seems likely that these results were in agreement with those of earlier general population surveys including apparently healthy people. 12 , 20 The major novel finding in our study was that in obese persons without diabetes, adiponectin was a significant negative determinant of low‐grade albuminuria independent of its metabolic or BP effects; in nonobese, nondiabetic persons, there was no relationship between adiponectin value and albuminuria.
Association Between Adiponectin Value and Low‐Grade Albuminuria
We demonstrated the possibility that adiponectin value was a negative determinant of the initial development of albuminuria from obesity‐related renal injury, because the relationship between adiponectin level and albuminuria was recognized even before microalbuminuria had developed. UAE reflects generalized endothelial dysfunction, and various metabolic factors including visceral obesity, insulin resistance, and dyslipidemia are involved in the etiology of UAE. 4 , 5 , 6 Thus, our findings suggested that adiponectin level could have a protective role against obesity‐related vascular endothelial dysfunction that is partly caused by BP and glucose values. This agrees with the results of previous experiments 21 , 22 that showed that adiponectin plays some protective role against atherosclerotic vascular development at an early stage, both through and independently of its favorable metabolic effects. 10 For example, Ouchi and colleagues 21 and Yokota and associates 22 demonstrated that adiponectin inhibited the expression of adhesion molecules on endothelial cells and the transformation of macrophages to foam cells, an early step in the continuum of atherosclerotic vascular damage. These data suggest that hypoadiponectinemia may be associated with a higher incidence of vascular disease from an early phase. Such a possibility has not been described in a previous clinical study, however. Recently, Pilz and associates 23 reported that carotid intima‐media thickness (IMT), an early marker of atherosclerosis, was already associated with hypoadiponectinemia in obese children. UAE may be more effective at identifying individuals with early vascular damage than IMT is, however. 24 , 25 Our study excluded diabetic patients, and the vast majority of the participants (96%) had low‐grade albuminuria; our findings thus suggested that adiponectin might be operative at an early stage of atherosclerotic vascular damage. Why the association between adiponectin and low‐grade albuminuria was detected only in the obese but not in the nonobese persons was unclear, but several possible reasons are proposed by some experimental studies. Maeda and colleagues 26 showed that adiponectin knockout (KO) mice showed no specific phenotypes when no high‐fat or high‐sucrose diet was loaded, but when high‐fat and high‐sucrose diet was loaded, marked elevation of glucose levels and insulin resistance were found. Okamoto and colleagues 27 showed that there is no existence of adiponectin in the normal vascular walls in rabbits; however, marked attachment was detected in the balloon‐injured vascular wall. These findings suggested that adiponectin might work protectively against the metabolic or vascular abnormalities from the fat when its damage is still less severe, whereas it has no specific effects in the absence of such abnormalities. Tsioufis and colleagues 11 also observed an inverse correlation between adiponectin level and albuminuria, although that relationship was shown only in hypertensive patients, and the level of albuminuria was higher than that in the present study. Our results showed that adiponectin value had significant positive correlations with age, sex (female), and HDL‐C level and significant negative correlations with BMI, fasting insulin level, HOMA‐IR , and triglyceride level. Because some of these factors were also risk factors for UAE, the relationship between adiponectin level and UAE may have been attenuated in the multivariate analysis. The present results were still significant after full adjustments for significant covariate risk factors of UAE, however. Thus, we considered the impacts of adiponectin level on albuminuria to be independent of its favorable metabolic and BP effects.
BP and UAE
The findings of the present study are in keeping with those of previous cross‐sectional and prospective studies 28 , 29 that show that BP level is the main determinant of albuminuria in obese as well as in nonobese participants. This relationship seems to be continuous from low‐grade albuminuria, and UAE in the normoalbuminuric range was positively associated with 24‐hour BP level. Because our study used 24‐hour ABPM, which has been shown to be the best predictor of microalbuminuria and macroalbuminuria, 28 , 29 the impact of BP values on albuminuria might have been further reinforced.
Study Limitations
Our study had several limitations. First, our results were based on a cross‐sectional study, and thus our conclusions were limited to establishing a cause‐effect relationship between UAE and adiponectin value. Because our study was a hypothesis‐generating survey, longitudinal and intervention studies will be needed to clarify the relevance of the adiponectin‐albuminuria association. Second, since we studied only persons of Japanese ethnicity and we defined obesity as BMI ≥25 kg/m2, which is much lower than the BMI used to define obesity in white or European populations, our results cannot be applied to other ethnicities. Third, our study was voluntary, and therefore it might have been subject to a “healthy worker effect” bias. Finally, the lack of data on treatment effects and other confounding factors was another limitation of our study. We did not collect data on the class of antihypertensive medications our participants were taking, which could have affected UAE as well as adiponectin level.
CONCLUSIONS
Our study showed an inverse association between adiponectin value and low‐grade albuminuria independent of its metabolic or BP effects in obese nondiabetic persons. Our results suggested the possibility that adiponectin plays a role as an endogenous protective factor against the development of albuminuria from obesity‐related initial renal injury. This was a hypothesis‐generating survey, however, and longitudinal and intervention studies will be needed to clarify our hypothesis.
Acknowledgments:
We thank Drs Osamu Kunii, Toshiyuki Ojima, and Yuji Umeda for carrying out the protocol for this study.
References
- 1. Redon J. Urinary albumin excretion: lowering the threshold of risk in hypertension. Hypertension. 2005;46: 19–20. [DOI] [PubMed] [Google Scholar]
- 2. Klausen K, Borch‐Johnsen K, Feldt‐Rasmussen B, et al. Very low levels of microalbuminuria are associated with increased risk of coronary heart disease and death independently of renal function, hypertension, and diabetes. Circulation. 2004;110: 32–35. [DOI] [PubMed] [Google Scholar]
- 3. Arnlov J, Evans JC, Meigs JB, et al. Low‐grade albuminuria and incidence of cardiovascular disease events in nonhypertensive and nondiabetic individuals: the Framingham Heart Study. Circulation. 2005;112: 969–975. [DOI] [PubMed] [Google Scholar]
- 4. Palaniappan L, Carnethon M, Fortmann SP. Association between microalbuminuria and the metabolic syndrome. NHANES III. Am J Hypertens. 2003;16: 952–958. [DOI] [PubMed] [Google Scholar]
- 5. Rowley K, O'Dea K, Best JD. Association of albuminuria and the metabolic syndrome. Curr Diab Rep. 2003;3: 80–86. [DOI] [PubMed] [Google Scholar]
- 6. El‐Atat FA, Stas SN, McFarlane SI, et al. The relationship between hyperinsulinemia, hypertension and progressive renal disease. J Am Soc Nephrol. 2004;15: 2816–2827. [DOI] [PubMed] [Google Scholar]
- 7. Wiecek A, Kokot F, Chudek J, et al. The adipose tissue‐a novel endocrine organ of interest to the nephrologist. Nephrol Dial Transplant. 2002;17: 191–195. [DOI] [PubMed] [Google Scholar]
- 8. Kadowaki T, Yamauchi T, Kubota N, et al. Adiponectin and adiponectin receptors in insulin resistance, diabetes, and the metabolic syndrome. J Clin Invest. 2006;116: 1784–1792. [DOI] [PMC free article] [PubMed] [Google Scholar]
- 9. Kadowaki T, Yamauchi T. Adiponectin and adiponectin receptors. Endocr Rev. 2005;26: 439–451. [DOI] [PubMed] [Google Scholar]
- 10. Matsuzawa Y, Funahashi T, Kihara S, et al. Adiponectin and metabolic syndrome. Arterioscler Thromb Vasc Biol. 2004;24: 29–33. [DOI] [PubMed] [Google Scholar]
- 11. Tsioufis C, Dimitriadis K, Chatzis D, et al. Relation of microalbuminuria to adiponectin and augmented C‐reactive protein levels in men with essential hypertension. Am J Cardiol. 2005;96: 946–951. [DOI] [PubMed] [Google Scholar]
- 12. Jensen JS, Feldt‐Rasmussen B, Borch‐Johnsen K, et al. Urinary albumin excretion in a population based sample of 1011 middle aged non‐diabetic subjects. The Copenhagen City Heart Study Group . Scand J Clin Lab Invest. 1993;53: 867–872. [DOI] [PubMed] [Google Scholar]
- 13. Hoshide S, Kario K, Hoshide Y, et al. Associations between nondipping of nocturnal blood pressure decrease and cardiovascular target organ damage in strictly selected community‐dwelling normotensives. Am J Hypertens. 2003;16: 434–438. [DOI] [PubMed] [Google Scholar]
- 14. Kaneda R, Kario K, Hoshide S, et al. Morning blood pressure hyper‐reactivity is an independent predictor for hypertensive cardiac hypertrophy in a community‐dwelling population. Am J Hypertens. 2005;18: 1528–1533. [DOI] [PubMed] [Google Scholar]
- 15. Choo V. WHO reassesses appropriate body‐mass index for Asian populations. Lancet. 2002;360: 235. [DOI] [PubMed] [Google Scholar]
- 16. The Examination Committee of Criteria for ‘Obesity Disease’ in Japan, Japan Society for the Study of Obesity. New criteria for ‘Obesity Disease’ in Japan. Circ J. 2002;66: 987–992. [DOI] [PubMed] [Google Scholar]
- 17. Tochikubo O, Ikeda A, Miyazima E, et al. Effects of insufficient sleep on blood pressure monitored by a new multi‐biomedical recorder. Hypertension. 1996;27: 1318–1324. [DOI] [PubMed] [Google Scholar]
- 18. Official Journal Of The Japanese Society Of Hypertension. Japanese Society of Hypertension Guidelines for the Management of Hypertension (JSH 2004). Hypertens Res. 2006;29(suppl):111P. [DOI] [PubMed] [Google Scholar]
- 19. Matthews DR, Hosker JP, Rudenski AS, et al. Homeostasis model assessment: insulin resistance and beta‐cell function from fasting plasma glucose and insulin concentrations in man. Diabetologia. 1985;28: 412–419. [DOI] [PubMed] [Google Scholar]
- 20. Levey AS, Coresh J, Balk E, et al. National Kidney Foundation. National Kidney Foundation practice guidelines for chronic kidney disease: evaluation, classification, and stratification. Ann Intern Med. 2003;139: 137–147. [DOI] [PubMed] [Google Scholar]
- 21. Ouchi N, Kihara S, Arita Y, et al. Novel modulator for endothelial adhesion molecules: adipocyte‐derived plasma protein adiponectin. Circulation. 1999;100: 2473–2476. [DOI] [PubMed] [Google Scholar]
- 22. Yokota T, Oritani K, Takahashi I, et al. Adiponectin, a new member of the family of soluble defense collagens, negatively regulates the growth of myelomonocytic progenitors and the functions of macrophages. Blood. 2000;96: 1723–1732. [PubMed] [Google Scholar]
- 23. Pilz S, Horejsi R, Moller R, et al. Early atherosclerosis in obese juveniles is associated with low serum levels of adiponectin. J Clin Endocrinol Metab. 2005;90: 4792–4796. [DOI] [PubMed] [Google Scholar]
- 24. Agewall S, Bjorn F. Microalbuminuria and intima‐media thickness of the carotid artery in clinically healthy men. Atherosclerosis. 2002;164: 161–166. [DOI] [PubMed] [Google Scholar]
- 25. Kramer H, Jacobs DR Jr, Bild D, et al. Urine albumin excretion and subclinical cardiovascular disease. The Multi‐Ethnic Study of Atherosclerosis. Hypertension. 2005;46: 38–43. [DOI] [PubMed] [Google Scholar]
- 26. Maeda N, Shimomura I, Kishida K, et al. Diet‐induced insulin resistance in mice lacking adiponectin/ACRP30. Nat Med. 2002;8: 731–737. [DOI] [PubMed] [Google Scholar]
- 27. Okamoto Y, Arita Y, Nishida M, et al. An adipocyte‐derived plasma protein, adiponectin, adheres to injured vascular walls. Horm Metab Res. 2000;32: 47–50. [DOI] [PubMed] [Google Scholar]
- 28. Moran A, Palmas W, Pickering TG, et al. Office and ambulatory blood pressure are independently associated with albuminuria in older subjects with type 2 diabetes. Hypertension. 2006;47: 955–961. [DOI] [PubMed] [Google Scholar]
- 29. Pascual JM, Rodilla E, Gonzalez C. et al. Long‐term impact of systolic blood pressure and glycemia on the development of microalbuminuria in essential hypertension. Hypertension. 2005;45: 1125–1130. [DOI] [PubMed] [Google Scholar]