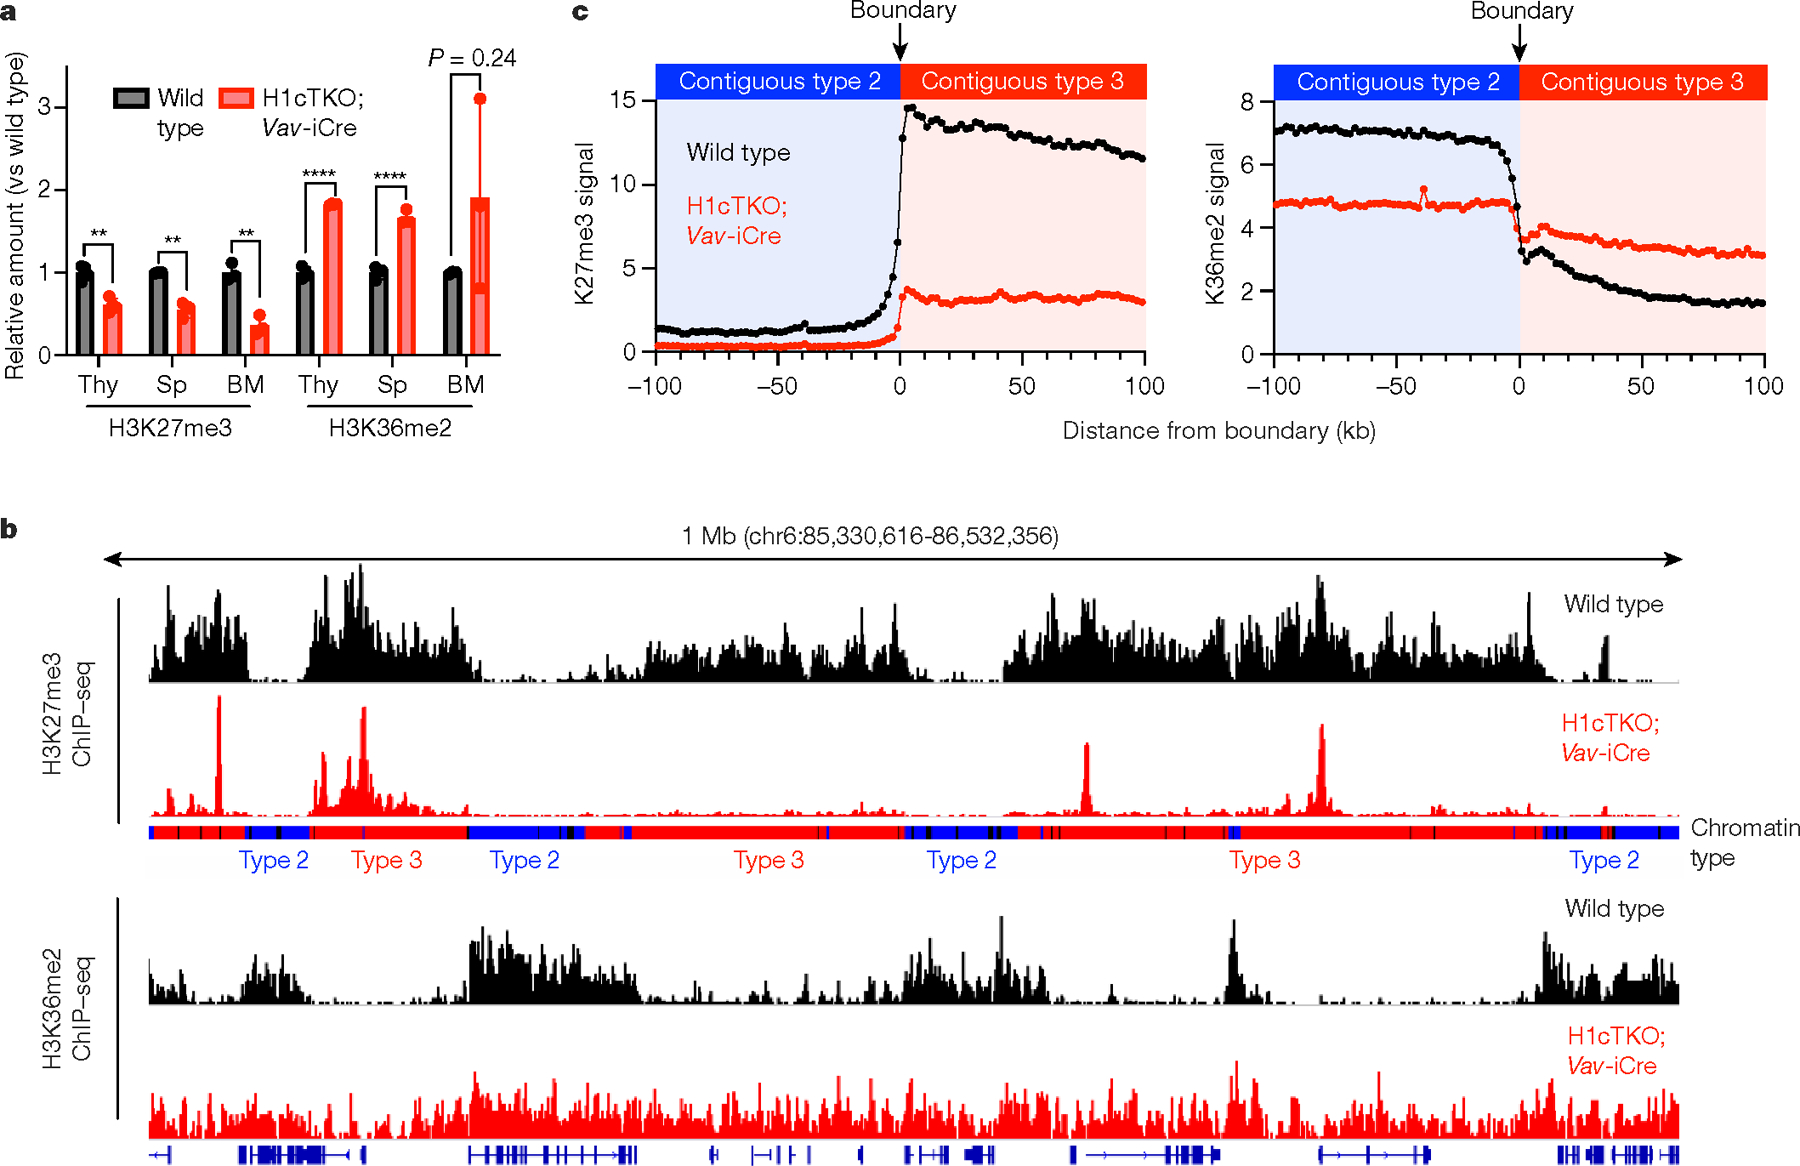
Fig. 3 |. H1 promotes H3K27 methylation and inhibits H3K36 methylation in vivo.

a, Acid-extracted chromatin from total mouse spleen, thymus and bone marrow was analysed by mass spectrometry. Relative abundance of peptides containing H3K36me2 and H3K27me3 from wild-type (black) and H1cTKO;Vav-iCre (red) tissues is shown. Thy, thymus; Sp, spleen; BM, bone marrow (n = 4 (spleen), 3 (thymus) and 3 (bone marrow) mice per genotype; data are mean ± s.d., unpaired t-test)), **P < 0.01, ****P < 0.0001. b, Linear genome browser views of H3K27me3 (top two tracks) and H3K36me2 (bottom two tracks) ChIP-seq signals in wild-type (black) and H1cTKO;Vav-iCre (red) CD8+ splenic T cells. Chromatin types are annotated as type 1 (black), type 2 (blue) or type 3 (red). c, Genome-wide meta-boundary analysis showing the average levels of H3K27me3 (left) and H3K36me2 (right) within a 200-kb window around the chromatin-type boundaries for all contiguous 100-kb regions of type 2 and type 3 chromatin in wild-type (black) and H1cTKO; Vav-iCre (red) CD8+ splenic T cells.
